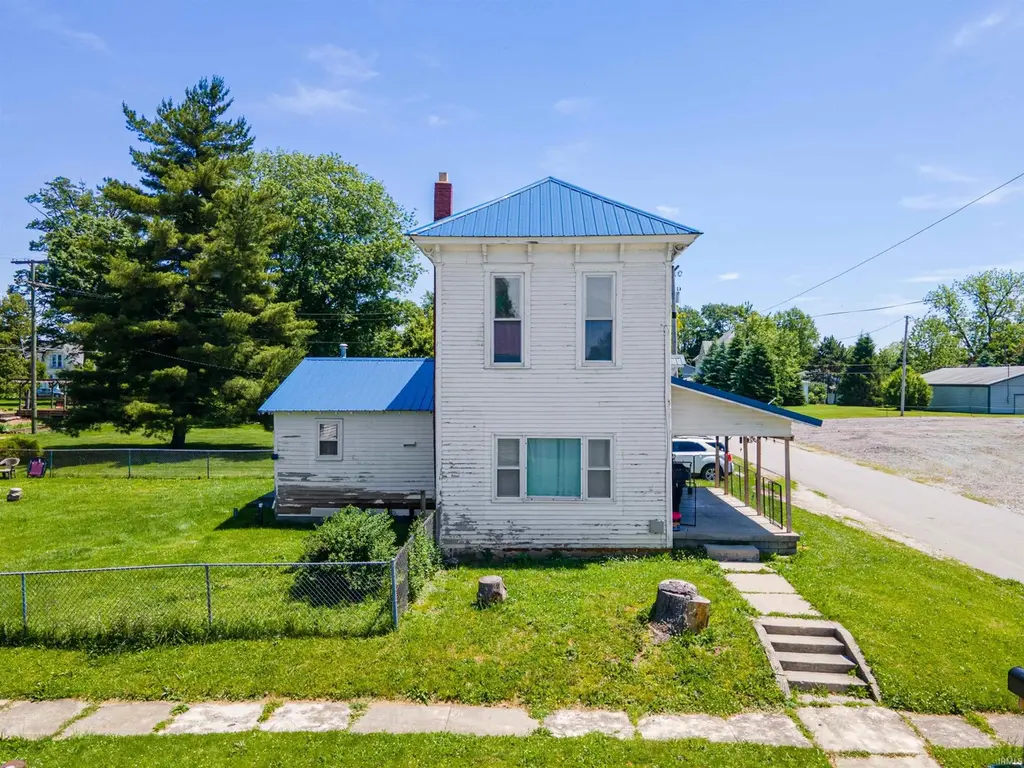
123 S Vine St · Fairmount, IN
Flood risk 1/10 · Minimal
- FEMA flood zone
- X (unshaded)
- Chance of flooding over 30 yrs
- 0.0%
- Est. flood insurance / yr
- $507 – $1,088
Fire risk 1/10 · Minimal
- Est. fire insurance / yr
- $717 – $1,331
Heat risk 3/10 · Minor
- Hot days now (above 100°F)
- 7 days/yr
- Hot days in 30 yrs
- 18 days/yr
Wind risk 2/10 · Minimal
- Chance of severe wind over 30 yrs
- —
Air-quality risk 2/10 · Minimal
- Unhealthy air days now
- 1 days/yr
- Unhealthy air days in 30 yrs
- 2 days/yr
Risk factors via First Street. Map © Google.
Why this score? — see what drove the B- grade
The composite is a weighted blend of 9 inputs, each scored 0–100. Each bar is that input's sub-score; the figure is the points it added to the 100-point composite (weight × sub-score).
- Cash flow +30.0/30.0
- 1% rule +10.0/10.0
- DSCR +10.0/10.0
- ARV discount +7.5/15.0
- Livability +3.4/5.0
- Schools +3.1/10.0
- Rent growth +2.5/5.0
- Condition / age +2.5/5.0
- Appreciation +0.0/10.0
$69,900
🖨 Deal sheet 📄 Offer letter ✓ Due diligence
Listing remarks
This Fairmount home is full of opportunity and ready for new owners! Located in a beautiful small town within walking distance to the park, you can relax on the covered front porch and enjoy local favorites such as the James Dean Festival. Inside, you'll love the spacious living room with tall ceilings, a large kitchen fully equipped with appliances, and a nice dining area that flows easily into the kitchen. The home also features updated vinyl plank flooring, new hot water heater, newer back screen door, an updated bathroom, and comfortable bedrooms. Sitting on a nice corner lot with a detached garage and a NEWER ROOF, appx 2 years old, this home offers great value and so much potential. T
Key facts
- Covered front porch
- New hot water heater
- Large kitchen
Tags
Property features AI
Exterior
- Parking: Detached garage (1 car)
- Security: Smoke detector(s)
- Utilities: Public water; Public sewer; Electric service
- Home design: Single-family residence (site-built); 2 stories; Corner, level lot
- Construction: Wood siding; Crawl space foundation; Built as site-built home
- Exterior features: Covered porch
Interior
- Kitchen: Gas range; Refrigerator
- Bedrooms: Total of 6 rooms (bedroom count not specified)
- Bathrooms: One full bathroom (main level)
- Heating & cooling: Natural gas heating; Baseboard heating; Forced air heating; Ceiling fan(s); Window unit(s) for cooling
- Interior features: Ceiling fan(s); One fireplace
- Laundry & utility: Washer hookup (main level); Electric dryer hookup; Washer and dryer included; Electric water heater
Neighborhood map
What this means for you Summary
Snapshot
- This is a 3-bed/1.0-bath single-family listed at $70k.
Deal economics
- At list price, monthly cash flow is $474 ($6k/yr) — positive.
- The deal already cash-flows at list — no discount required.
- Meets the 1% rule at list price ($1k rent vs $70k).
Location & tenants
- Location reads 68/100 on livability (#215 in IN) — a middle-class / working-renter tenant base. Strengths: crime A+, cost of living A+, housing A+; Watch: health & safety D, amenities F, commute F.
- Madison-Grant United School Corporation (rural): math 32% / reading 40% proficiency, ranked #180 of 301 in IN (top 60%) — families likely to look elsewhere, expect single-tenant / working-renter base with shorter leases.
- Zoned schools: Park Elementary School (math 35% / reading 31%, grade F, #639 of 994 statewide, top 65%, 332 students, 64% FRL); Madison-Grant Jr./Sr. High School (math 29% / reading 50%, grade F, #221 of 369 statewide, top 63%, 491 students, 47% FRL) — zoned schools average 55% FRL vs 37% district-wide (18 pts higher); higher-poverty schools than district average — tighter screening recommended.
- Market conditions: 10 active listings in the ZIP; 52 units permitted in Grant County in 2024 (8 in 5+ unit buildings).
Forward outlook
- Local home prices are declining (-3.0%/yr); year-one equity from $483 of loan paydown is wiped out by about $2k of value loss. Plan a longer hold.
- Grant County population projected at -18% by 2050 — secular population decline; favor cash flow + early exit over multi-decade hold.
- At projected returns (-3.0% appreciation + 3.0% rent growth), your $20k cash investment doubles in ~5 years — after that, you're playing with house money.
Negotiation context
- Only 7 days on market — expect competitive offers; lowballing is unlikely to land.
- 4 sale attempts since 7y ago with the ask held roughly flat each time — persistent listings suggest the price (not the market) is what's stuck; bring a comps-based counter.
- Current owner paid $55k; 27% above their basis — modest negotiation headroom, anchor on the comps not their cost.
Risks & watch-outs
- Watch-outs: built in 1912 — expect roof / HVAC / electrical / plumbing capex.
Questions for the listing agent
- Built in 1912 — when were the roof, HVAC, electrical panel, plumbing, and water heater last replaced?
- Is there a deadline driving the sale (1031 exchange, divorce, estate, relocation)? That informs how much negotiation room exists.
- Schools are D-rated, which usually means shorter tenancies and higher turnover. Who's the typical renter profile here, and what's been the actual vacancy rate?
- What's the average days-on-market for RENTAL listings here right now (not sales)? A rising rental-DOM trend means longer vacancies and softer asking-rent achievability than the comps imply.
- What's the recent tenant-quality profile in this submarket — average credit score on applications, eviction rate, late-payment / NSF rate, and stable-employment percentage? A property-management company in the area should have these aggregated.
- How much new for-sale + rental construction is in the pipeline within 1–3 miles? Heavy new supply typically softens prices + rents 12–24 months out; constrained supply supports both.
Investment metrics
- 1% rule
- 1.62% ✓
- Cap rate
- 14.43%
- Cash-on-cash
- 29.06%
- DSCR
- 2.29
- GRM
- 5.2
CMA / ARV
- ARV (on-the-fly)
- $174,496
- Comps found
- 5
Show comp detail 5 sales within ~0.75 mi
| Address | Dist | Beds/Ba | Sqft | Sold | Price | $/sf | Match |
|---|---|---|---|---|---|---|---|
| 209 W Second St | 0.32mi | 2/1.0 (-1) | 1,216 (-7%) | 20mo | $162,000 | $133 | 52 |
| 323 E First St | 0.13mi | 4/1.0 (+1) | 1,496 (+14%) | 19mo | $74,900 | $50 | 50 |
| 729 Henley Ave | 0.44mi | 4/1.0 (+1) | 1,455 (+11%) | 15mo | $127,000 | $87 | 44 |
| 549 Circle Dr | 0.54mi | 3/2.0 | 1,152 (-12%) | 24mo | $190,000 | $165 | 31 |
| 305 S Hilltop Ave | 0.61mi | 2/2.0 (-1) | 1,500 (+14%) | 21mo | $215,000 | $143 | 21 |
Match score weights: distance 35% · size 25% · config 20% · recency 20%. Top-matched comps best support the ARV.
Projected returns pro-forma
-3.0% appreciation · 3.0% rent growth · sell at horizon
- IRR
- 23.4%
- Equity multiple
- 1.96×
- Total profit
- $18,843
- Equity at exit
- $10,422
- IRR
- 31.3%
- Equity multiple
- 3.82×
- Total profit
- $55,194
- Equity at exit
- $6,044
Cash invested: $19,572 (down + closing). Projections, not guarantees.
Landlord ↔ Tenant lean methodology
- Overall (STATE)
- 90 Strongly Landlord-Friendly
- State Indiana
- 90 Strongly Landlord-Friendly · R+11
- County
- — inherits STATE
- City
- — inherits STATE
ZIP-level market 46928
- Home prices YoY
- -21.1%
- Active inventory
- 10
- Price-to-rent
- 5.2×
Monthly cashflow live
- Estimated rent
- $1,130 medium interval (Pro) →
- Mortgage (P&I)
- −$367
- Tax from tax record
- −$23 /mo · $278/yr
- Insurance
- −$29
- HOA
- −$0
- Vacancy / Maint / Mgmt
- −$237
- Net cashflow
- $474
Break-even live
UW: 25.0% down · 7.5% · 30yr · 1.5% tax · 5.0% vac · 8.0% maint · 8.0% mgmt
Financing live
Cash to close
- Down payment
- $17,475
- Closing costs
- $2,097
- Reserves months
- —
- Total cash needed
- —
Loan-product check · same deal, 3 products live
Conventional
25% down · 7.5% · 30yr
- Down + closing
- —
- Monthly P&I
- —
- Monthly cashflow
- —
- DSCR
- —
- Eligible?
- —
Personal DTI + credit; lowest rate.
DSCR
20% down · 8.5% · 30yr
- Down + closing
- —
- Monthly P&I
- —
- Monthly cashflow
- —
- DSCR
- —
- Eligible?
- —
No personal income docs; deal must DSCR.
Hard money
10% down · 12.0% · 12mo
- Down + closing
- —
- Monthly P&I
- —
- Monthly cashflow
- —
- DSCR
- —
- Eligible?
- —
Short-term bridge; refi at stabilization.
Listing history 16 events
-
2026-06-07statusdays on market $69,900 Pending 7 DOM
-
2026-06-02days on market $69,900 Active 4 DOM
-
2026-06-01days on market $69,900 Active 3 DOM
-
2026-05-31days on market $69,900 Active 2 DOM
-
2026-05-29$69,900 Active
-
2023-03-24historical
-
2023-03-15price $79,900
-
2023-03-15price $79,900
-
2023-03-09price $84,900
-
2023-03-09price $84,900
-
2023-02-21price $89,900
-
2023-02-21price $89,900
-
2023-02-17$99,900 Active
-
2023-02-17$99,900 Active
-
2020-04-01soldstatus $55,000
-
2019-12-31$59,000
ⓘ Source: listings_history table (triggers on properties + properties_extension) + one-shot
backfill from property_details.listing_events for pre-trigger history.
Tax reassessment forecast IN · Partial reset (capped growth)
- Current annual tax
- $278 · $23/mo
- Projected year-2 tax
- $436 · $36/mo
- Expected delta
- +$158/yr (+$13/mo · 56.9%)
ⓘ Screening estimate from a state-policy table — verify with the county assessor before closing.
Climate risk First Street
- Flood 1/10 Low FEMA zone X (unshaded) · 0% chance over 30 yrs
- Wildfire 1/10 Low
- Heat 3/10 Moderate 7 d/yr ≥100°F today · 18 d/yr by 30 yrs out
- Wind 2/10 Low
- Air quality 2/10 Low 1 unhealthy d/yr today · 2 by 30 yrs out
Nearby sold comps map
Loading sold comps map…
Walkable amenities ~0.75 mi
Loading nearby amenities…
Taxation est. · year 1
- Rental income
- $13,563
- − Mortgage interest
- −$3,915
- − Property taxes
- −$278
- − Insurance
- −$350
- − Repairs & maintenance
- −$1,085
- − Management
- −$1,085
- − Depreciation
- −$2,033
- Taxable income
- $4,816
- Est. tax owed @ 24.0%
- −$1,156
- After-tax cash flow
- $4,533/yr
For passive investors: Depreciation is non-cash, so a rental often shows a tax loss while cash-flowing — sheltering income. Rental losses are passive: they offset passive income freely, and up to $25,000/yr can offset ordinary (W-2) income if you actively participate and your MAGI is under $100k (phasing out to $0 by $150k); unused losses carry forward. On sale, claimed depreciation is recaptured at up to 25%, and gains may owe capital-gains tax (a 1031 exchange can defer both). Figures are a year-1 estimate at your 24.0% rate — not tax advice; consult a CPA.
Schools (NCES district)
- District
- Madison-Grant United School Corporation
- NCES district ID
- 1806240
- Math proficiency
- 32% ▼ -8.00%
- Reading proficiency
- 40% ▼ -9.00%
- Median HH income
- $47,917
- Composite
- 30.95/100
- National rank
- #6107
- State rank
- #180 of 301 in IN
Livability — Fairmount
- Score
- 68/100
- State rank
- #215
- US rank
- #9401
Category grades
Schools grade is shown separately in the Schools card above.
Census & demographics
- Census place
- Fairmount, IN
- Population (ZIP)
- 4,450
Population outlook (Grant County) Hauer SSP2
- Today (2025)
- 64,394 people
- By 2030
- 62,145 · -3.5%
- By 2040
- 57,252 · -11.1%
- By 2050
- 52,968 · -17.7%
- By 2075
- 45,986 · -28.6%
- By 2100
- 39,400 · -38.8%
Race, ethnicity, and origin ACS 2023
- Neighborhood character
- Predominantly White (93%)
- Race & ethnicity
- White 93% Two or more races 4% Hispanic / Latino 3% Native American 2%
- Common ancestry
- Lithuanian 5% Iranian 2% Polish 2%
- Foreign-born
- 1% · Canada
- Languages at home
- 98% English-only · Spanish 2%
Political lean MEDSL · Grant
- 2024 margin
- Solid R (+41.8) · D 28.2% · R 70.0% · Other 1.9%
- 2008→2024 swing
- -28.7pp toward R · 2008: -13.1pp · 2024: -41.8pp
- All cycles
- 2024: R+41.8 2020: R+38.8 2016: R+39.5 2012: R+22.0 2008: R+13.1
Not yet ingested
- Civics
- —
Market trends
- HPI YoY
- ▼ -53.31%
- Current HPI
- 199.8017
- Rent YoY
- —
- Metro
- —
- State GDP YoY
- ▲ 2.90%
- F500 in state
- 18
Industry mix (Fortune 500 HQ in IN)
| Industry | F500 HQs | Revenue |
|---|---|---|
| Industrial Machinery | 2 | $37B |
|
||
| Healthcare | 1 | $177B |
|
||
| Pharmaceuticals | 1 | $45B |
|
||
| Metals / Steel | 1 | $18B |
|
||
| Agriculture | 1 | $17B |
|
||
| Packaging | 1 | $12B |
|
||
Price history
+18.5% since first listed12 events — show timeline
- 2026-05-29 Listed $69,900 IRMLS
- 2023-03-24 Listing Removed — MIBOR as Distributed by MLS Grid
- 2023-03-15 Price Changed $79,900 IRMLS
- 2023-03-15 Price Changed $79,900 MIBOR as Distributed by MLS Grid
- 2023-03-09 Price Changed $84,900 MIBOR as Distributed by MLS Grid
- 2023-03-09 Price Changed $84,900 IRMLS
- 2023-02-21 Price Changed $89,900 MIBOR as Distributed by MLS Grid
- 2023-02-21 Price Changed $89,900 IRMLS
- 2023-02-17 Listed $99,900 IRMLS
- 2023-02-17 Listed $99,900 MIBOR as Distributed by MLS Grid
- 2020-04-01 Sold (MLS) $55,000 IRMLS
- 2019-12-31 Listed $59,000 IRMLS
Property tax history
-9.0%/yrLatest (2025): $278 · -14.1% YoY. Source: county tax records.
Cash-flow waterfall
monthlySold comps — $/sqft
last 12 mo · ≤1 miLoading sold comps…