 🏗️ New Construction
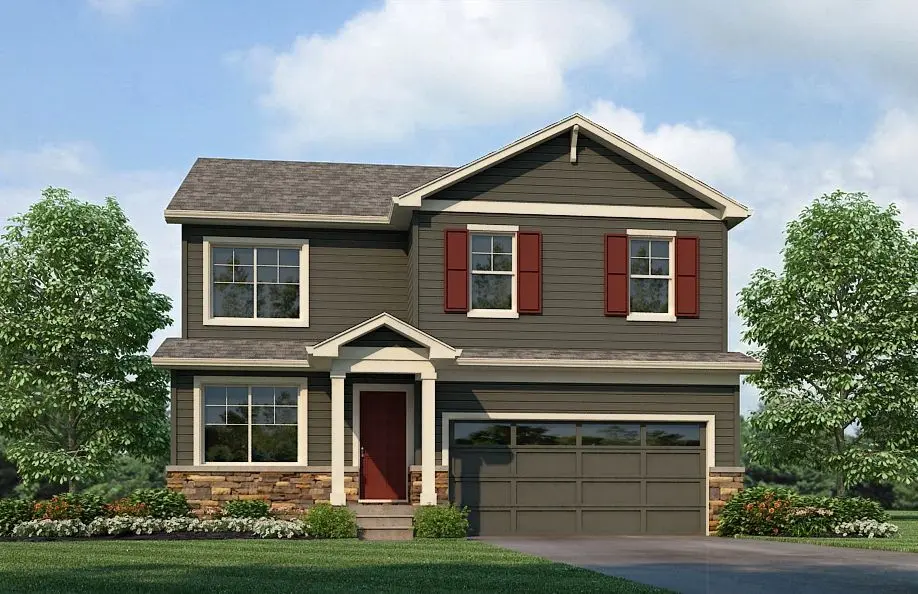
Bellamy Plan · Berthoud, CO
Flood risk No data
- FEMA flood zone
- —
- Chance of flooding over 30 yrs
- —
- Est. flood insurance / yr
- —
Fire risk No data
- Est. fire insurance / yr
- —
Heat risk No data
- Hot days now (above threshold)
- —
- Hot days in 30 yrs
- —
Wind risk No data
- Chance of severe wind over 30 yrs
- —
Air-quality risk No data
- Unhealthy air days now
- —
- Unhealthy air days in 30 yrs
- —
Risk factors via First Street. Map © Google.
Why this score? — see what drove the B grade
The composite is a weighted blend of 9 inputs, each scored 0–100. Each bar is that input's sub-score; the figure is the points it added to the 100-point composite (weight × sub-score).
- Cash flow +30.0/30.0
- 1% rule +10.0/10.0
- DSCR +10.0/10.0
- ARV discount +7.5/15.0
- Condition / age +4.8/5.0
- Livability +3.5/5.0
- Schools +3.4/10.0
- Rent growth +2.5/5.0
- Appreciation +0.0/10.0
$512,990
🖨 Deal sheet 📄 Offer letter ✓ Due diligence
Listing remarks
The Bellamy is a Gorgeous 2-story home offering 4 bedrooms, 2.5 bathrooms, and 2,125 sq. ft. of living space. Upgraded Finishes & Features: Stainless steel appliances, including gas range, microwave, and dishwasher Granite countertops with under-mount stainless steel dual-basin sink Smart home technology package (smart speaker, video doorbell, programmable thermostat, and touchscreen) The Bellamy is a spacious floor plan that is affordable and provides functionality! Expansive 9'main level ceilings Chrome faucets in kitchen and baths Tankless water heater Garage door opener Low-maintenance vinyl flooring in baths and laundry Builder warranty and much more! Love the community
Key facts
- Granite countertops
- 2 garage spots
- Listed 16 days
Tags
Property features AI
Finance
- Financial info: Listing price $512,990
Exterior
- Parking: 2 garage spaces (2 total parking spaces)
- Home design: Single-family plan home (Bellamy)
- Exterior features: Living area of 2,125
Interior
- Bedrooms: 4 bedrooms
- Bathrooms: 2 full bathrooms and 1 half bathroom (2.5 total)
- Interior features: Active plan home (Bellamy)
Neighborhood map
What this means for you Summary
Snapshot
- This is a 4-bed/2.5-bath multifamily listed at $513k. Condition is rated excellent.
Deal economics
- At list price, monthly cash flow is $3k ($35k/yr) — positive.
- The deal already cash-flows at list — no discount required.
- Meets the 1% rule at list price ($8k rent vs $513k).
- Recommended offer: $505k (1.5% below list) — sets the bar for market timing.
- Cap rate 13.1% vs local median 3.2% in Berthoud — top-decile yield for the area; either an underpriced asset or a hidden risk that comps aren't pricing in. Stress-test before assuming the spread holds.
Location & tenants
- Location reads 69/100 on livability (#100 in CO) — a middle-class / working-renter tenant base. Strengths: employment A+, housing A+, schools A-; Watch: amenities F, cost of living F, health & safety F.
- Thompson School District R-2J (suburban): math 28% / reading 48% proficiency, ranked #28 of 86 in CO (top 33%) — families likely to look elsewhere, expect single-tenant / working-renter base with shorter leases.
- Market conditions: 357 active listings in the ZIP; 6 comparable units currently listed for rent nearby; rentals at typical pace (median 24d on market — plan ~3-4 weeks tenant-placement turnaround); high-income renter base; 1,786 units permitted in Larimer County in 2024 (402 in 5+ unit buildings).
- At $8,151/mo this rent would consume 77% of the median local household income ($127k/yr) (locally 55% of renters already pay >50% of income on rent) — very limited rent-growth headroom before tenants either downsize or default.
Forward outlook
- Local home prices are declining (-3.0%/yr); year-one equity from $4k of loan paydown is wiped out by about $15k of value loss. Plan a longer hold.
- Larimer County population projected at +51% by 2050 — long-run rental-demand tailwind backs the buy-and-hold thesis.
- At projected returns (-3.0% appreciation + 3.0% rent growth), your $144k cash investment doubles in ~6 years — after that, you're playing with house money.
Negotiation context
- It's been on market 16 days — a 2% lower offer ($505k) is reasonable based on typical stale-listing flexibility.
Questions for the listing agent
- Is there a deadline driving the sale (1031 exchange, divorce, estate, relocation)? That informs how much negotiation room exists.
- Schools are A-rated — typically a magnet for longer-tenancy family renters. What's the average tenant stay here, and is there a school-zone premium baked into asking?
- What's the average days-on-market for RENTAL listings here right now (not sales)? A rising rental-DOM trend means longer vacancies and softer asking-rent achievability than the comps imply.
- What's the recent tenant-quality profile in this submarket — average credit score on applications, eviction rate, late-payment / NSF rate, and stable-employment percentage? A property-management company in the area should have these aggregated.
- How much new apartment / multifamily construction is in the pipeline within 1–3 miles? Heavy new supply (>2% of stock underway) typically softens rents 12–24 months out; light construction supports rent growth.
Investment metrics
- 1% rule
- 1.59% ✓
- Cap rate
- 13.06%
- Cash-on-cash
- 24.18%
- DSCR
- 2.08
- GRM
- 5.2
CMA / ARV
No comps found within radius.
Projected returns pro-forma
-3.0% appreciation · 3.0% rent growth · sell at horizon
- IRR
- 17.5%
- Equity multiple
- 1.71×
- Total profit
- $101,325
- Equity at exit
- $76,488
- IRR
- 25.9%
- Equity multiple
- 3.27×
- Total profit
- $326,085
- Equity at exit
- $44,354
Cash invested: $143,637 (down + closing). Projections, not guarantees.
Landlord ↔ Tenant lean methodology
- Overall (STATE)
- 38 Tenant-Leaning
- State Colorado
- 38 Tenant-Leaning · D+4
- County
- — inherits STATE
- City
- — inherits STATE
ZIP-level market 80513
- Active inventory
- 357
- Price-to-rent
- 21.0×
Monthly cashflow live
- Estimated rent
- $8,151 medium interval (Pro) →
- Mortgage (P&I)
- −$2,690
- Tax est. 1.5%
- −$641 /mo · $7,695/yr
- Insurance
- −$214
- HOA
- −$0
- Vacancy / Maint / Mgmt
- −$1,712
- Net cashflow
- $2,894
Break-even live
4-unit breakdown (identical units grouped — click to expand)
| Units | Beds | Baths | Est. rent |
|---|---|---|---|
| 4× units | 2 | 1 | $8,152 |
| #1 | 2 | 1 | $2,038 |
| #2 | 2 | 1 | $2,038 |
| #3 | 2 | 1 | $2,038 |
| #4 | 2 | 1 | $2,038 |
| Total (4 units) | $8,151 | ||
UW: 25.0% down · 7.5% · 30yr · 1.5% tax · 5.0% vac · 8.0% maint · 8.0% mgmt
Financing live
Cash to close
- Down payment
- $128,248
- Closing costs
- $15,390
- Reserves months
- —
- Total cash needed
- —
Loan-product check · same deal, 3 products live
Conventional
25% down · 7.5% · 30yr
- Down + closing
- —
- Monthly P&I
- —
- Monthly cashflow
- —
- DSCR
- —
- Eligible?
- —
Personal DTI + credit; lowest rate.
DSCR
20% down · 8.5% · 30yr
- Down + closing
- —
- Monthly P&I
- —
- Monthly cashflow
- —
- DSCR
- —
- Eligible?
- —
No personal income docs; deal must DSCR.
Hard money
10% down · 12.0% · 12mo
- Down + closing
- —
- Monthly P&I
- —
- Monthly cashflow
- —
- DSCR
- —
- Eligible?
- —
Short-term bridge; refi at stabilization.
Rent comps 6 comps
| Address | Beds | Baths | Sqft | Rent | $/sqft | DOM | Units | Dist |
|---|---|---|---|---|---|---|---|---|
| 716 N 4th St Berthoud, CO | 4.0 | 4.0 | 3000 | $4,200 | $1.40 | 23d | 1 | 0.85mi |
| 1512 Chokeberry St Berthoud, CO | 4.0 | 3.5 | 2648 | $3,169 | $1.20 | 13d | 1 | 0.86mi |
| 1232 Chilcott St Berthoud, CO | 4.0 | 2.5 | 2258 | $3,100 | $1.37 | 23d | 1 | 1.05mi |
| 1088 Blue Bell Rd Berthoud, CO | 3.0 | 2.5 | 1949 | $2,800 | $1.44 | 23d | 1 | 1.48mi |
| 243 Beetle Ln Berthoud, CO | 3.0 | 3.0 | 2712 | $2,495 | $0.92 | 23d | 1 | 1.49mi |
| 243 Beetle Ln Berthoud, CO | 3.0 | 3.0 | 2712 | $2,495 | $0.92 | 13d | 1 | 1.49mi |
Listing history 12 events
-
2026-06-18days on market $512,990 Active 16 DOM
-
2026-06-17days on market $512,990 Active 15 DOM
-
2026-06-16days on market $512,990 Active 14 DOM
-
2026-06-15days on market $512,990 Active 13 DOM
-
2026-06-14days on market $512,990 Active 11 DOM
-
2026-06-13days on market $512,990 Active 10 DOM
-
2026-06-10days on market $512,990 Active 8 DOM
-
2026-06-09days on market $512,990 Active 7 DOM
-
2026-06-08days on market $512,990 Active 6 DOM
-
2026-06-07days on market $512,990 Active 5 DOM
-
2026-06-03remarks 695-char remark
-
2026-06-03$512,990 Active 1 DOM
ⓘ Source: listings_history table (triggers on properties + properties_extension) + one-shot
backfill from property_details.listing_events for pre-trigger history.
Nearby sold comps map
Loading sold comps map…
Walkable amenities ~0.75 mi
Loading nearby amenities…
Taxation est. · year 1
- Rental income
- $97,812
- − Mortgage interest
- −$28,735
- − Property taxes
- −$7,695
- − Insurance
- −$2,565
- − Repairs & maintenance
- −$7,825
- − Management
- −$7,825
- − Depreciation
- −$14,923
- Taxable income
- $28,244
- Est. tax owed @ 24.0%
- −$6,778
- After-tax cash flow
- $27,951/yr
For passive investors: Depreciation is non-cash, so a rental often shows a tax loss while cash-flowing — sheltering income. Rental losses are passive: they offset passive income freely, and up to $25,000/yr can offset ordinary (W-2) income if you actively participate and your MAGI is under $100k (phasing out to $0 by $150k); unused losses carry forward. On sale, claimed depreciation is recaptured at up to 25%, and gains may owe capital-gains tax (a 1031 exchange can defer both). Figures are a year-1 estimate at your 24.0% rate — not tax advice; consult a CPA.
Condition & rehab AI · 13 photos
This Bellamy Plan home is in excellent condition with no visible repairs needed. It offers a spacious floor plan and is move-in ready for both resale and rental.
Value-add opportunities
- Both Paint exterior — Enhances curb appeal and resale value
- Both Replace carpet with hardwood — Improves aesthetics and is easier to maintain
- Both Install smart home technology — Enhances convenience and adds value
Renovation cost estimate screening
Value-add ROI direction
- Both Paint exterior — Enhances curb appeal and resale value ↑
- Both Replace carpet with hardwood — Improves aesthetics and is easier to maintain ↑
- Both Install smart home technology — Enhances convenience and adds value ↑
ⓘ Cost ranges are severity-bucket heuristics (US national rule-of-thumb). Get contractor quotes + a written scope before underwriting a rehab budget.
Schools (NCES district)
- District
- Thompson School District R-2J
- NCES district ID
- 0805400
- Math proficiency
- 28% ▼ -7.00%
- Reading proficiency
- 48% ▬ 0.00%
- Median HH income
- $63,040
- Composite
- 34.01/100
- National rank
- #5313
- State rank
- #28 of 86 in CO
Livability — Berthoud
- Score
- 69/100
- State rank
- #100
- US rank
- #8538
Category grades
Schools grade is shown separately in the Schools card above.
Census & demographics
- Census place
- Berthoud, CO
- County
- Larimer County · 338,255 people
- City population
- 18,271
- Metro
- Fort Collins, CO
- Population (ZIP)
- 18,271
- Household income
- $126,726
- Rent vs Own
- Severe rent burden
- 55.0
Population outlook (Larimer County) Hauer SSP2
- Today (2025)
- 415,361 people
- By 2030
- 457,762 · +10.2%
- By 2040
- 542,310 · +30.6%
- By 2050
- 627,048 · +51.0%
- By 2075
- 833,722 · +100.7%
- By 2100
- 952,590 · +129.3%
Race, ethnicity, and origin ACS 2023
- Neighborhood character
- Predominantly White (86%)
- Race & ethnicity
- White 86% Hispanic / Latino 10% Two or more races 6%
- Hispanic origin (detail)
- Mexican 6% Puerto Rican 1%
- Common ancestry
- Slovak 6% Romanian 4% Lithuanian 4%
- Foreign-born
- 4% · Canada, China, Vietnam
- Languages at home
- 95% English-only · Spanish 4% Other Indo-European 1%
Political lean MEDSL · Larimer
- 2024 margin
- D (+17.6) · D 57.4% · R 39.8% · Other 2.9%
- 2008→2024 swing
- +7.9pp toward D · 2008: 9.7pp · 2024: 17.6pp
- All cycles
- 2024: D+17.6 2020: D+15.4 2016: D+4.9 2012: D+5.2 2008: D+9.7
Not yet ingested
- Civics
- —
Market trends
- HPI YoY
- ▼ -411.30%
- Current HPI
- 260.0027
- Rent YoY
- —
- Metro
- Fort Collins, CO
- State GDP YoY
- ▲ 1.95%
- F500 in state
- 14
Industry mix (Fortune 500 HQ in CO)
| Industry | F500 HQs | Revenue |
|---|---|---|
| Technology Distribution | 1 | $31B |
|
||
| Food / Agriculture | 1 | $18B |
|
||
| Packaging | 1 | $14B |
|
||
| Healthcare | 1 | $13B |
|
||
| Energy | 1 | $10B |
|
||
| Technology | 1 | $4B |
|
||
Cash-flow waterfall
monthlySold comps — $/sqft
last 12 mo · ≤1 miLoading sold comps…