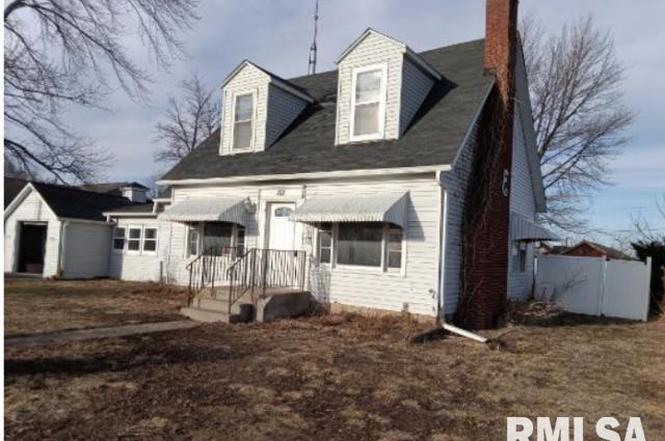
101 W Oak St · Broadwell, IL
Flood risk 1/10 · Minimal
- FEMA flood zone
- X (unshaded)
- Chance of flooding over 30 yrs
- 0.0%
- Est. flood insurance / yr
- $473 – $860
Fire risk 1/10 · Minimal
- Est. fire insurance / yr
- $804 – $1,492
Heat risk 4/10 · Minor
- Hot days now (above 106°F)
- 7 days/yr
- Hot days in 30 yrs
- 19 days/yr
Wind risk 2/10 · Minimal
- Chance of severe wind over 30 yrs
- 2.0%
Air-quality risk 2/10 · Minimal
- Unhealthy air days now
- 1 days/yr
- Unhealthy air days in 30 yrs
- 2 days/yr
Risk factors via First Street. Map © Google.
Why this score? — see what drove the D grade
The composite is a weighted blend of 9 inputs, each scored 0–100. Each bar is that input's sub-score; the figure is the points it added to the 100-point composite (weight × sub-score).
- Cash flow +14.1/30.0
- ARV discount +7.5/15.0
- 1% rule +4.3/10.0
- DSCR +4.3/10.0
- Appreciation +3.9/10.0
- Livability +3.0/5.0
- Rent growth +2.5/5.0
- Condition / age +2.5/5.0
- Schools +2.0/10.0
$100,000
🖨 Deal sheet 📄 Offer letter ✓ Due diligence
Listing remarks
Own your own piece of history! Charming 2 bedroom, Cape Cod style home in Broadwell. This home sits at the site of the old Pig Hip Restaurant just off of Historic Route 66 (marker on site). The home has had many recent improvements. Easy access to I-55 for quick commute to Springfield or Lincoln. Updates in 2016, include - Roof, some windows, water heater, carpet, laminate, most lighting, most doors, insulation, backsplash in kitchen, some drywall, freshly painted interior & 11x9 walk-in closet upstairs- There is a 17x9 sitting area adjacent to the upstairs bedroom - - Motivated seller!
Key facts
- New plumbing
- Fresh paint
- New carpeting
Tags
Property features AI
Finance
- Other: Property listed as Active
Exterior
- Parking: Attached parking garage with 1 garage space
- Utilities: Public water; Public sewer
- Home design: Single-family residence; Residential zoning; Approximately 1,500 total building area; Originally built around 1900
- Construction: Shingle roof; Not new construction
- Exterior features: Fenced yard; Replacement windows; Corner, level lot; Gravel road access; Lot dimensions approximately 100 x 137
Interior
- Kitchen: Kitchen on the main level
- Bedrooms: 2 bedrooms (one on the upper level, one on the main level); Bedrooms have egress windows
- Flooring: Laminate flooring throughout main and upper level rooms
- Bathrooms: 1 full bathroom
- Heating & cooling: Central air conditioning; Forced air heating; Electric heating components
- Interior features: Ceiling fans; Wood-burning fireplace in the living room (1 total)
- Laundry & utility: Gas water heater
Neighborhood map
What this means for you Summary
Snapshot
- This is a 2-bed/1.0-bath other listed at $100k.
Deal economics
- At list price, monthly cash flow is $15 ($175/yr) — positive.
- The deal already cash-flows at list — no discount required.
- To meet the 1% rule (rent ≥ 1% of price), the offer needs to be $93k (6.9% below list).
- Recommended offer: $91k (9.0% below list) — sets the bar for market timing.
Location & tenants
- Location reads 60/100 on livability (#956 in IL) — a middle-class / working-renter tenant base. Strengths: cost of living A+, housing A+; Watch: employment D+, crime D, schools F.
- Lincoln Chsd 404 (town): math 21% / reading 27% proficiency, ranked #367 of 620 in IL (top 59%) — low school quality limits family demand, transient renter base, plan for 1-2y turnover.
- Market conditions: 1 active listings in the ZIP; 10 units permitted in Logan County in 2024 (0 in 5+ unit buildings).
Forward outlook
- Local home prices are declining (-2.2%/yr); year-one equity from $691 of loan paydown is wiped out by about $2k of value loss. Plan a longer hold.
- Logan County population projected at -11% by 2050 — secular population decline; favor cash flow + early exit over multi-decade hold.
Negotiation context
- It's been on market 115 days — a 9% lower offer ($91k) is reasonable based on typical stale-listing flexibility.
Risks & watch-outs
- Watch-outs: built in 1900 — expect roof / HVAC / electrical / plumbing capex.
Questions for the listing agent
- It's been on market 115 days. Have you received any prior offers? Is the seller open to a 9% concession, seller financing, or rate buy-down credit?
- Built in 1900 — when were the roof, HVAC, electrical panel, plumbing, and water heater last replaced?
- Why hasn't it sold? Are there any deal-killer items the seller is aware of (foundation, flood, title, zoning, code violations)?
- Is there a deadline driving the sale (1031 exchange, divorce, estate, relocation)? That informs how much negotiation room exists.
- Schools are F-rated, which usually means shorter tenancies and higher turnover. Who's the typical renter profile here, and what's been the actual vacancy rate?
- Crime grade is D in this area — have there been break-ins, vandalism, or insurance claims at this property in the last 3 years? What carrier currently insures it and at what premium?
- The area grade is low — what's the realistic commute time and amenity access for the typical tenant pool here? Any planned neighborhood developments (good or bad) we should know about?
- What's the average days-on-market for RENTAL listings here right now (not sales)? A rising rental-DOM trend means longer vacancies and softer asking-rent achievability than the comps imply.
- What's the recent tenant-quality profile in this submarket — average credit score on applications, eviction rate, late-payment / NSF rate, and stable-employment percentage? A property-management company in the area should have these aggregated.
- How much new for-sale + rental construction is in the pipeline within 1–3 miles? Heavy new supply typically softens prices + rents 12–24 months out; constrained supply supports both.
Investment metrics
- 1% rule
- 0.93% ✗
- Cap rate
- 6.47%
- Cash-on-cash
- 0.63%
- DSCR
- 1.03
- GRM
- 8.9
CMA / ARV
No comps found within radius.
Projected returns pro-forma
-2.22% appreciation · 3.0% rent growth · sell at horizon
- IRR
- -11.0%
- Equity multiple
- 0.57×
- Total profit
- $-11,944
- Equity at exit
- $18,419
- IRR
- -2.9%
- Equity multiple
- 0.78×
- Total profit
- $-6,164
- Equity at exit
- $14,795
Cash invested: $28,000 (down + closing). Projections, not guarantees.
Landlord ↔ Tenant lean methodology
- Overall (STATE)
- 43 Moderately Tenant-Leaning
- State Illinois
- 43 Moderately Tenant-Leaning · D+7
- County
- — inherits STATE
- City
- — inherits STATE
ZIP-level market 62634
- Home prices YoY
- -1.5%
- Active inventory
- 1
- Price-to-rent
- 8.9×
Monthly cashflow live
- Estimated rent
- $931 medium interval (Pro) →
- Mortgage (P&I)
- −$524
- Tax from tax record
- −$155 /mo · $1,859/yr
- Insurance
- −$42
- HOA
- −$0
- Vacancy / Maint / Mgmt
- −$196
- Net cashflow
- $15
Break-even live
UW: 25.0% down · 7.5% · 30yr · 1.5% tax · 5.0% vac · 8.0% maint · 8.0% mgmt
Financing live
Cash to close
- Down payment
- $25,000
- Closing costs
- $3,000
- Reserves months
- —
- Total cash needed
- —
Loan-product check · same deal, 3 products live
Conventional
25% down · 7.5% · 30yr
- Down + closing
- —
- Monthly P&I
- —
- Monthly cashflow
- —
- DSCR
- —
- Eligible?
- —
Personal DTI + credit; lowest rate.
DSCR
20% down · 8.5% · 30yr
- Down + closing
- —
- Monthly P&I
- —
- Monthly cashflow
- —
- DSCR
- —
- Eligible?
- —
No personal income docs; deal must DSCR.
Hard money
10% down · 12.0% · 12mo
- Down + closing
- —
- Monthly P&I
- —
- Monthly cashflow
- —
- DSCR
- —
- Eligible?
- —
Short-term bridge; refi at stabilization.
Listing history 21 events
-
2026-06-18days on market $100,000 Active 115 DOM
-
2026-06-17days on market $100,000 Active 114 DOM
-
2026-06-16days on market $100,000 Active 113 DOM
-
2026-06-15days on market $100,000 Active 112 DOM
-
2026-06-14price $100,000 Active 110 DOM
-
2026-06-13days on market $110,000 Active 110 DOM
-
2026-06-12days on market $110,000 Active 109 DOM
-
2026-06-09days on market $110,000 Active 106 DOM
-
2026-06-08days on market $110,000 Active 105 DOM
-
2026-06-07days on market $110,000 Active 104 DOM
-
2026-06-04days on market $110,000 Active 100 DOM
-
2026-06-02days on market $110,000 Active 99 DOM
-
2026-06-01days on market $110,000 Active 98 DOM
-
2026-05-31days on market $110,000 Active 97 DOM
-
2026-05-31days on market $110,000 Active 96 DOM
-
2026-05-17price $110,000
-
2026-04-29price $119,900
-
2026-02-23$124,900 Active
-
2023-10-17historical
-
2021-08-06historical
-
2017-07-18soldstatus $159,000
ⓘ Source: listings_history table (triggers on properties + properties_extension) + one-shot
backfill from property_details.listing_events for pre-trigger history.
Tax reassessment forecast IL · Partial reset (capped growth)
- Current annual tax
- $1,859 · $155/mo
- Projected year-2 tax
- $2,065 · $172/mo
- Expected delta
- +$205/yr (+$17/mo · 11.0%)
ⓘ Screening estimate from a state-policy table — verify with the county assessor before closing.
Climate risk First Street
- Flood 1/10 Low FEMA zone X (unshaded) · 0% chance over 30 yrs
- Wildfire 1/10 Low
- Heat 4/10 Moderate 7 d/yr ≥106°F today · 19 d/yr by 30 yrs out
- Wind 2/10 Low 2% chance of damaging wind over 30 yrs
- Air quality 2/10 Low 1 unhealthy d/yr today · 2 by 30 yrs out
Nearby sold comps map
Loading sold comps map…
Walkable amenities ~0.75 mi
Loading nearby amenities…
Taxation est. · year 1
- Rental income
- $11,174
- − Mortgage interest
- −$5,602
- − Property taxes
- −$1,859
- − Insurance
- −$500
- − Repairs & maintenance
- −$894
- − Management
- −$894
- − Depreciation
- −$2,909
- Taxable loss
- −$1,484
- Est. tax savings @ 24.0%
- +$356
- After-tax cash flow
- $531/yr
For passive investors: Depreciation is non-cash, so a rental often shows a tax loss while cash-flowing — sheltering income. Rental losses are passive: they offset passive income freely, and up to $25,000/yr can offset ordinary (W-2) income if you actively participate and your MAGI is under $100k (phasing out to $0 by $150k); unused losses carry forward. On sale, claimed depreciation is recaptured at up to 25%, and gains may owe capital-gains tax (a 1031 exchange can defer both). Figures are a year-1 estimate at your 24.0% rate — not tax advice; consult a CPA.
Schools (NCES district)
- District
- Lincoln Chsd 404
- NCES district ID
- 1723050
- Math proficiency
- 21% ▼ -9.00%
- Reading proficiency
- 27% ▼ -8.00%
- Median HH income
- $41,489
- Composite
- 20.4/100
- National rank
- #8590
- State rank
- #367 of 620 in IL
Livability — Broadwell
- Score
- 60/100
- State rank
- #956
- US rank
- #18598
Category grades
Schools grade is shown separately in the Schools card above.
Census & demographics
- Census place
- Broadwell, IL
- Population (ZIP)
- 1,141
Population outlook (Logan County) Hauer SSP2
- Today (2025)
- 28,066 people
- By 2030
- 27,370 · -2.5%
- By 2040
- 26,078 · -7.1%
- By 2050
- 24,908 · -11.3%
- By 2075
- 22,504 · -19.8%
- By 2100
- 19,226 · -31.5%
Race, ethnicity, and origin ACS 2023
- Neighborhood character
- Predominantly White (96%)
- Race & ethnicity
- White 96% Two or more races 3% Hispanic / Latino 2%
- Common ancestry
- Lithuanian 4% Serbian 3% Portuguese 2%
- Languages at home
- 99% English-only · Spanish 1%
Political lean MEDSL · Logan
- 2024 margin
- Solid R (+41.5) · D 28.2% · R 69.8% · Other 2.0%
- 2008→2024 swing
- -24.6pp toward R · 2008: -16.9pp · 2024: -41.5pp
- All cycles
- 2024: R+41.5 2020: R+39.8 2016: R+40.1 2012: R+32.1 2008: R+16.9
Not yet ingested
- Civics
- —
Market trends
- HPI YoY
- ▼ -2.22%
- Current HPI
- 145.33
- Rent YoY
- —
- Metro
- —
- State GDP YoY
- ▲ 1.59%
- F500 in state
- 60
Industry mix (Fortune 500 HQ in IL)
| Industry | F500 HQs | Revenue |
|---|---|---|
| Insurance | 4 | $201B |
|
||
| Consumer Goods | 4 | $87B |
|
||
| Industrial Machinery | 3 | $64B |
|
||
| Healthcare | 2 | $55B |
|
||
| Retail / Pharmacy | 1 | $148B |
|
||
| Agriculture / Food | 1 | $86B |
|
||
Price history
-30.8% since first listed6 events — show timeline
- 2026-05-17 Price Changed $110,000 RMLSA as Distributed by MLS Grid
- 2026-04-29 Price Changed $119,900 RMLSA as Distributed by MLS Grid
- 2026-02-23 Listed $124,900 RMLSA as Distributed by MLS Grid
- 2023-10-17 Listing Removed — RMLSA as Distributed by MLS Grid
- 2021-08-06 Listing Removed — RMLSA as Distributed by MLS Grid
- 2017-07-18 Sold (Public Records) $159,000 Public Records
Property tax history
+2.2%/yrLatest (2024): $1,859 · +6.5% YoY. Source: county tax records.
Cash-flow waterfall
monthlySold comps — $/sqft
last 12 mo · ≤1 miLoading sold comps…