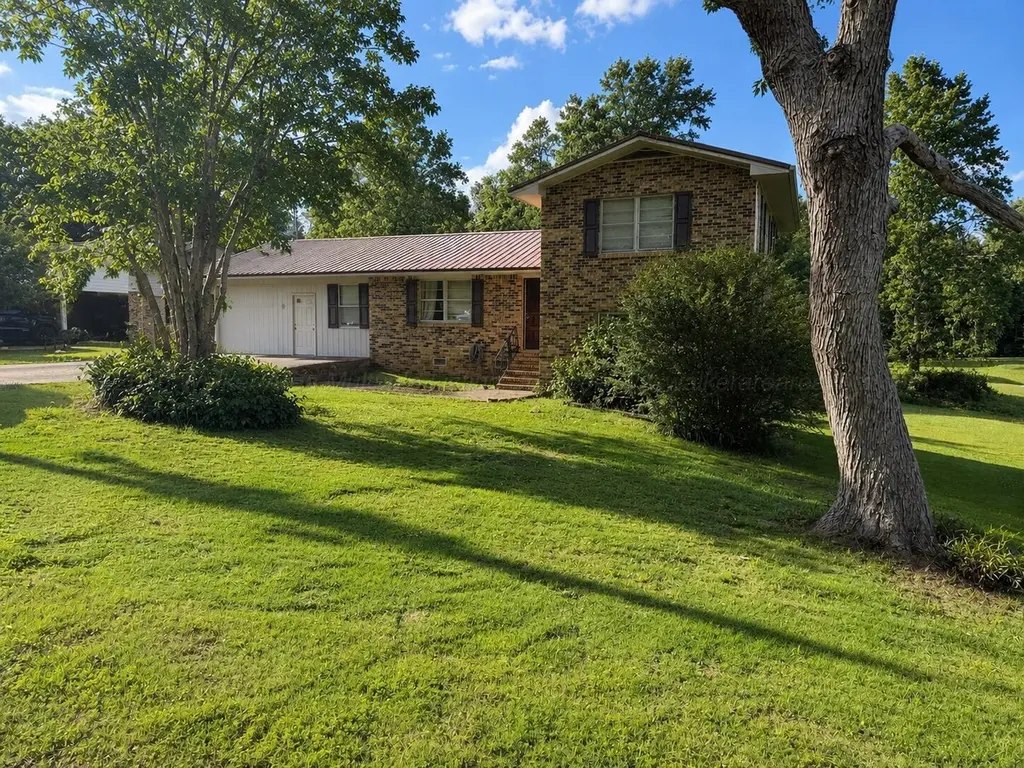
1406 34th St · Haleyville, AL
Flood risk 1/10 · Minimal
- FEMA flood zone
- X (unshaded)
- Chance of flooding over 30 yrs
- 0.0%
- Est. flood insurance / yr
- $507 – $1,088
Fire risk 4/10 · Minor
- Est. fire insurance / yr
- $916 – $1,700
Heat risk 5/10 · Moderate
- Hot days now (above 105°F)
- 7 days/yr
- Hot days in 30 yrs
- 19 days/yr
Wind risk 6/10 · Moderate
- Chance of severe wind over 30 yrs
- 27.0%
Air-quality risk 2/10 · Minimal
- Unhealthy air days now
- 1 days/yr
- Unhealthy air days in 30 yrs
- 1 days/yr
Risk factors via First Street. Map © Google.
Why this score? — see what drove the D grade
The composite is a weighted blend of 9 inputs, each scored 0–100. Each bar is that input's sub-score; the figure is the points it added to the 100-point composite (weight × sub-score).
- Cash flow +15.5/30.0
- Appreciation +7.3/10.0
- DSCR +4.8/10.0
- 1% rule +3.0/10.0
- Livability +3.0/5.0
- Schools +2.8/10.0
- ARV discount +2.6/15.0
- Rent growth +2.5/5.0
- Condition / age +2.5/5.0
$155,500
🖨 Deal sheet (PDF) 📄 Offer letter ✓ Due diligence
Listing remarks
Spacious split-level home featuring a large living area with fireplace, oversized kitchen with island seating, and enclosed carport area for additional flexible space. New metal roof installed July 2018 and new water heater in 2025. Situated on 2 lots each 0.4acres. Property sold AS-IS
Key facts
- New metal roof
- Large living area
- Oversized kitchen
Tags
Property features AI
Exterior
- Parking: Parking pad
- Utilities: Septic sewer
- Home design: Single-family residential property; Residential property type
- Construction: Brick construction
- Exterior features: Metal roof
Interior
- Kitchen: Dishwasher; Microwave; Refrigerator; Electric range
- Flooring: Vinyl flooring; Carpet flooring
- Heating & cooling: Central heating (electric); Central air conditioning (electric)
- Interior features: Wood-burning fireplace
Neighborhood map
What this means for you Summary
Snapshot
- This is a 4-bed/1.0-bath single-family listed at $156k.
Deal economics
- At list price, monthly cash flow is $62 ($744/yr) — positive.
- The deal already cash-flows at list — no discount required.
- To meet the 1% rule (rent ≥ 1% of price), the offer needs to be $124k (20.0% below list).
- Recommended offer: $124k (20.0% below list) — sets the bar for 1% rule.
- Cap rate 6.8% vs local median 4.6% in Haleyville — top-decile yield for the area; either an underpriced asset or a hidden risk that comps aren't pricing in. Stress-test before assuming the spread holds.
Location & tenants
- Location reads 60/100 on livability (#287 in AL) — a middle-class / working-renter tenant base. Strengths: cost of living A+, housing A+; Watch: crime F, amenities F, commute F.
- Haleyville City (rural): math 23% / reading 47% proficiency, ranked #50 of 129 in AL (top 39%) — families likely to look elsewhere, expect single-tenant / working-renter base with shorter leases.
- Zoned schools: Haleyville Elementary School (math 29% / reading 51%, grade F, #241 of 627 statewide, top 38%, 808 students, 70% FRL); Haleyville Middle School (math 17% / reading 46%, grade F, #114 of 257 statewide, top 45%, 357 students, 69% FRL); Haleyville High School (math 22% / reading 32%, grade F, #90 of 305 statewide, top 35%, 479 students, 64% FRL) — zoned schools average 68% FRL vs 51% district-wide (17 pts higher); higher-poverty schools than district average — tighter screening recommended.
- Market conditions: 78 active listings in the ZIP; 1 units permitted in Winston County in 2024 (0 in 5+ unit buildings).
Forward outlook
- In year one you build about $8k of equity ($1k loan paydown + $7k appreciation (4.6% local appreciation)).
- Winston County population projected at -20% by 2050 — secular population decline; favor cash flow + early exit over multi-decade hold.
- At projected returns (4.6% appreciation + 3.0% rent growth), your $44k cash investment doubles in ~5 years — after that, you're playing with house money.
- By year 5, paydown + projected appreciation supports a ~$36k cash-out refi (75% LTV) — recoverable capital for the next deal without selling this one.
Negotiation context
- It's been on market 45 days — a 3% lower offer ($151k) is reasonable based on typical stale-listing flexibility.
Risks & watch-outs
- Climate carrying-cost: major wind risk, 27% chance of damaging wind over 30y; extreme-heat days projected 7→19/yr by 2055 (HVAC capex compounding) — expect insurance premiums to compound above CPI over the hold.
Questions for the listing agent
- It's been on market 45 days. Have you received any prior offers? Is the seller open to a 20% concession, seller financing, or rate buy-down credit?
- Built in 1960 — when were the roof, HVAC, electrical panel, plumbing, and water heater last replaced?
- Is there a deadline driving the sale (1031 exchange, divorce, estate, relocation)? That informs how much negotiation room exists.
- Schools are D-rated, which usually means shorter tenancies and higher turnover. Who's the typical renter profile here, and what's been the actual vacancy rate?
- Crime grade is F in this area — have there been break-ins, vandalism, or insurance claims at this property in the last 3 years? What carrier currently insures it and at what premium?
- The area grade is low — what's the realistic commute time and amenity access for the typical tenant pool here? Any planned neighborhood developments (good or bad) we should know about?
- What's the average days-on-market for RENTAL listings here right now (not sales)? A rising rental-DOM trend means longer vacancies and softer asking-rent achievability than the comps imply.
- What's the recent tenant-quality profile in this submarket — average credit score on applications, eviction rate, late-payment / NSF rate, and stable-employment percentage? A property-management company in the area should have these aggregated.
- How much new for-sale + rental construction is in the pipeline within 1–3 miles? Heavy new supply typically softens prices + rents 12–24 months out; constrained supply supports both.
Investment metrics
- 1% rule
- 0.80% ✗
- Cap rate
- 6.77%
- Cash-on-cash
- 1.71%
- DSCR
- 1.08
- GRM
- 10.4
CMA / ARV
- ARV (median comp)
- $140,247
- List price
- $155,500
- Delta
- 10.88%
- Verdict
- OVERPRICED
- Comps
- 20 within 1.0 mi
Show comp detail 7 sales within ~0.75 mi
| Address | Dist | Beds/Ba | Sqft | Sold | Price | $/sf | Match |
|---|---|---|---|---|---|---|---|
| 902 35th St | 0.39mi | 3/2.0 (-1) | 1,732 (+4%) | 4mo | $201,000 | $116 | 62 |
| 3002 19th Ave | 0.53mi | 3/1.0 (-1) | 1,740 (+5%) | 18mo | $145,000 | $83 | 47 |
| 2922 11th Ave | 0.47mi | 3/2.0 (-1) | 1,488 (-10%) | 12mo | $35,000 | $24 | 42 |
| 3105 16th Ave | 0.27mi | 3/2.0 (-1) | 1,452 (-13%) | 22mo | $142,000 | $98 | 38 |
| 3018 20th Ave | 0.57mi | 3/2.0 (-1) | 1,549 (-7%) | 21mo | $195,000 | $126 | 36 |
| 2822 18th Ave | 0.54mi | 3/2.0 (-1) | 1,875 (+13%) | 17mo | $177,000 | $94 | 31 |
| 2822 Littleville Rd | 0.71mi | 3/2.0 (-1) | 1,879 (+13%) | 12mo | $212,000 | $113 | 26 |
Match score weights: distance 35% · size 25% · config 20% · recency 20%. Top-matched comps best support the ARV.
Projected returns pro-forma
4.62% appreciation · 3.0% rent growth · sell at horizon
- IRR
- 13.4%
- Equity multiple
- 1.84×
- Total profit
- $36,394
- Equity at exit
- $84,587
- IRR
- 14.4%
- Equity multiple
- 3.48×
- Total profit
- $108,128
- Equity at exit
- $143,145
Cash invested: $43,540 (down + closing). Projections, not guarantees.
Landlord ↔ Tenant lean methodology
- Overall (STATE)
- 90 Strongly Landlord-Friendly
- State Alabama
- 90 Strongly Landlord-Friendly · R+15
- County
- — inherits STATE
- City
- — inherits STATE
ZIP-level market 35565
- Home prices YoY
- 3.5%
- Active inventory
- 78
- Price-to-rent
- 10.4×
Monthly cashflow live
- Estimated rent
- $1,244 medium interval (Pro) →
- Mortgage (P&I)
- −$815
- Tax from tax record
- −$40 /mo · $484/yr
- Insurance
- −$65
- HOA
- −$0
- Vacancy / Maint / Mgmt
- −$261
- Net cashflow
- $62
Break-even live
Sensitivity live
| Price | -10% $150 | -5% $106 | +0% $62 | +5% $18 | +10% $-26 |
|---|---|---|---|---|---|
| Rent | -10% $-36 | -5% $13 | +0% $62 | +5% $111 | +10% $160 |
| Rate | -1.0pp $140 | -0.5pp $102 | base $62 | +0.5pp $22 | +1.0pp $-19 |
UW: 25.0% down · 7.5% · 30yr · 1.5% tax · 5.0% vac · 8.0% maint · 8.0% mgmt
Financing live
Cash to close
- Down payment
- $38,875
- Closing costs
- $4,665
- Reserves months
- —
- Total cash needed
- —
Loan-product check · same deal, 3 products live
Conventional
25% down · 7.5% · 30yr
- Down + closing
- —
- Monthly P&I
- —
- Monthly cashflow
- —
- DSCR
- —
- Eligible?
- —
Personal DTI + credit; lowest rate.
DSCR
20% down · 8.5% · 30yr
- Down + closing
- —
- Monthly P&I
- —
- Monthly cashflow
- —
- DSCR
- —
- Eligible?
- —
No personal income docs; deal must DSCR.
Hard money
10% down · 12.0% · 12mo
- Down + closing
- —
- Monthly P&I
- —
- Monthly cashflow
- —
- DSCR
- —
- Eligible?
- —
Short-term bridge; refi at stabilization.
Listing history 19 events
-
2026-06-22days on market $155,500 Active 45 DOM
-
2026-06-21days on market $155,500 Active 44 DOM
-
2026-06-19days on market $155,500 Active 42 DOM
-
2026-06-18days on market $155,500 Active 41 DOM
-
2026-06-17days on market $155,500 Active 40 DOM
-
2026-06-16days on market $155,500 Active 39 DOM
-
2026-06-15days on market $155,500 Active 38 DOM
-
2026-06-14days on market $155,500 Active 36 DOM
-
2026-06-12days on market $155,500 Active 35 DOM
-
2026-06-09days on market $155,500 Active 32 DOM
-
2026-06-08days on market $155,500 Active 31 DOM
-
2026-06-07days on market $155,500 Active 30 DOM
-
2026-06-07days on market $155,500 Active 29 DOM
-
2026-06-04days on market $155,500 Active 26 DOM
-
2026-06-02days on market $155,500 Active 25 DOM
-
2026-06-01days on market $155,500 Active 24 DOM
-
2026-05-31days on market $155,500 Active 23 DOM
-
2026-05-31days on market $155,500 Active 22 DOM
-
2026-05-08$165,900 Active 286-char remark
ⓘ Source: listings_history table (triggers on properties + properties_extension) + one-shot
backfill from property_details.listing_events for pre-trigger history.
Tax reassessment forecast AL · Resets to sale price
- Current annual tax
- $484 · $40/mo
- Projected year-2 tax
- $638 · $53/mo
- Expected delta
- +$153/yr (+$13/mo · 31.7%)
ⓘ Screening estimate from a state-policy table — verify with the county assessor before closing.
Climate risk First Street
- Flood 1/10 Low FEMA zone X (unshaded) · 0% chance over 30 yrs
- Wildfire 4/10 Moderate
- Heat 5/10 Major 7 d/yr ≥105°F today · 19 d/yr by 30 yrs out
- Wind 6/10 Major 27% chance of damaging wind over 30 yrs
- Air quality 2/10 Low 1 unhealthy d/yr today · 1 by 30 yrs out
Nearby sold comps map
Loading sold comps map…
Walkable amenities ~0.75 mi
Loading nearby amenities…
Taxation est. · year 1
- Rental income
- $14,926
- − Mortgage interest
- −$8,710
- − Property taxes
- −$484
- − Insurance
- −$778
- − Repairs & maintenance
- −$1,194
- − Management
- −$1,194
- − Depreciation
- −$4,524
- Taxable loss
- −$1,958
- Est. tax savings @ 24.0%
- +$470
- After-tax cash flow
- $1,214/yr
For passive investors: Depreciation is non-cash, so a rental often shows a tax loss while cash-flowing — sheltering income. Rental losses are passive: they offset passive income freely, and up to $25,000/yr can offset ordinary (W-2) income if you actively participate and your MAGI is under $100k (phasing out to $0 by $150k); unused losses carry forward. On sale, claimed depreciation is recaptured at up to 25%, and gains may owe capital-gains tax (a 1031 exchange can defer both). Figures are a year-1 estimate at your 24.0% rate — not tax advice; consult a CPA.
Schools (NCES district)
- District
- Haleyville City
- NCES district ID
- 0101720
- Math proficiency
- 23% ▼ -24.00%
- Reading proficiency
- 47% ▲ 10.00%
- Median HH income
- $29,581
- Composite
- 28.3/100
- National rank
- #6787
- State rank
- #50 of 129 in AL
Livability — Haleyville
- Score
- 60/100
- State rank
- #287
- US rank
- #18676
Category grades
Schools grade is shown separately in the Schools card above.
Census & demographics
- Census place
- Haleyville, AL
- Population (ZIP)
- 10,815
Population outlook (Winston County) Hauer SSP2
- Today (2025)
- 22,474 people
- By 2030
- 21,568 · -4.0%
- By 2040
- 19,710 · -12.3%
- By 2050
- 17,950 · -20.1%
- By 2075
- 14,468 · -35.6%
- By 2100
- 11,554 · -48.6%
Race, ethnicity, and origin ACS 2023
- Neighborhood character
- Predominantly White (88%)
- Race & ethnicity
- White 88% Hispanic / Latino 7% Two or more races 2% Black 2%
- Hispanic origin (detail)
- Mexican 3%
- Common ancestry
- Italian 1% Slovak 1% Iranian 1%
- Foreign-born
- 4% · Canada
- Languages at home
- 94% English-only · Spanish 5%
Political lean MEDSL · Winston
- 2024 margin
- Solid R (+83.6) · D 7.9% · R 91.6%
- 2008→2024 swing
- -20.4pp toward R · 2008: -63.3pp · 2024: -83.6pp
- All cycles
- 2024: R+83.6 2020: R+81.7 2016: R+81.5 2012: R+72.3 2008: R+63.3
Not yet ingested
- Civics
- —
Market trends
- HPI YoY
- ▲ 4.62%
- Current HPI
- 137.486
- Rent YoY
- —
- Metro
- —
- State GDP YoY
- ▲ 2.94%
- F500 in state
- 4
Industry mix (Fortune 500 HQ in AL)
| Industry | F500 HQs | Revenue |
|---|---|---|
| Financial Services | 1 | $8B |
|
||
| Healthcare | 1 | $5B |
|
||
Price history
-6.3% since first listed2 events — show timeline
- 2026-05-30 Price Changed $155,500 Walker County Area MLS
- 2026-05-08 Listed $165,900 Walker County Area MLS
Property tax history
+3.8%/yrLatest (2025): $484 · +4.8% YoY. Source: county tax records.
Cash-flow waterfall
monthlySold comps — $/sqft
last 12 mo · ≤1 miLoading sold comps…