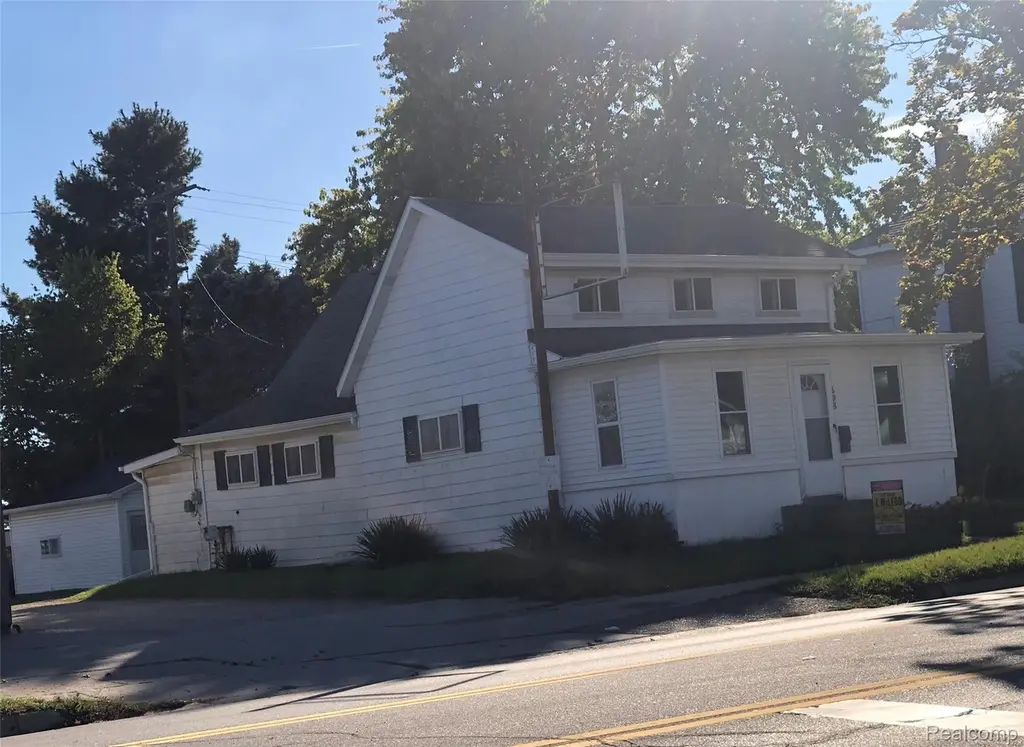
608 E Frank St · Caro, MI
Flood risk 1/10 · Minimal
- FEMA flood zone
- X (unshaded)
- Chance of flooding over 30 yrs
- 0.0%
- Est. flood insurance / yr
- $473 – $860
Fire risk 3/10 · Minor
- Est. fire insurance / yr
- $784 – $1,456
Heat risk 2/10 · Minimal
- Hot days now (above 98°F)
- 7 days/yr
- Hot days in 30 yrs
- 14 days/yr
Wind risk 1/10 · Minimal
- Chance of severe wind over 30 yrs
- —
Air-quality risk 2/10 · Minimal
- Unhealthy air days now
- 1 days/yr
- Unhealthy air days in 30 yrs
- 2 days/yr
Risk factors via First Street. Map © Google.
Why this score? — see what drove the D- grade
The composite is a weighted blend of 9 inputs, each scored 0–100. Each bar is that input's sub-score; the figure is the points it added to the 100-point composite (weight × sub-score).
- ARV discount +15.0/15.0
- Cash flow +7.7/30.0
- Livability +3.1/5.0
- Rent growth +2.5/5.0
- Condition / age +2.5/5.0
- Schools +2.4/10.0
- 1% rule +2.0/10.0
- DSCR +1.8/10.0
- Appreciation +0.0/10.0
$109,900
🖨 Deal sheet 📄 Offer letter ✓ Due diligence
Listing remarks MLS
Reduced for quick sale. This is a ready to move in home with a main floor bedroom plus 2 large bedrooms up. The front enclosed, insulated and heated front entry was used for a 4th bedroom a few years ago. The kitchen and dining are open and the laundry hookups are near the rear entrance. The kitchen, dining and bath have new flooring. The large living shows open stairs to the . upstairs bedrooms. The partial basement has room for the 10 year old furnace which is hooked to the central air, also room for the 3 year old water heater. The rear entry which is a covered porch overlooks a 22x44 slab/patio plus lawn between this home and the 24x24 garage. The garage is heated and has an electric door opener. The driveway is shared. The west side of the yard is fenced. The seller had previously added blown in insulation. Newer breaker box in small storage room next to the basement door.
Key facts
- Covered porch
- Heated garage
- Fenced yard
Tags
Property features AI
Exterior
- Parking: Detached heated garage with garage door opener (2 garage spaces); Parking pad; Shared driveway
- Security: Smoke detector(s)
- Utilities: Public water; Public sewer; Electric service with circuit breakers
- Home design: Single family residence; One and one‑half stories; Ground‑level entry with steps; Aluminum siding; New construction
- Construction: Asphalt roof
- Exterior features: Covered, enclosed porch and patio; Fenced yard; Paved road access
Interior
- Kitchen: Free‑standing electric range; Free‑standing refrigerator; Electric water heater
- Bedrooms: Total of 7 rooms (includes bedrooms and living spaces)
- Bathrooms: 1 full bathroom
- Heating & cooling: Forced air heating (natural gas); Central air conditioning
- Interior features: Unfurnished; Smoke detectors installed; Crawl space, partial unfinished basement
- Laundry & utility: Washer hookup; Electric dryer hookup
Neighborhood map
What this means for you Summary
Snapshot
- This is a 3-bed/1.5-bath single-family listed at $110k.
Deal economics
- At list price, monthly cash flow is $-128 ($-2k/yr) — negative.
- To cash-flow at today's rent, offer at most $87k (20.6% below list).
- To meet the 1% rule (rent ≥ 1% of price), the offer needs to be $77k (29.6% below list).
- Recommended offer: $77k (29.6% below list) — sets the bar for 1% rule.
Location & tenants
- Location reads 62/100 on livability (#546 in MI) — a middle-class / working-renter tenant base. Strengths: cost of living A+, housing B+; Watch: health & safety C-, crime F, amenities F.
- Caro Community Schools (town): math 22% / reading 36% proficiency, ranked #380 of 540 in MI (top 70%) — low school quality limits family demand, transient renter base, plan for 1-2y turnover.
- Market conditions: 46 active listings in the ZIP; 2 comparable units currently listed for rent nearby; 56 units permitted in Tuscola County in 2024 (0 in 5+ unit buildings).
Forward outlook
- Local home prices are declining (-3.0%/yr); year-one equity from $760 of loan paydown is wiped out by about $3k of value loss. Plan a longer hold.
- Tuscola County population projected at -29% by 2050 — secular population decline; favor cash flow + early exit over multi-decade hold.
Negotiation context
- It's been on market 39 days — a 3% lower offer ($107k) is reasonable based on typical stale-listing flexibility.
- 4 sale attempts with the ask held roughly flat each time — persistent listings suggest the price (not the market) is what's stuck; bring a comps-based counter.
- Current owner paid $23k; list at $110k implies a 387% gain — meaningful room to come down on a strong offer.
Questions for the listing agent
- What do current leases actually rent for vs. the listed asking? Can we see a recent rent roll and the last 12 months of T-12 income?
- It's been on market 39 days. Have you received any prior offers? Is the seller open to a 30% concession, seller financing, or rate buy-down credit?
- Built in 1960 — when were the roof, HVAC, electrical panel, plumbing, and water heater last replaced?
- Is there a deadline driving the sale (1031 exchange, divorce, estate, relocation)? That informs how much negotiation room exists.
- Crime grade is F in this area — have there been break-ins, vandalism, or insurance claims at this property in the last 3 years? What carrier currently insures it and at what premium?
- The area grade is low — what's the realistic commute time and amenity access for the typical tenant pool here? Any planned neighborhood developments (good or bad) we should know about?
- What's the average days-on-market for RENTAL listings here right now (not sales)? A rising rental-DOM trend means longer vacancies and softer asking-rent achievability than the comps imply.
- What's the recent tenant-quality profile in this submarket — average credit score on applications, eviction rate, late-payment / NSF rate, and stable-employment percentage? A property-management company in the area should have these aggregated.
- How much new for-sale + rental construction is in the pipeline within 1–3 miles? Heavy new supply typically softens prices + rents 12–24 months out; constrained supply supports both.
Investment metrics
- 1% rule
- 0.70% ✗
- Cap rate
- 4.90%
- Cash-on-cash
- -4.99%
- DSCR
- 0.78
- GRM
- 11.8
CMA / ARV
- ARV (median comp)
- $137,069
- List price
- $109,900
- Delta
- -19.82%
- Verdict
- UNDERPRICED
- Comps
- 20 within 1.0 mi
Show comp detail 5 sales within ~0.75 mi
| Address | Dist | Beds/Ba | Sqft | Sold | Price | $/sf | Match |
|---|---|---|---|---|---|---|---|
| 621 Meek St | 0.14mi | 2/1.0 (-1) | 782 (-13%) | 4mo | $89,900 | $115 | 61 |
| 127 W Bush St | 0.35mi | 3/1.0 | 976 (+9%) | 8mo | $65,500 | $67 | 60 |
| 400 S Almer St | 0.46mi | 3/1.0 | 1,000 (+12%) | 10mo | $148,741 | $149 | 49 |
| 790 N State St | 0.44mi | 2/1.0 (-1) | 850 (-5%) | 21mo | $80,000 | $94 | 47 |
| 323 Green St | 0.47mi | 2/1.0 (-1) | 768 (-14%) | 6mo | $30,000 | $39 | 42 |
Match score weights: distance 35% · size 25% · config 20% · recency 20%. Top-matched comps best support the ARV.
Projected returns pro-forma
-3.0% appreciation · 3.0% rent growth · sell at horizon
- IRR
- -24.8%
- Equity multiple
- 0.16×
- Total profit
- $-25,952
- Equity at exit
- $16,386
- IRR
- -20.5%
- Equity multiple
- -0.08×
- Total profit
- $-33,088
- Equity at exit
- $9,502
Cash invested: $30,772 (down + closing). Projections, not guarantees.
Landlord ↔ Tenant lean methodology
- Overall (STATE)
- 62 Landlord-Friendly
- State Michigan
- 62 Landlord-Friendly · EVEN
- County
- — inherits STATE
- City
- — inherits STATE
ZIP-level market 48723
- Home prices YoY
- -24.7%
- Active inventory
- 46
- Price-to-rent
- 11.8×
Monthly cashflow live
- Estimated rent
- $774 medium interval (Pro) →
- Mortgage (P&I)
- −$576
- Tax from tax record
- −$117 /mo · $1,405/yr
- Insurance
- −$46
- HOA
- −$0
- Vacancy / Maint / Mgmt
- −$163
- Net cashflow
- $-128
Break-even live
UW: 25.0% down · 7.5% · 30yr · 1.5% tax · 5.0% vac · 8.0% maint · 8.0% mgmt
Financing live
Cash to close
- Down payment
- $27,475
- Closing costs
- $3,297
- Reserves months
- —
- Total cash needed
- —
Loan-product check · same deal, 3 products live
Conventional
25% down · 7.5% · 30yr
- Down + closing
- —
- Monthly P&I
- —
- Monthly cashflow
- —
- DSCR
- —
- Eligible?
- —
Personal DTI + credit; lowest rate.
DSCR
20% down · 8.5% · 30yr
- Down + closing
- —
- Monthly P&I
- —
- Monthly cashflow
- —
- DSCR
- —
- Eligible?
- —
No personal income docs; deal must DSCR.
Hard money
10% down · 12.0% · 12mo
- Down + closing
- —
- Monthly P&I
- —
- Monthly cashflow
- —
- DSCR
- —
- Eligible?
- —
Short-term bridge; refi at stabilization.
Rent comps 2 comps
| Address | Beds | Baths | Sqft | Rent | $/sqft | DOM | Units | Dist |
|---|---|---|---|---|---|---|---|---|
| 200 S State St Caro, MI | 1.0–2.0 | 1.0 | 673 | $698 | $1.04 | 44d | 1 | 0.42mi |
| 1012 Turner Dr Caro, MI | 2.0 | 1.0 | 812 | $850 | $1.05 | 44d | 1 | 0.51mi |
Listing history 24 events
-
2026-06-18days on market $109,900 Active 39 DOM
-
2026-06-17days on market $109,900 Active 38 DOM
-
2026-06-16days on market $109,900 Active 37 DOM
-
2026-06-15days on market $109,900 Active 36 DOM
-
2026-06-13days on market $109,900 Active 34 DOM
-
2026-06-12days on market $109,900 Active 33 DOM
-
2026-06-09days on market $109,900 Active 30 DOM
-
2026-06-08days on market $109,900 Active 29 DOM
-
2026-06-07days on market $109,900 Active 28 DOM
-
2026-06-05days on market $109,900 Active 26 DOM
-
2026-06-04days on market $109,900 Active 24 DOM
-
2026-06-02days on market $109,900 Active 23 DOM
-
2026-06-01days on market $109,900 Active 22 DOM
-
2026-05-31days on market $109,900 Active 21 DOM
-
2026-05-31days on market $109,900 Active 20 DOM
-
2026-05-11$109,900 Active 891-char remark
-
2026-05-10$109,900 Active 890-char remark
Show marketing remark (890 chars)
Reduced for quick sale. This is a ready to move in home with a main floor bedroom plus 2 large bedrooms up. The front enclosed, insulated and heated front entry was used for a 4th bedroom a few years ago. The kitchen and dining are open and the laundry hookups are near the rear entrance. The kitchen, dining and bath have new flooring. The large living shows open stairs to the . upstairs bedrooms. The partial basement has room for the 10 year old furnace which is hooked to the central air, also room for the 3 year old water heater. The rear entry which is a covered porch overlooks a 22x44 slab/patio plus lawn between this home and the 24x24 garage. The garage is heated and has an electric door opener. The driveway is shared. The west side of the yard is fenced. The seller had previously added blown in insulation. Newer breaker box in small storage room next to the basement door.
-
2026-01-31historical
-
2026-01-31historical
-
2025-12-18price $128,800
-
2025-12-18price $128,800
-
2025-10-17$129,800 Active
-
2025-10-17$129,800 Active
-
2004-02-11soldstatus $22,553
ⓘ Source: listings_history table (triggers on properties + properties_extension) + one-shot
backfill from property_details.listing_events for pre-trigger history.
Tax reassessment forecast MI · Partial reset (capped growth)
- Current annual tax
- $1,405 · $117/mo
- Projected year-2 tax
- $1,548 · $129/mo
- Expected delta
- +$144/yr (+$12/mo · 10.3%)
ⓘ Screening estimate from a state-policy table — verify with the county assessor before closing.
Climate risk First Street
- Flood 1/10 Low FEMA zone X (unshaded) · 0% chance over 30 yrs
- Wildfire 3/10 Moderate
- Heat 2/10 Low 7 d/yr ≥98°F today · 14 d/yr by 30 yrs out
- Wind 1/10 Low
- Air quality 2/10 Low 1 unhealthy d/yr today · 2 by 30 yrs out
Nearby sold comps map
Loading sold comps map…
Walkable amenities ~0.75 mi
Loading nearby amenities…
Taxation est. · year 1
- Rental income
- $9,286
- − Mortgage interest
- −$6,156
- − Property taxes
- −$1,405
- − Insurance
- −$550
- − Repairs & maintenance
- −$743
- − Management
- −$743
- − Depreciation
- −$3,197
- Taxable loss
- −$3,507
- Est. tax savings @ 24.0%
- +$842
- After-tax cash flow
- $-693/yr
For passive investors: Depreciation is non-cash, so a rental often shows a tax loss while cash-flowing — sheltering income. Rental losses are passive: they offset passive income freely, and up to $25,000/yr can offset ordinary (W-2) income if you actively participate and your MAGI is under $100k (phasing out to $0 by $150k); unused losses carry forward. On sale, claimed depreciation is recaptured at up to 25%, and gains may owe capital-gains tax (a 1031 exchange can defer both). Figures are a year-1 estimate at your 24.0% rate — not tax advice; consult a CPA.
Schools (NCES district)
- District
- Caro Community Schools
- NCES district ID
- 2608040
- Math proficiency
- 22% ▼ -14.00%
- Reading proficiency
- 36% ▼ -9.00%
- Median HH income
- $41,295
- Composite
- 24.49/100
- National rank
- #7658
- State rank
- #380 of 540 in MI
Livability — Caro
- Score
- 62/100
- State rank
- #546
- US rank
- #16985
Category grades
Schools grade is shown separately in the Schools card above.
Census & demographics
- Census place
- Caro, MI
- Population (ZIP)
- 11,960
Population outlook (Tuscola County) Hauer SSP2
- Today (2025)
- 49,930 people
- By 2030
- 47,294 · -5.3%
- By 2040
- 41,504 · -16.9%
- By 2050
- 35,560 · -28.8%
- By 2075
- 24,455 · -51.0%
- By 2100
- 16,507 · -66.9%
Race, ethnicity, and origin ACS 2023
- Neighborhood character
- Predominantly White (91%)
- Race & ethnicity
- White 91% Two or more races 5% Hispanic / Latino 4% Black 1%
- Common ancestry
- Romanian 8% Lithuanian 5% Slovak 2%
- Foreign-born
- 1% · Canada, China
- Languages at home
- 98% English-only · Spanish 1% German/W. Germanic 1%
Political lean MEDSL · Tuscola
- 2024 margin
- Solid R (+43.0) · D 27.9% · R 70.9% · Other 1.3%
- 2008→2024 swing
- -42.1pp toward R · 2008: -0.8pp · 2024: -43.0pp
- All cycles
- 2024: R+43.0 2020: R+39.3 2016: R+38.0 2012: R+10.8 2008: R+0.8
Not yet ingested
- Civics
- —
Market trends
- HPI YoY
- ▼ -74.64%
- Current HPI
- 227.0019
- Rent YoY
- —
- Metro
- —
- State GDP YoY
- ▲ 1.37%
- F500 in state
- 28
Industry mix (Fortune 500 HQ in MI)
| Industry | F500 HQs | Revenue |
|---|---|---|
| Automotive Parts | 3 | $48B |
|
||
| Automotive | 2 | $372B |
|
||
| Chemicals | 1 | $45B |
|
||
| Automotive Retail | 1 | $29B |
|
||
| Healthcare / Medical Devices | 1 | $23B |
|
||
| Automotive Technology | 1 | $20B |
|
||
Price history
+387.3% since first listed9 events — show timeline
- 2026-05-11 Listed $109,900 REALCOMP
- 2026-05-10 Listed $109,900 MiRealSource-MiMLS
- 2026-01-31 Listing Removed — REALCOMP
- 2026-01-31 Listing Removed — MiRealSource-MiMLS
- 2025-12-18 Price Changed $128,800 MiRealSource-MiMLS
- 2025-12-18 Price Changed $128,800 REALCOMP
- 2025-10-17 Listed $129,800 MiRealSource-MiMLS
- 2025-10-17 Listed $129,800 REALCOMP
- 2004-02-11 Sold (Public Records) $22,553 Public Records
Property tax history
+2.8%/yrLatest (2025): $1,405 · +3.4% YoY. Source: county tax records.
Cash-flow waterfall
monthlySold comps — $/sqft
last 12 mo · ≤1 miLoading sold comps…