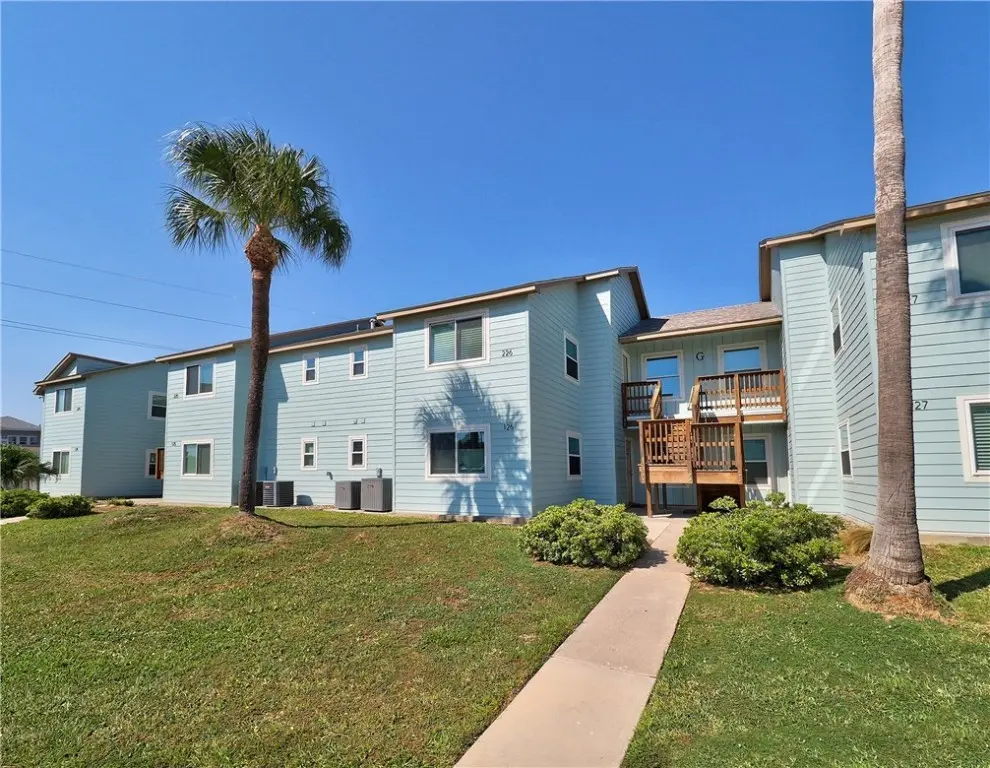
230 Cut Off #126 · Port Aransas, TX
Flood risk No data
- FEMA flood zone
- —
- Chance of flooding over 30 yrs
- —
- Est. flood insurance / yr
- —
Fire risk No data
- Est. fire insurance / yr
- —
Heat risk No data
- Hot days now (above threshold)
- —
- Hot days in 30 yrs
- —
Wind risk No data
- Chance of severe wind over 30 yrs
- —
Air-quality risk No data
- Unhealthy air days now
- —
- Unhealthy air days in 30 yrs
- —
Risk factors via First Street. Map © Google.
Why this score? — see what drove the D grade
The composite is a weighted blend of 9 inputs, each scored 0–100. Each bar is that input's sub-score; the figure is the points it added to the 100-point composite (weight × sub-score).
- ARV discount +13.9/15.0
- Cash flow +8.2/30.0
- 1% rule +5.1/10.0
- Schools +5.1/10.0
- Livability +3.4/5.0
- Rent growth +2.5/5.0
- Condition / age +2.5/5.0
- DSCR +2.2/10.0
- Appreciation +0.0/10.0
$299,900
🖨 Deal sheet (PDF) 📄 Offer letter ✓ Due diligence
Listing remarks MLS
JUST REDUCED TO A FANTASTIC PRICE. Great rental income for this 2-bedroom and 2-bathroom, ground floor unit at Aransas Harbors. This open concept, fully furnished condo is what you have been looking for. Ready to use yourself or ready to rent. Intracoastal Waterway is out your backyard where you can watch all the ships go by. Granite countertops, TVs, and stainless-steel kitchen appliances. Short term rentals are allowed.
Key facts
- Ground floor unit
- $559 HOA
- Community pool
Tags
Neighborhood map
What this means for you Summary
Snapshot
- This is a 2-bed/2.0-bath townhouse listed at $300k.
Deal economics
- At list price, monthly cash flow is $-281 ($-3k/yr) — negative.
- To cash-flow at today's rent, offer at most $250k (16.5% below list).
- Meets the 1% rule at list price ($3k rent vs $300k).
- Recommended offer: $250k (16.5% below list) — sets the bar for cash-flow.
- Cap rate 5.2% vs local median 1.1% in Port Aransas — top-decile yield for the area; either an underpriced asset or a hidden risk that comps aren't pricing in. Stress-test before assuming the spread holds.
Location & tenants
- Location reads 67/100 on livability (#525 in TX) — a middle-class / working-renter tenant base. Strengths: housing A+, employment A; Watch: commute C-, crime F, amenities F.
- Port Aransas ISD (rural): math 57% / reading 63% proficiency, ranked #68 of 826 in TX (top 8%) — acceptable for families but not a draw, mixed tenant base, ~2y average lease.
- Zoned schools: Olsen El (math 47% / reading 57%, grade C-, #742 of 4,322 statewide, top 19%, 227 students, 35% FRL); Brundrett Middle (math 57% / reading 67%, grade B+, #134 of 1,662 statewide, top 8%, 115 students, 31% FRL); Port Aransas H S (math 74% / reading 74%, grade B+, #82 of 1,632 statewide, top 6%, 204 students, 19% FRL).
- Market conditions: 1024 active listings in the ZIP; 4 comparable units currently listed for rent nearby; rentals lingering (median 46d on market — plan ~5-8 weeks vacancy on turnover, expect pricing pressure); 50% of comp listings sitting > 30 days — soft ceiling on asking rent; 1,397 units permitted in Nueces County in 2024 (47 in 5+ unit buildings).
Forward outlook
- Local home prices are declining (-3.0%/yr); year-one equity from $2k of loan paydown is wiped out by about $9k of value loss. Plan a longer hold.
- Nueces County population projected at +36% by 2050 — long-run rental-demand tailwind backs the buy-and-hold thesis.
Negotiation context
- It's been on market 256 days — a 12% lower offer ($264k) is reasonable based on typical stale-listing flexibility.
- 10 sale attempts since 23y ago; this cycle's ask has dropped $40k (12%) from the opening price — seller is motivated, your offer sets the floor, not the list.
Questions for the listing agent
- What do current leases actually rent for vs. the listed asking? Can we see a recent rent roll and the last 12 months of T-12 income?
- It's been on market 256 days. Have you received any prior offers? Is the seller open to a 17% concession, seller financing, or rate buy-down credit?
- What does the HOA fee cover, when was the last increase, and are there any pending special assessments or reserve-fund shortfalls?
- Why hasn't it sold? Are there any deal-killer items the seller is aware of (foundation, flood, title, zoning, code violations)?
- Is there a deadline driving the sale (1031 exchange, divorce, estate, relocation)? That informs how much negotiation room exists.
- Schools are A-rated — typically a magnet for longer-tenancy family renters. What's the average tenant stay here, and is there a school-zone premium baked into asking?
- Crime grade is F in this area — have there been break-ins, vandalism, or insurance claims at this property in the last 3 years? What carrier currently insures it and at what premium?
- The area grade is low — what's the realistic commute time and amenity access for the typical tenant pool here? Any planned neighborhood developments (good or bad) we should know about?
- What's the average days-on-market for RENTAL listings here right now (not sales)? A rising rental-DOM trend means longer vacancies and softer asking-rent achievability than the comps imply.
- What's the recent tenant-quality profile in this submarket — average credit score on applications, eviction rate, late-payment / NSF rate, and stable-employment percentage? A property-management company in the area should have these aggregated.
- How much new for-sale + rental construction is in the pipeline within 1–3 miles? Heavy new supply typically softens prices + rents 12–24 months out; constrained supply supports both.
Investment metrics
- 1% rule
- 1.01% ✓
- Cap rate
- 5.17%
- Cash-on-cash
- -4.01%
- DSCR
- 0.82
- GRM
- 8.3
CMA / ARV
- ARV (median comp)
- $349,224
- List price
- $299,900
- Delta
- -14.12%
- Verdict
- UNDERPRICED
- Comps
- 20 within 1.0 mi
Show comp detail 4 sales within ~0.75 mi
| Address | Dist | Beds/Ba | Sqft | Sold | Price | $/sf | Match |
|---|---|---|---|---|---|---|---|
| 230 Cut Off Rd #205 | 0.00mi | 2/2.0 | 1,093 (0%) | 1mo | $330,000 | $302 | 100 |
| 200 6th, Heritage Ln #3 | 0.14mi | 2/2.0 | 1,111 (+2%) | 21mo | $229,000 | $206 | 73 |
| 230 Cut Off Rd, Aransas Hbrs #122 | 0.00mi | 2/1.0 | 939 (-14%) | 11mo | $239,000 | $255 | 63 |
| 200 W Cotter Unit C1 | 0.46mi | 2/2.0 | 1,230 (+12%) | 10mo | $599,000 | $487 | 49 |
Match score weights: distance 35% · size 25% · config 20% · recency 20%. Top-matched comps best support the ARV.
Projected returns pro-forma
-3.0% appreciation · 3.0% rent growth · sell at horizon
- IRR
- -22.9%
- Equity multiple
- 0.21×
- Total profit
- $-66,066
- Equity at exit
- $44,716
- IRR
- -16.8%
- Equity multiple
- 0.06×
- Total profit
- $-78,871
- Equity at exit
- $25,930
Cash invested: $83,972 (down + closing). Projections, not guarantees.
Landlord ↔ Tenant lean methodology
- Overall (STATE)
- 87 Strongly Landlord-Friendly
- State Texas
- 87 Strongly Landlord-Friendly · R+5
- County
- — inherits STATE
- City
- — inherits STATE
ZIP-level market 78373
- Active inventory
- 1024
- Price-to-rent
- 8.3×
Monthly cashflow live
- Estimated rent
- $3,029 medium interval (Pro) →
- Mortgage (P&I)
- −$1,573
- Tax from tax record
- −$417 /mo · $5,002/yr
- Insurance
- −$125
- HOA
- −$559
- Lot rent
- −$0
- Vacancy / Maint / Mgmt
- −$636
- Net cashflow
- $-281
Break-even live
Sensitivity live
| Price | -10% $-111 | -5% $-196 | +0% $-281 | +5% $-366 | +10% $-451 |
|---|---|---|---|---|---|
| Rent | -10% $-520 | -5% $-400 | +0% $-281 | +5% $-161 | +10% $-42 |
| Rate | -1.0pp $-130 | -0.5pp $-205 | base $-281 | +0.5pp $-359 | +1.0pp $-438 |
UW: 25.0% down · 7.5% · 30yr · 1.5% tax · 5.0% vac · 8.0% maint · 8.0% mgmt
Financing live
Cash to close
- Down payment
- $74,975
- Closing costs
- $8,997
- Reserves months
- —
- Total cash needed
- —
Loan-product check · same deal, 3 products live
Conventional
25% down · 7.5% · 30yr
- Down + closing
- —
- Monthly P&I
- —
- Monthly cashflow
- —
- DSCR
- —
- Eligible?
- —
Personal DTI + credit; lowest rate.
DSCR
20% down · 8.5% · 30yr
- Down + closing
- —
- Monthly P&I
- —
- Monthly cashflow
- —
- DSCR
- —
- Eligible?
- —
No personal income docs; deal must DSCR.
Hard money
10% down · 12.0% · 12mo
- Down + closing
- —
- Monthly P&I
- —
- Monthly cashflow
- —
- DSCR
- —
- Eligible?
- —
Short-term bridge; refi at stabilization.
Rent comps 4 comps
| Address | Beds | Baths | Sqft | Rent | $/sqft | DOM | Units | Dist |
|---|---|---|---|---|---|---|---|---|
| 519 West Avenue C Unit B Port Aransas, TX | 3.0 | 3.0 | 1427 | $3,500 | $2.45 | 46d | 1 | 0.20mi |
| 321 Seventh St Unit A Port Aransas, TX | 2.0 | 1.0 | 1344 | $2,775 | $2.06 | 16d | 1 | 0.32mi |
| 321 Seventh St Unit B Port Aransas, TX | 1.0 | 1.0 | 1344 | $1,775 | $1.32 | 16d | 1 | 0.32mi |
| 200 W Cotter Ave Port Aransas, TX | 2.0 | 2.0 | 1230 | $4,000 | $3.25 | 46d | 1 | 0.43mi |
HOA detail
- Monthly dues
- $559 · $6,708/yr
- Likely covers
- water
Listing history 46 events
-
2026-06-21days on market $299,900 Active 256 DOM
-
2026-06-18days on market $299,900 Active 253 DOM
-
2026-06-17days on market $299,900 Active 252 DOM
-
2026-06-16days on market $299,900 Active 251 DOM
-
2026-06-15days on market $299,900 Active 250 DOM
-
2026-06-14days on market $299,900 Active 248 DOM
-
2026-06-13days on market $299,900 Active 247 DOM
-
2026-06-10days on market $299,900 Active 245 DOM
-
2026-06-09days on market $299,900 Active 244 DOM
-
2026-06-08days on market $299,900 Active 243 DOM
-
2026-06-07days on market $299,900 Active 242 DOM
-
2026-06-03days on market $299,900 Active 238 DOM
-
2026-06-02days on market $299,900 Active 237 DOM
-
2026-06-01days on market $299,900 Active 236 DOM
-
2026-05-31days on market $299,900 Active 235 DOM
-
2026-05-30days on market $299,900 Active 234 DOM
-
2026-05-18price $299,900 425-char remark
Show marketing remark (425 chars)
JUST REDUCED TO A FANTASTIC PRICE. Great rental income for this 2-bedroom and 2-bathroom, ground floor unit at Aransas Harbors. This open concept, fully furnished condo is what you have been looking for. Ready to use yourself or ready to rent. Intracoastal Waterway is out your backyard where you can watch all the ships go by. Granite countertops, TVs, and stainless-steel kitchen appliances. Short term rentals are allowed.
-
2026-02-04price $324,900 425-char remark
Show marketing remark (425 chars)
JUST REDUCED TO A FANTASTIC PRICE. Great rental income for this 2-bedroom and 2-bathroom, ground floor unit at Aransas Harbors. This open concept, fully furnished condo is what you have been looking for. Ready to use yourself or ready to rent. Intracoastal Waterway is out your backyard where you can watch all the ships go by. Granite countertops, TVs, and stainless-steel kitchen appliances. Short term rentals are allowed.
-
2025-10-08$339,900 Active 425-char remark
Show marketing remark (425 chars)
JUST REDUCED TO A FANTASTIC PRICE. Great rental income for this 2-bedroom and 2-bathroom, ground floor unit at Aransas Harbors. This open concept, fully furnished condo is what you have been looking for. Ready to use yourself or ready to rent. Intracoastal Waterway is out your backyard where you can watch all the ships go by. Granite countertops, TVs, and stainless-steel kitchen appliances. Short term rentals are allowed.
-
2025-04-07price $339,900
-
2025-01-27status Active
-
2025-01-27price $374,995
-
2024-10-05$399,000 Active
-
2021-08-23historical
-
2021-08-20soldstatus Closed
-
2021-08-19soldstatus
-
2021-07-22status Pending
-
2021-07-12historical Active Under Contract
-
2021-07-08price $325,000
-
2021-06-09$349,000 Active
-
2019-09-26soldstatus
-
2014-11-12soldstatus
-
2014-11-11soldstatus
-
2014-10-29$185,000
-
2008-02-15$197,500
-
2007-07-03soldstatus
-
2007-07-02soldstatus
-
2007-06-18$195,000
-
2007-03-12soldstatus
-
2007-03-08soldstatus
-
2006-10-09$185,000
-
2005-10-04soldstatus
-
2004-08-10soldstatus
-
2004-04-14$125,000
-
2003-11-03$125,000
-
2000-11-30soldstatus
ⓘ Source: listings_history table (triggers on properties + properties_extension) + one-shot
backfill from property_details.listing_events for pre-trigger history.
Tax reassessment forecast TX · Resets to sale price
- Current annual tax
- $5,002 · $417/mo
- Projected year-2 tax
- $5,488 · $457/mo
- Expected delta
- +$486/yr (+$41/mo · 9.7%)
ⓘ Screening estimate from a state-policy table — verify with the county assessor before closing.
Nearby sold comps map
Loading sold comps map…
Walkable amenities ~0.75 mi
Loading nearby amenities…
Taxation est. · year 1
- Rental income
- $36,345
- − Mortgage interest
- −$16,799
- − Property taxes
- −$5,002
- − Insurance
- −$1,500
- − Repairs & maintenance
- −$2,908
- − Management
- −$2,908
- − HOA
- −$6,708
- − Depreciation
- −$8,724
- Taxable loss
- −$8,203
- Est. tax savings @ 24.0%
- +$1,969
- After-tax cash flow
- $-1,401/yr
For passive investors: Depreciation is non-cash, so a rental often shows a tax loss while cash-flowing — sheltering income. Rental losses are passive: they offset passive income freely, and up to $25,000/yr can offset ordinary (W-2) income if you actively participate and your MAGI is under $100k (phasing out to $0 by $150k); unused losses carry forward. On sale, claimed depreciation is recaptured at up to 25%, and gains may owe capital-gains tax (a 1031 exchange can defer both). Figures are a year-1 estimate at your 24.0% rate — not tax advice; consult a CPA.
Schools (NCES district)
- District
- Port Aransas ISD
- NCES district ID
- 4835370
- Math proficiency
- 57% ▼ -9.00%
- Reading proficiency
- 63% ▼ -2.00%
- Median HH income
- $47,528
- Composite
- 50.82/100
- National rank
- #1803
- State rank
- #68 of 826 in TX
Livability — Port Aransas
- Score
- 67/100
- State rank
- #525
- US rank
- #10286
Category grades
Schools grade is shown separately in the Schools card above.
Census & demographics
- Census place
- Port Aransas, TX
- Population (ZIP)
- 3,314
Population outlook (Nueces County) Hauer SSP2
- Today (2025)
- 418,037 people
- By 2030
- 447,123 · +7.0%
- By 2040
- 505,911 · +21.0%
- By 2050
- 567,522 · +35.8%
- By 2075
- 729,686 · +74.6%
- By 2100
- 847,087 · +102.6%
Race, ethnicity, and origin ACS 2023
- Neighborhood character
- Predominantly White (87%)
- Race & ethnicity
- White 87% Two or more races 9% Hispanic / Latino 4%
- Common ancestry
- Serbian 2% Slovak 2% Iranian 2%
- Foreign-born
- 8% · Canada
- Languages at home
- 92% English-only · Other Indo-European 4% Spanish 3%
Political lean MEDSL · Nueces
- 2024 margin
- R (+11.5) · D 43.8% · R 55.3%
- 2008→2024 swing
- -7.1pp toward R · 2008: -4.4pp · 2024: -11.5pp
- All cycles
- 2024: R+11.5 2020: R+2.9 2016: R+1.5 2012: R+3.2 2008: R+4.4
Not yet ingested
- Civics
- —
Market trends
- HPI YoY
- ▼ -205.54%
- Current HPI
- 268.699
- Rent YoY
- —
- Metro
- —
- State GDP YoY
- ▲ 3.95%
- F500 in state
- 110
Industry mix (Fortune 500 HQ in TX)
| Industry | F500 HQs | Revenue |
|---|---|---|
| Energy | 16 | $1,198B |
|
||
| Technology | 5 | $198B |
|
||
| Engineering / Construction | 4 | $72B |
|
||
| Energy Services | 3 | $60B |
|
||
| Utilities | 3 | $41B |
|
||
| Healthcare | 2 | $330B |
|
||
Price history
+139.9% since first listed30 events — show timeline
- 2026-05-18 Price Changed $299,900 CBMLS
- 2026-02-04 Price Changed $324,900 CBMLS
- 2025-10-08 Listed $339,900 CBMLS
- 2025-04-07 Price Changed $339,900 CBMLS
- 2025-01-27 Relisted — CBMLS
- 2025-01-27 Price Changed $374,995 CBMLS
- 2024-10-05 Listed $399,000 CBMLS
- 2021-08-23 Delisted — CBMLS
- 2021-08-20 Sold (MLS) — CBMLS
- 2021-08-19 Sold (Public Records) — Public Records
- 2021-07-22 Pending — CBMLS
- 2021-07-12 Contingent — CBMLS
- 2021-07-08 Price Changed $325,000 CBMLS
- 2021-06-09 Listed $349,000 CBMLS
- 2019-09-26 Sold (Public Records) — Public Records
- 2014-11-12 Sold (Public Records) — Public Records
- 2014-11-11 Sold (MLS) — CBMLS
- 2014-10-29 Listed $185,000 CBMLS
- 2008-02-15 Listed $197,500 CBMLS
- 2007-07-03 Sold (Public Records) — Public Records
- 2007-07-02 Sold (MLS) — CBMLS
- 2007-06-18 Listed $195,000 CBMLS
- 2007-03-12 Sold (Public Records) — Public Records
- 2007-03-08 Sold (MLS) — CBMLS
- 2006-10-09 Listed $185,000 CBMLS
- 2005-10-04 Sold (Public Records) — Public Records
- 2004-08-10 Sold (Public Records) — Public Records
- 2004-04-14 Listed $125,000 CBMLS
- 2003-11-03 Listed $125,000 CBMLS
- 2000-11-30 Sold (Public Records) — Public Records
Property tax history
+5.3%/yrLatest (2025): $5,002 · +2.2% YoY. Source: county tax records.
Cash-flow waterfall
monthlySold comps — $/sqft
last 12 mo · ≤1 miLoading sold comps…