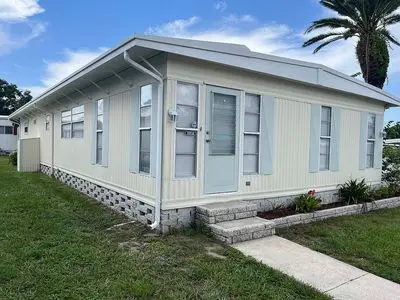
15435 Lakeshore Villa Blvd · Lake Magdalene, FL
Flood risk 1/10 · Minimal
- FEMA flood zone
- X (unshaded)
- Chance of flooding over 30 yrs
- 0.0%
- Est. flood insurance / yr
- $507 – $1,088
Fire risk 1/10 · Minimal
- Est. fire insurance / yr
- $947 – $1,759
Heat risk 10/10 · Severe
- Hot days now (above 108°F)
- 7 days/yr
- Hot days in 30 yrs
- 25 days/yr
Wind risk 9/10 · Severe
- Chance of severe wind over 30 yrs
- 99.0%
Air-quality risk 3/10 · Minor
- Unhealthy air days now
- 3 days/yr
- Unhealthy air days in 30 yrs
- 3 days/yr
Risk factors via First Street. Map © Google.
Why this score? — see what drove the B- grade
The composite is a weighted blend of 9 inputs, each scored 0–100. Each bar is that input's sub-score; the figure is the points it added to the 100-point composite (weight × sub-score).
- Cash flow +30.0/30.0
- 1% rule +10.0/10.0
- DSCR +10.0/10.0
- ARV discount +7.5/15.0
- Schools +4.2/10.0
- Livability +3.6/5.0
- Rent growth +2.3/5.0
- Condition / age +2.2/5.0
- Appreciation +0.0/10.0
$80,000
🖨 Deal sheet 📄 Offer letter ✓ Due diligence
Listing remarks
This beautiful newly renovated 2/2. Enjoy morning coffee in your screened porch. Home offers storage place and washer/dryer hookup. Beautiful community which offers many community events/activities. Also offers pool, gym, dog park and more must be 55+. Enjoy Florida living for only $80,000!
Key facts
- Dog park
- Washer dryer hookup
- Screened porch
Tags
Neighborhood map
What this means for you Summary
Snapshot
- This is a 2-bed/2.0-bath other listed at $80k. Condition is rated fair.
Deal economics
- At list price, monthly cash flow is $771 ($9k/yr) — positive.
- The deal already cash-flows at list — no discount required.
- Meets the 1% rule at list price ($2k rent vs $80k).
- Recommended offer: $78k (3.0% below list) — sets the bar for market timing.
Location & tenants
- Location reads 72/100 on livability (#361 in FL) — a middle-class / working-renter tenant base. Strengths: housing A+, crime A, employment B+; Watch: schools D, commute D, amenities F.
- Hillsborough (suburban): math 47% / reading 50% proficiency, ranked #41 of 73 in FL (top 56%) — families likely to look elsewhere, expect single-tenant / working-renter base with shorter leases.
- Market conditions: Rents soft (-0.7%/yr); 108 active listings in the ZIP; 39 comparable units currently listed for rent nearby; rentals at typical pace (median 24d on market — plan ~3-4 weeks tenant-placement turnaround); lower-income renter base — watch delinquency; 9,053 units permitted in Hillsborough County in 2024 (4,555 in 5+ unit buildings).
- At $1,676/mo this rent would consume 46% of the median local household income ($44k/yr) (locally 4426% of renters already pay >50% of income on rent) — very limited rent-growth headroom before tenants either downsize or default.
Forward outlook
- Local home prices are declining (-3.0%/yr); year-one equity from $553 of loan paydown is wiped out by about $2k of value loss. Plan a longer hold.
- Hillsborough County population projected at +37% by 2050 — long-run rental-demand tailwind backs the buy-and-hold thesis.
- At projected returns (-3.0% appreciation + 0.0% rent growth), your $22k cash investment doubles in ~3 years — after that, you're playing with house money.
Negotiation context
- It's been on market 37 days — a 3% lower offer ($78k) is reasonable based on typical stale-listing flexibility.
- 2 sale attempts with the ask held roughly flat each time — persistent listings suggest the price (not the market) is what's stuck; bring a comps-based counter.
Risks & watch-outs
- Climate carrying-cost: severe wind risk, 99% chance of damaging wind over 30y; extreme-heat days projected 7→25/yr by 2055 (HVAC capex compounding) — expect insurance premiums to compound above CPI over the hold.
Questions for the listing agent
- It's been on market 37 days. Have you received any prior offers? Is the seller open to a 3% concession, seller financing, or rate buy-down credit?
- Have any recent inspections been done? Can we get a copy of the seller's disclosures and any deferred-maintenance estimates?
- Is there a deadline driving the sale (1031 exchange, divorce, estate, relocation)? That informs how much negotiation room exists.
- Schools are D-rated, which usually means shorter tenancies and higher turnover. Who's the typical renter profile here, and what's been the actual vacancy rate?
- What's the average days-on-market for RENTAL listings here right now (not sales)? A rising rental-DOM trend means longer vacancies and softer asking-rent achievability than the comps imply.
- What's the recent tenant-quality profile in this submarket — average credit score on applications, eviction rate, late-payment / NSF rate, and stable-employment percentage? A property-management company in the area should have these aggregated.
- How much new for-sale + rental construction is in the pipeline within 1–3 miles? Heavy new supply typically softens prices + rents 12–24 months out; constrained supply supports both.
Investment metrics
- 1% rule
- 2.10% ✓
- Cap rate
- 17.86%
- Cash-on-cash
- 41.33%
- DSCR
- 2.84
- GRM
- 4.0
CMA / ARV
No comps found within radius.
Projected returns pro-forma
-3.0% appreciation · 0.0% rent growth · sell at horizon
- IRR
- 34.5%
- Equity multiple
- 2.40×
- Total profit
- $31,284
- Equity at exit
- $11,928
- IRR
- 39.7%
- Equity multiple
- 4.20×
- Total profit
- $71,627
- Equity at exit
- $6,917
Cash invested: $22,400 (down + closing). Projections, not guarantees.
Landlord ↔ Tenant lean methodology
- Overall (STATE)
- 87 Strongly Landlord-Friendly
- State Florida
- 87 Strongly Landlord-Friendly · R+3
- County
- — inherits STATE
- City
- — inherits STATE
ZIP-level market 33613
- Rents YoY
- -0.7%
- Active inventory
- 108
- Price-to-rent
- 4.0×
Monthly cashflow live
- Estimated rent
- $1,676 high interval (Pro) →
- Mortgage (P&I)
- −$420
- Tax est. 1.5%
- −$100 /mo · $1,200/yr
- Insurance
- −$33
- HOA
- −$0
- Vacancy / Maint / Mgmt
- −$352
- Net cashflow
- $771
Break-even live
UW: 25.0% down · 7.5% · 30yr · 1.5% tax · 5.0% vac · 8.0% maint · 8.0% mgmt
Financing live
Cash to close
- Down payment
- $20,000
- Closing costs
- $2,400
- Reserves months
- —
- Total cash needed
- —
Loan-product check · same deal, 3 products live
Conventional
25% down · 7.5% · 30yr
- Down + closing
- —
- Monthly P&I
- —
- Monthly cashflow
- —
- DSCR
- —
- Eligible?
- —
Personal DTI + credit; lowest rate.
DSCR
20% down · 8.5% · 30yr
- Down + closing
- —
- Monthly P&I
- —
- Monthly cashflow
- —
- DSCR
- —
- Eligible?
- —
No personal income docs; deal must DSCR.
Hard money
10% down · 12.0% · 12mo
- Down + closing
- —
- Monthly P&I
- —
- Monthly cashflow
- —
- DSCR
- —
- Eligible?
- —
Short-term bridge; refi at stabilization.
Rent comps 39 comps
| Address | Beds | Baths | Sqft | Rent | $/sqft | DOM | Units | Dist |
|---|---|---|---|---|---|---|---|---|
| 14912 Pinecrest Rd Tampa, FL | 3.0 | 1.0 | 850 | $1,750 | $2.06 | 3d | 1 | 0.62mi |
| 15101 N 15th St Lot 7B Lutz, FL | 2.0 | 1.0 | — | $1,000 | — | 24d | 1 | 0.84mi |
| 202 Windwood Oaks Dr Tampa, FL | 2.0 | 1.0–2.0 | 712 | $1,762 | $2.47 | 1d | 9 | 0.85mi |
| 1510 E 151st Ave Lutz, FL | 3.0 | 2.0 | — | $1,390 | — | 24d | 1 | 0.89mi |
| 814 Settlers Rd Tampa, FL | 3.0 | 2.0 | 1412 | $2,200 | $1.56 | 21d | 1 | 0.91mi |
| 14919 Old Pointe Rd Tampa, FL | 3.0 | 2.0 | 1680 | $2,800 | $1.67 | 24d | 1 | 0.93mi |
| 14600 N Nebraska Ave Tampa, FL | 1.0 | 1.0 | 575 | $1,150 | $2.00 | 4d | 1 | 0.95mi |
| 14600 N Nebraska Ave Tampa, FL | 1.0 | 1.0 | 575 | $1,250 | $2.17 | 24d | 1 | 0.95mi |
| 1011 Orchard Arbour Ct Tampa, FL | 3.0 | 2.5 | 2106 | $2,900 | $1.38 | 24d | 1 | 0.97mi |
| 1011 Orchard Arbour Ct Tampa, FL | 3.0 | 2.5 | 2106 | $2,950 | $1.40 | 21d | 1 | 0.97mi |
| 1102 Arbour Verde Ct Tampa, FL | 3.0 | 2.5 | 2020 | $2,645 | $1.31 | 20d | 1 | 0.99mi |
| 14524 N Nebraska Ave Unit 204A Tampa, FL | 2.0 | 2.0 | 1008 | $1,650 | $1.64 | 24d | 1 | 1.00mi |
| 14524 N Nebraska Ave Tampa, FL | 2.0 | 2.0 | 1008 | $1,640 | $1.63 | 24d | 1 | 1.00mi |
| 15050 Blue Quaker Pl Tampa, FL | 3.0 | 2.5 | 1631 | $2,700 | $1.66 | 24d | 1 | 1.06mi |
| 1250 Skipper Rd Tampa, FL | 1.0–2.0 | 1.0 | 650 | $1,299 | $2.00 | 24d | 1 | 1.06mi |
| 1920 E 151st Ave Lot 12 Lutz, FL | 1.0 | 1.0 | — | $1,150 | — | 24d | 1 | 1.11mi |
| 14350 Ambrosia St Tampa, FL | 1.0–2.0 | 1.0–2.0 | 993 | $2,385 | $2.40 | 1d | 16 | 1.17mi |
| 703 Regency Ct Tampa, FL | 3.0 | 2.0 | 1528 | $2,700 | $1.77 | 24d | 1 | 1.20mi |
| 1908 E 148th Ave Lutz, FL | 3.0 | 1.0 | 1400 | $750 | $0.54 | 24d | 1 | 1.23mi |
| 1112 E 142nd Ave Tampa, FL | 3.0 | 2.0 | 1120 | $1,675 | $1.50 | 23d | 2 | 1.29mi |
| 14323 Lucerne Dr Tampa, FL | 1.0–2.0 | 1.0–1.5 | — | $1,695 | — | 24d | 1 | 1.30mi |
| 2010 E 148th Ave Lutz, FL | 3.0 | 1.5 | 1250 | $1,650 | $1.32 | 17d | 1 | 1.33mi |
| 2010 E 148th Ave Lutz, FL | 3.0 | 1.5 | 1250 | $1,750 | $1.40 | 24d | 2 | 1.34mi |
| 15420 Livingston Ave Lutz, FL | 1.0–3.0 | 1.0–2.0 | 900 | $1,564 | $1.74 | 1d | 9 | 1.35mi |
| 1104 E 140th Ave Tampa, FL | 1.0 | 1.0 | 494 | $1,200 | $2.43 | 4d | 6 | 1.37mi |
| 1101 E 140th Ave Tampa, FL | 1.0 | 1.0 | 500 | $1,150 | $2.30 | 24d | 1 | 1.39mi |
| 13944 Sandy Hill Loop Tampa, FL | 1.0–2.0 | 1.0–2.0 | 755 | $1,500 | $1.99 | 2d | 5 | 1.40mi |
| 1500 Jo Ann Ct Tampa, FL | 1.0 | 1.0 | 575 | $1,150 | $2.00 | 24d | 1 | 1.45mi |
| 2204 Irene St Unit B Lutz, FL | 2.0 | 1.0 | — | $1,500 | — | 24d | 1 | 1.46mi |
| 14309 N 18th St Tampa, FL | 3.0 | 2.0 | 1300 | $1,950 | $1.50 | 24d | 1 | 1.46mi |
| 2205 Irene St Unit 2 Lutz, FL | 2.0 | 1.0 | 900 | $1,195 | $1.33 | 24d | 1 | 1.49mi |
| 1501 E 142nd Ave Apt 102 Tampa, FL | 1.0 | 1.0 | 630 | $900 | $1.43 | 16d | 1 | 1.49mi |
| 2208 Irene St Unit 1501434P Lutz, FL | 1.0 | 1.0 | 656 | $1,989 | $3.03 | 3d | 1 | 1.49mi |
| 14609 Banyan Bluff Dr Tampa, FL | 1.0–2.0 | 1.0–2.0 | 868 | $1,749 | $2.01 | 1d | 16 | 1.49mi |
| 1810 E 143rd Ave Unit 2 Tampa, FL | 3.0 | 1.0 | 730 | $1,345 | $1.84 | 24d | 1 | 1.49mi |
| 1503 E 142nd Ave Tampa, FL | 1.0 | 1.0 | 630 | $900 | $1.43 | 24d | 1 | 1.50mi |
| 1503 E 142nd Ave Tampa, FL | 1.0 | 1.0 | 630 | $900 | $1.43 | 3d | 1 | 1.50mi |
| 1503 E 142nd Ave Tampa, FL | 2.0 | 1.0 | 900 | $1,375 | $1.53 | 12d | 1 | 1.50mi |
| 1503 E 142nd Ave Unit 201 Tampa, FL | 2.0 | 1.0 | 900 | $1,375 | $1.53 | 16d | 1 | 1.50mi |
Listing history 17 events
-
2026-06-18days on market $80,000 Active 37 DOM
-
2026-06-17days on market $80,000 Active 36 DOM
-
2026-06-16days on market $80,000 Active 35 DOM
-
2026-06-15days on market $80,000 Active 34 DOM
-
2026-06-13days on market $80,000 Active 32 DOM
-
2026-06-13days on market $80,000 Active 31 DOM
-
2026-06-09days on market $80,000 Active 28 DOM
-
2026-06-08days on market $80,000 Active 27 DOM
-
2026-06-07days on market $80,000 Active 26 DOM
-
2026-06-04days on market $80,000 Active 23 DOM
-
2026-06-03days on market $80,000 Active 22 DOM
-
2026-06-02days on market $80,000 Active 21 DOM
-
2026-06-01days on market $80,000 Active 20 DOM
-
2026-05-31days on market $80,000 Active 19 DOM
-
2026-05-12$80,000 Active 291-char remark
-
2026-02-01historical $2,095
-
2025-09-10$2,095
ⓘ Source: listings_history table (triggers on properties + properties_extension) + one-shot
backfill from property_details.listing_events for pre-trigger history.
Climate risk First Street
- Flood 1/10 Low FEMA zone X (unshaded) · 0% chance over 30 yrs
- Wildfire 1/10 Low
- Heat 10/10 Extreme 7 d/yr ≥108°F today · 25 d/yr by 30 yrs out
- Wind 9/10 Extreme 99% chance of damaging wind over 30 yrs
- Air quality 3/10 Moderate 3 unhealthy d/yr today · 3 by 30 yrs out
Nearby sold comps map
Loading sold comps map…
Walkable amenities ~0.75 mi
Loading nearby amenities…
Taxation est. · year 1
- Rental income
- $20,116
- − Mortgage interest
- −$4,481
- − Property taxes
- −$1,200
- − Insurance
- −$400
- − Repairs & maintenance
- −$1,609
- − Management
- −$1,609
- − Depreciation
- −$2,327
- Taxable income
- $8,489
- Est. tax owed @ 24.0%
- −$2,037
- After-tax cash flow
- $7,220/yr
For passive investors: Depreciation is non-cash, so a rental often shows a tax loss while cash-flowing — sheltering income. Rental losses are passive: they offset passive income freely, and up to $25,000/yr can offset ordinary (W-2) income if you actively participate and your MAGI is under $100k (phasing out to $0 by $150k); unused losses carry forward. On sale, claimed depreciation is recaptured at up to 25%, and gains may owe capital-gains tax (a 1031 exchange can defer both). Figures are a year-1 estimate at your 24.0% rate — not tax advice; consult a CPA.
Condition & rehab AI · 2 photos
This property is in fair condition with good exterior and interior features. It has potential for cosmetic updates and maintenance to increase its value for both resale and rental.
Value-add opportunities
- Both Painting the exterior siding — Fresh paint can enhance the curb appeal and increase both resale and rental value.
- Both Landscaping improvements — Well-maintained landscaping can improve curb appeal and attract more potential buyers or renters.
- Both Interior updates — Fresh paint and minor updates can make the interior more appealing and increase both resale and rental value.
- Rental HVAC maintenance — A well-maintained HVAC system can attract more renters and reduce utility costs.
- Both Community engagement — Engaging with the community can increase the property's visibility and attract more potential buyers or renters.
- Both Property maintenance — Regular maintenance can prevent costly repairs and keep the property in good condition, increasing its value over time.
Renovation cost estimate screening
Value-add ROI direction
- Both Painting the exterior siding — Fresh paint can enhance the curb appeal and increase both resale and rental value. ↑
- Both Landscaping improvements — Well-maintained landscaping can improve curb appeal and attract more potential buyers or renters. ↑
- Both Interior updates — Fresh paint and minor updates can make the interior more appealing and increase both resale and rental value. ↑
- Rental HVAC maintenance — A well-maintained HVAC system can attract more renters and reduce utility costs. ↑
- Both Community engagement — Engaging with the community can increase the property's visibility and attract more potential buyers or renters. ↑
- Both Property maintenance — Regular maintenance can prevent costly repairs and keep the property in good condition, increasing its value over time. ↑
ⓘ Cost ranges are severity-bucket heuristics (US national rule-of-thumb). Get contractor quotes + a written scope before underwriting a rehab budget.
Schools (NCES district)
- District
- Hillsborough
- NCES district ID
- 1200870
- Math proficiency
- 47% ▼ -8.00%
- Reading proficiency
- 50% ▼ -4.00%
- Median HH income
- $50,622
- Composite
- 41.6/100
- National rank
- #3435
- State rank
- #41 of 73 in FL
Livability — Lake Magdalene
- Score
- 72/100
- State rank
- #361
- US rank
- #6328
Category grades
Schools grade is shown separately in the Schools card above.
Census & demographics
- Census place
- Lake Magdalene, FL
- County
- Hillsborough County · 1,540,968 people
- City population
- 27,588
- Metro
- Tampa-St. Petersburg-Clearwater, FL
- Population (ZIP)
- 37,591
- Household income
- $44,032
- Rent vs Own
- Severe rent burden
- 4426.0
Population outlook (Hillsborough County) Hauer SSP2
- Today (2025)
- 1,607,022 people
- By 2030
- 1,733,968 · +7.9%
- By 2040
- 1,979,565 · +23.2%
- By 2050
- 2,203,427 · +37.1%
- By 2075
- 2,667,893 · +66.0%
- By 2100
- 2,891,558 · +79.9%
Race, ethnicity, and origin ACS 2023
- Neighborhood character
- Diverse neighborhood (Simpson 0.69)
- Race & ethnicity
- White 39% Hispanic / Latino 35% Black 18% Two or more races 16% Asian 5% Native American 1%
- Hispanic origin (detail)
- Mexican 9% Puerto Rican 9% Cuban 6% Dominican 2%
- Common ancestry
- Hispanic 2% Lithuanian 1% Slovak 1%
- Foreign-born
- 24% · Canada, China, Jamaica
- Languages at home
- 62% English-only · Spanish 28% French/Haitian/Cajun 3% Other Indo-European 2%
Political lean MEDSL · Hillsborough
- 2024 margin
- Toss-up / Even · D 47.8% · R 50.9% · Other 1.3%
- 2008→2024 swing
- -10.2pp toward R · 2008: 7.1pp · 2024: -3.1pp
- All cycles
- 2024: R+3.1 2020: D+6.9 2016: D+6.8 2012: D+6.7 2008: D+7.1
Not yet ingested
- Civics
- —
Market trends
- HPI YoY
- ▼ -329.59%
- Current HPI
- 367.4057
- Rent YoY
- ▼ -0.69%
- Metro
- Tampa-St. Petersburg-Clearwater, FL
- State GDP YoY
- ▲ 3.28%
- F500 in state
- 36
Industry mix (Fortune 500 HQ in FL)
| Industry | F500 HQs | Revenue |
|---|---|---|
| Industrial Technology | 2 | $29B |
|
||
| Insurance | 2 | $17B |
|
||
| Retail | 1 | $60B |
|
||
| Technology Distribution | 1 | $58B |
|
||
| Homebuilding | 1 | $35B |
|
||
| Technology Manufacturing | 1 | $35B |
|
||
Price history
+3718.6% since first listed3 events — show timeline
- 2026-05-12 Listed $80,000 FSBO.com
- 2026-02-01 Rental Removed $2,095 STELLARMLS
- 2025-09-10 Listed for Rent $2,095 STELLARMLS
Cash-flow waterfall
monthlySold comps — $/sqft
last 12 mo · ≤1 miLoading sold comps…