 5-Plex
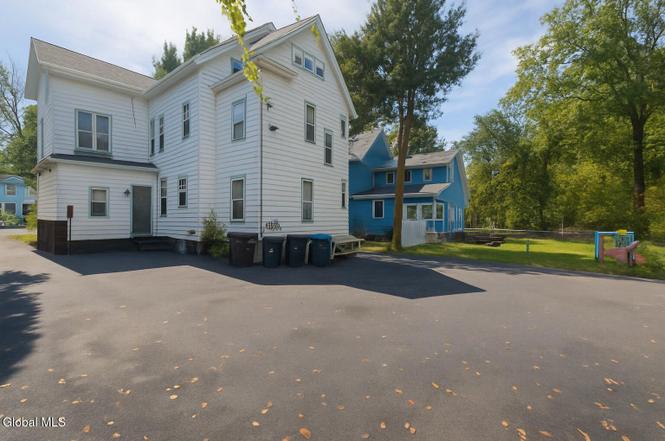
493 Glen St · Glens Falls, NY
Flood risk No data
- FEMA flood zone
- —
- Chance of flooding over 30 yrs
- —
- Est. flood insurance / yr
- —
Fire risk No data
- Est. fire insurance / yr
- —
Heat risk No data
- Hot days now (above threshold)
- —
- Hot days in 30 yrs
- —
Wind risk No data
- Chance of severe wind over 30 yrs
- —
Air-quality risk No data
- Unhealthy air days now
- —
- Unhealthy air days in 30 yrs
- —
Risk factors via First Street. Map © Google.
Why this score? — see what drove the B grade
The composite is a weighted blend of 9 inputs, each scored 0–100. Each bar is that input's sub-score; the figure is the points it added to the 100-point composite (weight × sub-score).
- Cash flow +30.0/30.0
- 1% rule +10.0/10.0
- DSCR +10.0/10.0
- ARV discount +7.5/15.0
- Livability +4.2/5.0
- Schools +4.1/10.0
- Rent growth +2.5/5.0
- Condition / age +2.5/5.0
- Appreciation +0.0/10.0
$579,900
🖨 Deal sheet 📄 Offer letter ✓ Due diligence
Multi-family units
County records classify this as Multi-Family (5+ Unit). Listing-text estimate: 5 units. confirmed
5+ unit building — per-unit beds/baths from public records are typically unavailable; the breakdown below (if shown) is an estimate from the listing text.
Listing remarks MLS
Investment opportunity! 5 Unit building comprised of 1 Bedroom/2 Bedroom/ 3 Bedroom and a studio. It's not often you find such opportunity with potential numbers that work in an owner/occupied or total investment property. Current rents are lower than market value, there's more room to make more! Check it out today!
Key facts
- Bonus office space
- 0.28 acre lot
- 8 parking spots
Tags
Neighborhood map
What this means for you Summary
Snapshot
- This is a 5 × 9-bed/6.0-bath units multifamily listed at $580k.
Deal economics
- At list price, monthly cash flow is $4k ($53k/yr) — positive. Per door: $888/mo.
- The deal already cash-flows at list — no discount required.
- Meets the 1% rule at list price ($11k rent vs $580k).
- Recommended offer: $528k (9.0% below list) — sets the bar for market timing.
- Cap rate 15.5% vs local median 4.8% in Glens Falls — top-decile yield for the area; either an underpriced asset or a hidden risk that comps aren't pricing in. Stress-test before assuming the spread holds.
Location & tenants
- Location reads 83/100 on livability (#60 in NY, #894 nationally) — a professional / high-income tenant draw. Strengths: crime A+, amenities A+, housing A+.
- Glens Falls City School District (urban): math 44% / reading 53% proficiency, ranked #416 of 590 in NY (top 70%) — families likely to look elsewhere, expect single-tenant / working-renter base with shorter leases.
- Zoned schools: Glens Falls Senior High School (math 98% / reading 64%, grade A, #485 of 1,100 statewide, top 45%, 601 students, 41% FRL).
- Zoned-school proficiency averages 81% at this address vs 48% district-wide (+32 pts) — the actual schools serving this property are materially stronger than the Glens Falls City School District average implies; a family-tenant draw the district grade alone would hide.
- Market conditions: 56 active listings in the ZIP; 180 units permitted in Warren County in 2024 (40 in 5+ unit buildings).
- At $10,919/mo this rent would consume 194% of the median local household income ($68k/yr) (locally 866% of renters already pay >50% of income on rent) — very limited rent-growth headroom before tenants either downsize or default.
Forward outlook
- Local home prices are declining (-3.0%/yr); year-one equity from $4k of loan paydown is wiped out by about $17k of value loss. Plan a longer hold.
- Warren County population projected at -19% by 2050 — secular population decline; favor cash flow + early exit over multi-decade hold.
- At projected returns (-3.0% appreciation + 3.0% rent growth), your $162k cash investment doubles in ~4 years — after that, you're playing with house money.
Negotiation context
- It's been on market 117 days — a 9% lower offer ($528k) is reasonable based on typical stale-listing flexibility.
- 8 sale attempts since 18y ago; this cycle's ask has dropped $50k (8%) from the opening price — seller is motivated, your offer sets the floor, not the list.
- Current owner paid $480k; 21% above their basis — modest negotiation headroom, anchor on the comps not their cost.
Questions for the listing agent
- It's been on market 117 days. Have you received any prior offers? Is the seller open to a 9% concession, seller financing, or rate buy-down credit?
- Can we see the unit-by-unit rent roll, current vacancy, and any below-market leases? What's the average tenancy length?
- What capital expenditures (roof, boiler, parking lot, exteriors) have been made in the last 5 years, and what's planned in the next 2?
- Built in 1975 — when were the roof, HVAC, electrical panel, plumbing, and water heater last replaced?
- Why hasn't it sold? Are there any deal-killer items the seller is aware of (foundation, flood, title, zoning, code violations)?
- Is there a deadline driving the sale (1031 exchange, divorce, estate, relocation)? That informs how much negotiation room exists.
- What's the average days-on-market for RENTAL listings here right now (not sales)? A rising rental-DOM trend means longer vacancies and softer asking-rent achievability than the comps imply.
- What's the recent tenant-quality profile in this submarket — average credit score on applications, eviction rate, late-payment / NSF rate, and stable-employment percentage? A property-management company in the area should have these aggregated.
- How much new apartment / multifamily construction is in the pipeline within 1–3 miles? Heavy new supply (>2% of stock underway) typically softens rents 12–24 months out; light construction supports rent growth.
Investment metrics
- 1% rule
- 1.88% ✓
- Cap rate
- 15.48%
- Cash-on-cash
- 32.83%
- DSCR
- 2.46
- GRM
- 4.4
CMA / ARV
No comps found within radius.
Projected returns pro-forma
-3.0% appreciation · 3.0% rent growth · sell at horizon
- IRR
- 28.0%
- Equity multiple
- 2.17×
- Total profit
- $189,221
- Equity at exit
- $86,465
- IRR
- 35.5%
- Equity multiple
- 4.27×
- Total profit
- $530,180
- Equity at exit
- $50,139
Cash invested: $162,372 (down + closing). Projections, not guarantees.
Landlord ↔ Tenant lean methodology
- Overall (STATE)
- 15 Strongly Tenant-Friendly
- State New York
- 15 Strongly Tenant-Friendly · D+10
- County
- — inherits STATE
- City
- — inherits STATE
ZIP-level market 12801
- Home prices YoY
- -13.7%
- Active inventory
- 56
- Price-to-rent
- 22.1×
Monthly cashflow live
- Estimated rent
- $10,919 medium interval (Pro) →
- Mortgage (P&I)
- −$3,041
- Tax from tax record
- −$901 /mo · $10,815/yr
- Insurance
- −$242
- HOA
- −$0
- Vacancy / Maint / Mgmt
- −$2,293
- Net cashflow
- $4,442
Break-even live
5-unit breakdown (identical units grouped — click to expand)
| Units | Beds | Baths | Est. rent |
|---|---|---|---|
| 5× units | 9 | 6 | $10,920 |
| #1 | 9 | 6 | $2,184 |
| #2 | 9 | 6 | $2,184 |
| #3 | 9 | 6 | $2,184 |
| #4 | 9 | 6 | $2,184 |
| #5 | 9 | 6 | $2,184 |
| Total (5 units) | $10,919 | ||
UW: 25.0% down · 7.5% · 30yr · 1.5% tax · 5.0% vac · 8.0% maint · 8.0% mgmt
Financing live
Cash to close
- Down payment
- $144,975
- Closing costs
- $17,397
- Reserves months
- —
- Total cash needed
- —
Loan-product check · same deal, 3 products live
Conventional
25% down · 7.5% · 30yr
- Down + closing
- —
- Monthly P&I
- —
- Monthly cashflow
- —
- DSCR
- —
- Eligible?
- —
Personal DTI + credit; lowest rate.
DSCR
20% down · 8.5% · 30yr
- Down + closing
- —
- Monthly P&I
- —
- Monthly cashflow
- —
- DSCR
- —
- Eligible?
- —
No personal income docs; deal must DSCR.
Hard money
10% down · 12.0% · 12mo
- Down + closing
- —
- Monthly P&I
- —
- Monthly cashflow
- —
- DSCR
- —
- Eligible?
- —
Short-term bridge; refi at stabilization.
Listing history 19 events
-
2026-01-21status Pending
-
2025-11-03price $579,900
-
2025-09-26$629,900 Active
-
2022-12-14soldstatus $480,000
-
2022-08-17historical Contingent 317-char remark
Show marketing remark (317 chars)
Investment opportunity! 5 Unit building comprised of 1 Bedroom/2 Bedroom/ 3 Bedroom and a studio. It's not often you find such opportunity with potential numbers that work in an owner/occupied or total investment property. Current rents are lower than market value, there's more room to make more! Check it out today!
-
2022-07-13$458,000 Active 317-char remark
Show marketing remark (317 chars)
Investment opportunity! 5 Unit building comprised of 1 Bedroom/2 Bedroom/ 3 Bedroom and a studio. It's not often you find such opportunity with potential numbers that work in an owner/occupied or total investment property. Current rents are lower than market value, there's more room to make more! Check it out today!
-
2019-03-01historical
-
2016-02-01historical
-
2016-01-31historical
-
2015-07-01$279,900
-
2015-07-01historical
-
2015-07-01$279,900
-
2015-02-16$279,900
-
2015-02-16$279,900
-
2011-09-23soldstatus $221,000
-
2011-09-16soldstatus $221,000
-
2010-02-16$245,000
-
2009-09-18historical
-
2008-12-18$325,000
ⓘ Source: listings_history table (triggers on properties + properties_extension) + one-shot
backfill from property_details.listing_events for pre-trigger history.
Tax reassessment forecast NY · Partial reset (capped growth)
- Current annual tax
- $10,815 · $901/mo
- Projected year-2 tax
- $10,815 · $901/mo
- Expected delta
- $0/yr ($0/mo · 0.0%)
ⓘ Screening estimate from a state-policy table — verify with the county assessor before closing.
Nearby sold comps map
Loading sold comps map…
Walkable amenities ~0.75 mi
Loading nearby amenities…
Taxation est. · year 1
- Rental income
- $131,028
- − Mortgage interest
- −$32,483
- − Property taxes
- −$10,815
- − Insurance
- −$2,900
- − Repairs & maintenance
- −$10,482
- − Management
- −$10,482
- − Depreciation
- −$16,870
- Taxable income
- $46,995
- Est. tax owed @ 24.0%
- −$11,279
- After-tax cash flow
- $42,026/yr
For passive investors: Depreciation is non-cash, so a rental often shows a tax loss while cash-flowing — sheltering income. Rental losses are passive: they offset passive income freely, and up to $25,000/yr can offset ordinary (W-2) income if you actively participate and your MAGI is under $100k (phasing out to $0 by $150k); unused losses carry forward. On sale, claimed depreciation is recaptured at up to 25%, and gains may owe capital-gains tax (a 1031 exchange can defer both). Figures are a year-1 estimate at your 24.0% rate — not tax advice; consult a CPA.
Schools (NCES district)
- District
- Glens Falls City School District
- NCES district ID
- 3612240
- Math proficiency
- 44% ▼ -8.00%
- Reading proficiency
- 53% ▲ 6.00%
- Median HH income
- $48,216
- Composite
- 41.34/100
- National rank
- #3499
- State rank
- #416 of 590 in NY
Livability — Glens Falls
- Score
- 83/100
- State rank
- #60
- US rank
- #894
Category grades
Schools grade is shown separately in the Schools card above.
Census & demographics
- Census place
- Glens Falls, NY
- County
- Warren County · 14,628 people
- City population
- 14,628
- Metro
- Glens Falls, NY
- Population (ZIP)
- 14,628
- Household income
- $67,577
- Rent vs Own
- Severe rent burden
- 866.0
Population outlook (Warren County) Hauer SSP2
- Today (2025)
- 62,372 people
- By 2030
- 60,491 · -3.0%
- By 2040
- 55,616 · -10.8%
- By 2050
- 50,437 · -19.1%
- By 2075
- 40,843 · -34.5%
- By 2100
- 31,159 · -50.0%
Race, ethnicity, and origin ACS 2023
- Neighborhood character
- Predominantly White (90%)
- Race & ethnicity
- White 90% Two or more races 6% Hispanic / Latino 3% Black 2%
- Common ancestry
- Lithuanian 9% Romanian 5% Slovak 5%
- Foreign-born
- 3% · Canada, Dominican Republic
- Languages at home
- 97% English-only · Spanish 1% German/W. Germanic 1%
Political lean MEDSL · Warren
- 2024 margin
- Toss-up / Even · D 47.9% · R 52.1%
- 2008→2024 swing
- -6.9pp toward R · 2008: 2.6pp · 2024: -4.2pp
- All cycles
- 2024: R+4.2 2020: R+0.2 2016: R+10.6 2012: D+2.1 2008: D+2.6
Not yet ingested
- Civics
- —
Market trends
- HPI YoY
- ▼ -52.28%
- Current HPI
- 330.581
- Rent YoY
- —
- Metro
- Glens Falls, NY
- State GDP YoY
- ▲ 2.60%
- F500 in state
- 92
Industry mix (Fortune 500 HQ in NY)
| Industry | F500 HQs | Revenue |
|---|---|---|
| Financial Services | 10 | $950B |
|
||
| Consumer Goods | 9 | $162B |
|
||
| Insurance | 4 | $225B |
|
||
| Telecommunications | 2 | $144B |
|
||
| Pharmaceuticals | 2 | $112B |
|
||
| Media / Entertainment | 2 | $69B |
|
||
Price history
+78.4% since first listed19 events — show timeline
- 2026-01-21 Pending — Global MLS
- 2025-11-03 Price Changed $579,900 Global MLS
- 2025-09-26 Listed $629,900 Global MLS
- 2022-12-14 Sold (Public Records) $480,000 Public Records
- 2022-08-17 Contingent — Global MLS
- 2022-07-13 Listed $458,000 Global MLS
- 2019-03-01 Listing Removed — Global MLS
- 2016-02-01 Listing Removed — Global MLS
- 2016-01-31 Listing Removed — Global MLS
- 2015-07-01 Listed $279,900 Global MLS
- 2015-07-01 Listing Removed — Global MLS
- 2015-07-01 Listed $279,900 Global MLS
- 2015-02-16 Listed $279,900 Global MLS
- 2015-02-16 Listed $279,900 Global MLS
- 2011-09-23 Sold (Public Records) $221,000 Public Records
- 2011-09-16 Sold (MLS) $221,000 Global MLS
- 2010-02-16 Listed $245,000 Global MLS
- 2009-09-18 Listing Removed — Global MLS
- 2008-12-18 Listed $325,000 Global MLS
Property tax history
+9.1%/yrLatest (2025): $10,815 · +1.0% YoY. Source: county tax records.
Cash-flow waterfall
monthlySold comps — $/sqft
last 12 mo · ≤1 miLoading sold comps…