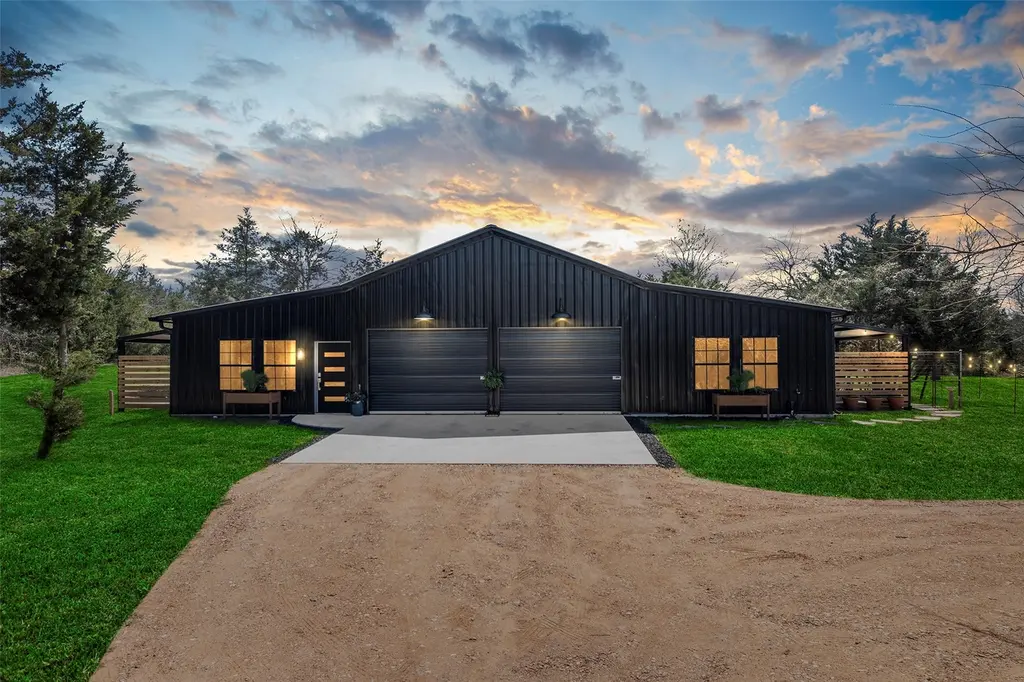
7278 Chadwick Hogan Rd · Brenham, TX
Flood risk 1/10 · Minimal
- FEMA flood zone
- X (unshaded)
- Chance of flooding over 30 yrs
- 0.0%
- Est. flood insurance / yr
- $507 – $1,088
Fire risk 7/10 · Major
- Est. fire insurance / yr
- $1,222 – $2,270
Heat risk 8/10 · Major
- Hot days now (above 111°F)
- 6 days/yr
- Hot days in 30 yrs
- 18 days/yr
Wind risk 8/10 · Major
- Chance of severe wind over 30 yrs
- 99.0%
Air-quality risk 1/10 · Minimal
- Unhealthy air days now
- 0 days/yr
- Unhealthy air days in 30 yrs
- 0 days/yr
Risk factors via First Street. Map © Google.
Why this score? — see what drove the F grade
The composite is a weighted blend of 9 inputs, each scored 0–100. Each bar is that input's sub-score; the figure is the points it added to the 100-point composite (weight × sub-score).
- Appreciation +10.0/10.0
- ARV discount +7.5/15.0
- Schools +3.9/10.0
- Livability +3.8/5.0
- Rent growth +2.5/5.0
- Condition / age +2.5/5.0
- Cash flow +0.5/30.0
- 1% rule +0.0/10.0
- DSCR +0.0/10.0
$675,000
🖨 Deal sheet 📄 Offer letter ✓ Due diligence
Listing remarks MLS
You will love this custom built modern Barndominium on 3.5 acres in gorgeous Chappell Hill. Home is nestled on a picturesque lot w/trees, rolling landscape & small pond offering the perfect country setting. Built in 2025, it offers 3 beds, 2.5 baths, an office-flex space along w/an open concept living/dining & 13' ceilings. Kitchen is complete w/soft close cabinets, pot drawers, quartz counters & backsplash w/extra lg island that serves as a table for 4. Separate primary suite has full bath, double sinks & shower plus large walk in closet. 1/2 bath in 2nd bedroom makes a great mother-in-law suite or guest room. Wide LVP floors, spray-in foam, custom HVAC system & many other upgrades. Oversized garage w/17' ceilings can easily be converted to extra living space. Best views are from the (2) 32x10 covered patios. Perfect for morning coffee and entertaining friends/family. See the adjacent 1.7 acre lot offered for sale. MLS#40280182. Deed restrictions & survey of subdivided plat in docs
Key facts
- Small pond
- Picturesque lot
- Soft close cabinets
Tags
Neighborhood map
What this means for you Summary
Snapshot
- This is a 3-bed/2.5-bath single-family listed at $675k.
Deal economics
- At list price, monthly cash flow is $-3k ($-35k/yr) — negative.
- To cash-flow at today's rent, offer at most $158k (76.6% below list).
- To meet the 1% rule (rent ≥ 1% of price), the offer needs to be $143k (78.9% below list).
- Recommended offer: $143k (78.9% below list) — sets the bar for 1% rule.
- Cap rate 1.1% vs local median 2.7% in Brenham — below-typical yield; the buyer is paying a premium for something (appreciation thesis, condition, location) that the cap rate doesn't capture.
Location & tenants
- Location reads 75/100 on livability (#136 in TX, #3,978 nationally) — a middle-class / working-renter tenant base. Strengths: cost of living A+, housing A+, amenities A; Watch: schools C-, employment C-, crime F.
- Brenham ISD (town): math 50% / reading 40% proficiency, ranked #263 of 826 in TX (top 32%) — families likely to look elsewhere, expect single-tenant / working-renter base with shorter leases.
- Market conditions: 100 active listings in the ZIP; 111 units permitted in Washington County in 2024 (0 in 5+ unit buildings).
Forward outlook
- In year one you build about $72k of equity ($5k loan paydown + $68k appreciation (10.0% local appreciation)).
- Washington County population projected at +16% by 2050 — long-run rental-demand tailwind backs the buy-and-hold thesis.
- By year 2, paydown + projected appreciation supports a ~$116k cash-out refi (75% LTV) — recoverable capital for the next deal without selling this one.
Negotiation context
- It's been on market 64 days — a 6% lower offer ($634k) is reasonable based on typical stale-listing flexibility.
- 8 sale attempts since 3y ago with the ask held roughly flat each time — persistent listings suggest the price (not the market) is what's stuck; bring a comps-based counter.
Risks & watch-outs
- Climate carrying-cost: severe wind risk, 99% chance of damaging wind over 30y; major wildfire risk; extreme-heat days projected 6→18/yr by 2055 (HVAC capex compounding) — expect insurance premiums to compound above CPI over the hold.
Questions for the listing agent
- What do current leases actually rent for vs. the listed asking? Can we see a recent rent roll and the last 12 months of T-12 income?
- It's been on market 64 days. Have you received any prior offers? Is the seller open to a 79% concession, seller financing, or rate buy-down credit?
- Why hasn't it sold? Are there any deal-killer items the seller is aware of (foundation, flood, title, zoning, code violations)?
- Is there a deadline driving the sale (1031 exchange, divorce, estate, relocation)? That informs how much negotiation room exists.
- Crime grade is F in this area — have there been break-ins, vandalism, or insurance claims at this property in the last 3 years? What carrier currently insures it and at what premium?
- The area grade is low — what's the realistic commute time and amenity access for the typical tenant pool here? Any planned neighborhood developments (good or bad) we should know about?
- What's the average days-on-market for RENTAL listings here right now (not sales)? A rising rental-DOM trend means longer vacancies and softer asking-rent achievability than the comps imply.
- What's the recent tenant-quality profile in this submarket — average credit score on applications, eviction rate, late-payment / NSF rate, and stable-employment percentage? A property-management company in the area should have these aggregated.
- How much new for-sale + rental construction is in the pipeline within 1–3 miles? Heavy new supply typically softens prices + rents 12–24 months out; constrained supply supports both.
Investment metrics
- 1% rule
- 0.21% ✗
- Cap rate
- 1.09%
- Cash-on-cash
- -18.59%
- DSCR
- 0.17
- GRM
- 39.4
CMA / ARV
- ARV (median comp)
- $1,475,000
- List price
- $675,000
- Delta
- -54.24%
- Verdict
- UNDERPRICED
- Comps
- 1 within 2.0 mi
Projected returns pro-forma
10.0% appreciation · 3.0% rent growth · sell at horizon
- IRR
- 11.5%
- Equity multiple
- 1.96×
- Total profit
- $180,832
- Equity at exit
- $608,093
- IRR
- 12.2%
- Equity multiple
- 4.59×
- Total profit
- $678,431
- Equity at exit
- $1,311,377
Cash invested: $189,000 (down + closing). Projections, not guarantees.
Landlord ↔ Tenant lean methodology
- Overall (STATE)
- 87 Strongly Landlord-Friendly
- State Texas
- 87 Strongly Landlord-Friendly · R+5
- County
- — inherits STATE
- City
- — inherits STATE
ZIP-level market 77426
- Home prices YoY
- 3.9%
- Active inventory
- 100
- Price-to-rent
- 39.4×
Monthly cashflow live
- Estimated rent
- $1,427 medium interval (Pro) →
- Mortgage (P&I)
- −$3,540
- Tax from tax record
- −$234 /mo · $2,806/yr
- Insurance
- −$281
- HOA
- −$0
- Vacancy / Maint / Mgmt
- −$300
- Net cashflow
- $-2,927
Break-even live
UW: 25.0% down · 7.5% · 30yr · 1.5% tax · 5.0% vac · 8.0% maint · 8.0% mgmt
Financing live
Cash to close
- Down payment
- $168,750
- Closing costs
- $20,250
- Reserves months
- —
- Total cash needed
- —
Loan-product check · same deal, 3 products live
Conventional
25% down · 7.5% · 30yr
- Down + closing
- —
- Monthly P&I
- —
- Monthly cashflow
- —
- DSCR
- —
- Eligible?
- —
Personal DTI + credit; lowest rate.
DSCR
20% down · 8.5% · 30yr
- Down + closing
- —
- Monthly P&I
- —
- Monthly cashflow
- —
- DSCR
- —
- Eligible?
- —
No personal income docs; deal must DSCR.
Hard money
10% down · 12.0% · 12mo
- Down + closing
- —
- Monthly P&I
- —
- Monthly cashflow
- —
- DSCR
- —
- Eligible?
- —
Short-term bridge; refi at stabilization.
Listing history 32 events
-
2026-06-19days on market $675,000 Active 64 DOM
-
2026-06-18days on market $675,000 Active 63 DOM
-
2026-06-17days on market $675,000 Active 62 DOM
-
2026-06-16days on market $675,000 Active 61 DOM
-
2026-06-15days on market $675,000 Active 60 DOM
-
2026-06-14days on market $675,000 Active 58 DOM
-
2026-06-12days on market $675,000 Active 57 DOM
-
2026-06-09days on market $675,000 Active 54 DOM
-
2026-06-08days on market $675,000 Active 53 DOM
-
2026-06-07days on market $675,000 Active 52 DOM
-
2026-06-02days on market $675,000 Active 47 DOM
-
2026-06-01days on market $675,000 Active 46 DOM
-
2026-05-31days on market $675,000 Active 45 DOM
-
2026-05-30days on market $675,000 Active 44 DOM
-
2026-04-16historical
Show marketing remark (1024 chars)
You will love this custom built modern Barndominium on 3.5 acres in gorgeous Chappell Hill. Home is nestled on a picturesque lot w/trees, rolling landscape & small pond offering the perfect country setting. Built in 2025, it offers 3 beds, 2.5 baths, an office-flex space along w/an open concept living/dining & 13' ceilings. Kitchen is complete w/soft close cabinets, pot drawers, quartz counters & backsplash w/extra lg island that serves as a table for 4. Separate primary suite has full bath, double sinks & shower plus large walk in closet. 1/2 bath in 2nd bedroom makes a great mother-in-law suite or guest room. Wide LVP floors, spray-in foam, custom HVAC system & many other upgrades. Oversized garage w/17' ceilings can easily be converted to extra living space. Best views are from the (2) 32x10 covered patios. Perfect for morning coffee and entertaining friends/family. See the adjacent 1.7 acre lot offered for sale. MLS#40280182. Deed restrictions & survey of subdivided plat in docs
-
2026-04-16$675,000 Active 1024-char remark
Show marketing remark (1024 chars)
You will love this custom built modern Barndominium on 3.5 acres in gorgeous Chappell Hill. Home is nestled on a picturesque lot w/trees, rolling landscape & small pond offering the perfect country setting. Built in 2025, it offers 3 beds, 2.5 baths, an office-flex space along w/an open concept living/dining & 13' ceilings. Kitchen is complete w/soft close cabinets, pot drawers, quartz counters & backsplash w/extra lg island that serves as a table for 4. Separate primary suite has full bath, double sinks & shower plus large walk in closet. 1/2 bath in 2nd bedroom makes a great mother-in-law suite or guest room. Wide LVP floors, spray-in foam, custom HVAC system & many other upgrades. Oversized garage w/17' ceilings can easily be converted to extra living space. Best views are from the (2) 32x10 covered patios. Perfect for morning coffee and entertaining friends/family. See the adjacent 1.7 acre lot offered for sale. MLS#40280182. Deed restrictions & survey of subdivided plat in docs
-
2026-03-20$695,000 Active
-
2025-08-17historical
-
2025-03-18price $399,900
-
2025-02-17$425,000 Active
-
2024-04-26historical
-
2023-12-15$349,900 Active
-
2023-12-10historical
-
2023-10-26$399,900 Active
-
2023-10-06historical
-
2023-09-20status Active
-
2023-09-18price $549,900
-
2023-08-30historical
-
2023-08-04price $670,000
-
2023-07-23price $599,000
-
2023-07-09Active
-
2023-06-16$695,000 Active
ⓘ Source: listings_history table (triggers on properties + properties_extension) + one-shot
backfill from property_details.listing_events for pre-trigger history.
Tax reassessment forecast TX · Resets to sale price
- Current annual tax
- $2,806 · $234/mo
- Projected year-2 tax
- $12,352 · $1,029/mo
- Expected delta
- +$9,547/yr (+$796/mo · 340.2%)
ⓘ Screening estimate from a state-policy table — verify with the county assessor before closing.
Climate risk First Street
- Flood 1/10 Low FEMA zone X (unshaded) · 0% chance over 30 yrs
- Wildfire 7/10 Severe
- Heat 8/10 Severe 6 d/yr ≥111°F today · 18 d/yr by 30 yrs out
- Wind 8/10 Severe 99% chance of damaging wind over 30 yrs
- Air quality 1/10 Low 0 unhealthy d/yr today · 0 by 30 yrs out
Nearby sold comps map
Loading sold comps map…
Walkable amenities ~0.75 mi
Loading nearby amenities…
Taxation est. · year 1
- Rental income
- $17,128
- − Mortgage interest
- −$37,810
- − Property taxes
- −$2,806
- − Insurance
- −$3,375
- − Repairs & maintenance
- −$1,370
- − Management
- −$1,370
- − Depreciation
- −$19,636
- Taxable loss
- −$49,240
- Est. tax savings @ 24.0%
- +$11,818
- After-tax cash flow
- $-23,309/yr
For passive investors: Depreciation is non-cash, so a rental often shows a tax loss while cash-flowing — sheltering income. Rental losses are passive: they offset passive income freely, and up to $25,000/yr can offset ordinary (W-2) income if you actively participate and your MAGI is under $100k (phasing out to $0 by $150k); unused losses carry forward. On sale, claimed depreciation is recaptured at up to 25%, and gains may owe capital-gains tax (a 1031 exchange can defer both). Figures are a year-1 estimate at your 24.0% rate — not tax advice; consult a CPA.
Schools (NCES district)
- District
- Brenham ISD
- NCES district ID
- 4811280
- Math proficiency
- 50% ▼ -4.00%
- Reading proficiency
- 40% ▼ -4.00%
- Median HH income
- $48,090
- Composite
- 38.51/100
- National rank
- #4177
- State rank
- #263 of 826 in TX
Livability — Brenham
- Score
- 75/100
- State rank
- #136
- US rank
- #3978
Category grades
Schools grade is shown separately in the Schools card above.
Census & demographics
- City population
- 29,498
- Population (ZIP)
- 2,193
Population outlook (Washington County) Hauer SSP2
- Today (2025)
- 37,557 people
- By 2030
- 38,789 · +3.3%
- By 2040
- 41,305 · +10.0%
- By 2050
- 43,687 · +16.3%
- By 2075
- 50,242 · +33.8%
- By 2100
- 53,235 · +41.7%
Race, ethnicity, and origin ACS 2023
- Neighborhood character
- Diverse neighborhood (Simpson 0.56)
- Race & ethnicity
- White 61% Hispanic / Latino 24% Two or more races 11% Black 7%
- Hispanic origin (detail)
- Mexican 22%
- Common ancestry
- Romanian 9% Iranian 1% Slovak 1%
- Foreign-born
- 14% · Canada
- Languages at home
- 79% English-only · Spanish 20% Russian/Polish/Slavic 1%
Political lean MEDSL · Washington
- 2024 margin
- Solid R (+54.7) · D 22.3% · R 77.0%
- 2008→2024 swing
- -12.0pp toward R · 2008: -42.7pp · 2024: -54.7pp
- All cycles
- 2024: R+54.7 2020: R+49.9 2016: R+51.3 2012: R+52.0 2008: R+42.7
Not yet ingested
- Civics
- —
Market trends
- HPI YoY
- ▲ 10.11%
- Current HPI
- 271.5139
- Rent YoY
- —
- Metro
- —
- State GDP YoY
- ▲ 3.95%
- F500 in state
- 110
Industry mix (Fortune 500 HQ in TX)
| Industry | F500 HQs | Revenue |
|---|---|---|
| Energy | 16 | $1,198B |
|
||
| Technology | 5 | $198B |
|
||
| Engineering / Construction | 4 | $72B |
|
||
| Energy Services | 3 | $60B |
|
||
| Utilities | 3 | $41B |
|
||
| Healthcare | 2 | $330B |
|
||
Price history
-2.9% since first listed18 events — show timeline
- 2026-04-16 Listed $675,000 HARMLS
- 2026-04-16 Listing Removed — HARMLS
- 2026-03-20 Listed $695,000 HARMLS
- 2025-08-17 Listing Removed — HARMLS
- 2025-03-18 Price Changed $399,900 HARMLS
- 2025-02-17 Listed $425,000 HARMLS
- 2024-04-26 Listing Removed — HARMLS
- 2023-12-15 Listed $349,900 HARMLS
- 2023-12-10 Listing Removed — HARMLS
- 2023-10-26 Listed $399,900 HARMLS
- 2023-10-06 Listing Removed — HARMLS
- 2023-09-20 Relisted — HARMLS
- 2023-09-18 Price Changed $549,900 HARMLS
- 2023-08-30 Listing Removed — HARMLS
- 2023-08-04 Price Changed $670,000 HARMLS
- 2023-07-23 Price Changed $599,000 HARMLS
- 2023-07-09 Listed — Unlock MLS
- 2023-06-16 Listed $695,000 HARMLS
Property tax history
+58.9%/yrLatest (2023): $2,806 · +58.9% YoY. Source: county tax records.
Cash-flow waterfall
monthlySold comps — $/sqft
last 12 mo · ≤1 miLoading sold comps…