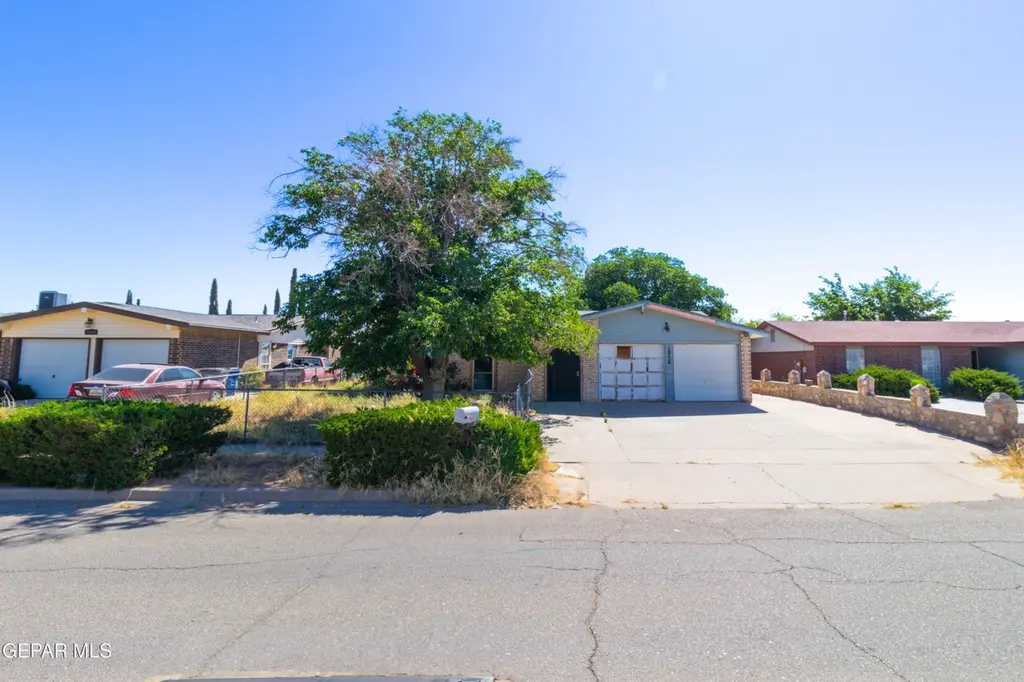
10756 Fort Worth St · El Paso, TX
Flood risk 1/10 · Minimal
- FEMA flood zone
- X
- Chance of flooding over 30 yrs
- 0.0%
- Est. flood insurance / yr
- $507 – $1,088
Fire risk 3/10 · Minor
- Est. fire insurance / yr
- $1,222 – $2,270
Heat risk 6/10 · Moderate
- Hot days now (above 100°F)
- 7 days/yr
- Hot days in 30 yrs
- 27 days/yr
Wind risk 1/10 · Minimal
- Chance of severe wind over 30 yrs
- —
Air-quality risk 3/10 · Minor
- Unhealthy air days now
- 2 days/yr
- Unhealthy air days in 30 yrs
- 2 days/yr
Risk factors via First Street. Map © Google.
Why this score? — see what drove the C grade
The composite is a weighted blend of 9 inputs, each scored 0–100. Each bar is that input's sub-score; the figure is the points it added to the 100-point composite (weight × sub-score).
- Cash flow +23.4/30.0
- 1% rule +8.2/10.0
- DSCR +7.5/10.0
- ARV discount +7.5/15.0
- Livability +4.0/5.0
- Rent growth +3.6/5.0
- Schools +2.7/10.0
- Condition / age +2.5/5.0
- Appreciation +0.0/10.0
$135,000
🖨 Deal sheet 📄 Offer letter ✓ Due diligence
Listing remarks
Great opportunity to bring your vision to life! This fixer-upper is full of potential and ready for a complete remodel. This property can truly shine. Featuring a converted garage that serves as a 4th bedroom, the layout offers flexibility for growing families. Ideal as a starter home for buyers looking to customize their space or for investors seeking their next project. Don't miss the chance to transform this property into something special!
Key facts
- Converted garage
- 6,500 sq ft lot
- Garage
Tags
Neighborhood map
What this means for you Summary
Snapshot
- This is a 4-bed/2.0-bath single-family listed at $135k.
Deal economics
- At list price, monthly cash flow is $251 ($3k/yr) — positive.
- The deal already cash-flows at list — no discount required.
- Meets the 1% rule at list price ($2k rent vs $135k).
Location & tenants
- Location reads 81/100 on livability (#23 in TX, #1,375 nationally) — a professional / high-income tenant draw. Strengths: commute A+, cost of living A+, housing A+; Watch: employment D+.
- El Paso ISD (urban): math 27% / reading 37% proficiency, ranked #591 of 826 in TX (top 72%) — families likely to look elsewhere, expect single-tenant / working-renter base with shorter leases; 65% free/reduced lunch — lower-income household profile, screen leases tightly.
- Zoned schools: Dr Joseph Torres El (math 17% / reading 32%, grade F, #3,052 of 4,322 statewide, top 74%, 604 students, 85% FRL); Charles Middle (math 25% / reading 34%, grade F, #1,077 of 1,662 statewide, top 66%, 450 students, 84% FRL); Andress H S (math 19% / reading 34%, grade F, #1,228 of 1,632 statewide, top 76%, 1,530 students, 83% FRL) — zoned schools average 84% FRL vs 65% district-wide (19 pts higher); higher-poverty schools than district average — tighter screening recommended.
- Market conditions: Rents rising fast (+4.5%/yr); 241 active listings in the ZIP; 33 comparable units currently listed for rent nearby; rentals at typical pace (median 24d on market — plan ~3-4 weeks tenant-placement turnaround); 2,196 units permitted in El Paso County in 2024 (143 in 5+ unit buildings).
- This rent runs 38% of the median local income ($57k/yr) — at the standard rent-burdened threshold; future hikes will face affordability resistance.
Forward outlook
- Local home prices are declining (-3.0%/yr); year-one equity from $933 of loan paydown is wiped out by about $4k of value loss. Plan a longer hold.
- El Paso County population projected at +10% by 2050 — modest demand growth; plan on rents tracking national, not racing it.
- At projected returns (-3.0% appreciation + 4.5% rent growth), your $38k cash investment doubles in ~10 years — after that, you're playing with house money.
Negotiation context
- Only 8 days on market — expect competitive offers; lowballing is unlikely to land.
- Current owner paid $54k; list at $135k implies a 152% gain — meaningful room to come down on a strong offer.
Risks & watch-outs
- Watch-outs: property tax is 3.5% of price.
- Climate carrying-cost: extreme-heat days projected 7→27/yr by 2055 (HVAC capex compounding) — expect insurance premiums to compound above CPI over the hold.
Questions for the listing agent
- Built in 1977 — when were the roof, HVAC, electrical panel, plumbing, and water heater last replaced?
- Property tax is high relative to price — has the assessment been appealed recently, and will the sale trigger a re-assessment?
- Is there a deadline driving the sale (1031 exchange, divorce, estate, relocation)? That informs how much negotiation room exists.
- Schools are B-rated — typically a magnet for longer-tenancy family renters. What's the average tenant stay here, and is there a school-zone premium baked into asking?
- What's the average days-on-market for RENTAL listings here right now (not sales)? A rising rental-DOM trend means longer vacancies and softer asking-rent achievability than the comps imply.
- What's the recent tenant-quality profile in this submarket — average credit score on applications, eviction rate, late-payment / NSF rate, and stable-employment percentage? A property-management company in the area should have these aggregated.
- How much new for-sale + rental construction is in the pipeline within 1–3 miles? Heavy new supply typically softens prices + rents 12–24 months out; constrained supply supports both.
Investment metrics
- 1% rule
- 1.32% ✓
- Cap rate
- 8.52%
- Cash-on-cash
- 7.96%
- DSCR
- 1.35
- GRM
- 6.3
CMA / ARV
No comps found within radius.
Projected returns pro-forma
-3.0% appreciation · 4.5% rent growth · sell at horizon
- IRR
- -2.1%
- Equity multiple
- 0.92×
- Total profit
- $-3,012
- Equity at exit
- $20,129
- IRR
- 9.5%
- Equity multiple
- 1.80×
- Total profit
- $30,184
- Equity at exit
- $11,672
Cash invested: $37,800 (down + closing). Projections, not guarantees.
Landlord ↔ Tenant lean methodology
- Overall (STATE)
- 87 Strongly Landlord-Friendly
- State Texas
- 87 Strongly Landlord-Friendly · R+5
- County
- — inherits STATE
- City
- — inherits STATE
ZIP-level market 79924
- Home prices YoY
- -13.2%
- Rents YoY
- 4.5%
- Active inventory
- 241
- Price-to-rent
- 6.3×
Monthly cashflow live
- Estimated rent
- $1,786 high interval (Pro) →
- Mortgage (P&I)
- −$708
- Tax from tax record
- −$396 /mo · $4,756/yr
- Insurance
- −$56
- HOA
- −$0
- Vacancy / Maint / Mgmt
- −$375
- Net cashflow
- $251
Break-even live
UW: 25.0% down · 7.5% · 30yr · 1.5% tax · 5.0% vac · 8.0% maint · 8.0% mgmt
Financing live
Cash to close
- Down payment
- $33,750
- Closing costs
- $4,050
- Reserves months
- —
- Total cash needed
- —
Loan-product check · same deal, 3 products live
Conventional
25% down · 7.5% · 30yr
- Down + closing
- —
- Monthly P&I
- —
- Monthly cashflow
- —
- DSCR
- —
- Eligible?
- —
Personal DTI + credit; lowest rate.
DSCR
20% down · 8.5% · 30yr
- Down + closing
- —
- Monthly P&I
- —
- Monthly cashflow
- —
- DSCR
- —
- Eligible?
- —
No personal income docs; deal must DSCR.
Hard money
10% down · 12.0% · 12mo
- Down + closing
- —
- Monthly P&I
- —
- Monthly cashflow
- —
- DSCR
- —
- Eligible?
- —
Short-term bridge; refi at stabilization.
Rent comps 33 comps
| Address | Beds | Baths | Sqft | Rent | $/sqft | DOM | Units | Dist |
|---|---|---|---|---|---|---|---|---|
| 5012 Salem Dr El Paso, TX | 3.0 | 2.0 | 1306 | $1,850 | $1.42 | 23d | 1 | 0.41mi |
| 10521 Gala Pl El Paso, TX | 3.0 | 2.0 | 1346 | $1,485 | $1.10 | 43d | 1 | 0.44mi |
| 10840 Acoma St El Paso, TX | 4.0 | 3.0 | 2156 | $2,500 | $1.16 | 14d | 1 | 0.44mi |
| 10720 McAllen Pl El Paso, TX | 3.0 | 2.0 | 1134 | $1,500 | $1.32 | 23d | 1 | 0.52mi |
| 10899 Northview Dr El Paso, TX | 3.0 | 2.0 | 1532 | $1,500 | $0.98 | 23d | 1 | 0.56mi |
| 10983 Duke Snider Cir El Paso, TX | 4.0 | 2.0 | 1760 | $1,850 | $1.05 | 43d | 1 | 0.56mi |
| 10909 Northview Dr El Paso, TX | 4.0 | 2.0 | 1473 | $1,850 | $1.26 | 14d | 1 | 0.58mi |
| 10948 Casey Stengel Pl El Paso, TX | 3.0 | 2.0 | 1304 | $1,625 | $1.25 | 43d | 1 | 0.59mi |
| 10902 Yogi Berra Dr El Paso, TX | 3.0 | 2.0 | 1167 | $1,300 | $1.11 | 23d | 1 | 0.63mi |
| 10708 Levelland Pl El Paso, TX | 3.0 | 2.0 | 1064 | $1,400 | $1.32 | 43d | 1 | 0.67mi |
| 10708 Levelland Pl El Paso, TX | 3.0 | 2.0 | 1064 | $1,400 | $1.32 | 14d | 1 | 0.67mi |
| 4713 Harvest Ln El Paso, TX | 3.0 | 2.0 | 1220 | $1,475 | $1.21 | 23d | 1 | 0.70mi |
| 10429 Persephone Dr El Paso, TX | 4.0 | 2.0 | 1238 | $1,790 | $1.45 | 3d | 1 | 0.70mi |
| 10901 Joe Dimaggio Cir El Paso, TX | 4.0 | 2.0 | 1400 | $1,750 | $1.25 | 21d | 1 | 0.73mi |
| 10565 Murphy St El Paso, TX | 3.0 | 2.0 | 1914 | $2,000 | $1.04 | 14d | 1 | 0.80mi |
| 4924 Gold Ranch Ave El Paso, TX | 4.0 | 2.5 | 2035 | $2,000 | $0.98 | 14d | 1 | 0.87mi |
| 5640 Rick Husband Dr El Paso, TX | 3.0 | 2.0 | 1500 | $1,595 | $1.06 | 43d | 1 | 0.99mi |
| 11205 Whitey Ford St El Paso, TX | 3.0 | 2.0 | 1286 | $1,450 | $1.13 | 14d | 1 | 0.99mi |
| 5652 Rick Husband Dr El Paso, TX | 3.0 | 2.0 | 1160 | $1,500 | $1.29 | 23d | 1 | 1.02mi |
| 5661 Michael P Anderson Ln El Paso, TX | 3.0 | 2.0 | 1530 | $1,500 | $0.98 | 19d | 1 | 1.02mi |
| 11051 Rockdale St El Paso, TX | 3.0 | 2.0 | 1337 | $1,895 | $1.42 | 23d | 1 | 1.09mi |
| 10800 McCombs St El Paso, TX | 1.0–3.0 | 1.0–2.5 | 1067 | $1,970 | $1.85 | 2d | 12 | 1.12mi |
| 5784 Rick Husband Dr El Paso, TX | 3.0 | 2.0 | 1242 | $1,550 | $1.25 | 23d | 1 | 1.19mi |
| 4600 Loma del Rey Cir El Paso, TX | 3.0–4.0 | 2.0 | 1497 | $5,762 | $3.85 | 2d | 1 | 1.21mi |
| 5845 Wrangler Dr El Paso, TX | 3.0 | 1.5 | 1196 | $1,550 | $1.30 | 23d | 1 | 1.24mi |
| 11201 Redstone Peak Pl El Paso, TX | 3.0 | 2.0 | 1553 | $1,850 | $1.19 | 43d | 1 | 1.24mi |
| 5980 Redstone Rim Dr El Paso, TX | 3.0 | 3.0 | 1665 | $1,795 | $1.08 | 2d | 1 | 1.25mi |
| 11013 Thatcher Pond Ln El Paso, TX | 3.0 | 2.5 | 1432 | $1,550 | $1.08 | 43d | 1 | 1.31mi |
| 10345 Biscaine St El Paso, TX | 4.0 | 2.0 | 1778 | $1,675 | $0.94 | 23d | 1 | 1.31mi |
| 10344 Redwood St El Paso, TX | 3.0 | 2.0 | 1179 | $1,275 | $1.08 | 23d | 1 | 1.32mi |
| 11309 Loma Linda Cir El Paso, TX | 4.0 | 3.0 | 1578 | $1,850 | $1.17 | 43d | 1 | 1.38mi |
| 10288 Lakeview Dr El Paso, TX | 4.0 | 2.0 | 2000 | $1,925 | $0.96 | 43d | 1 | 1.39mi |
| 5741 Arrowhead Dr El Paso, TX | 3.0 | 2.0 | 1080 | $1,175 | $1.09 | 43d | 1 | 1.48mi |
Listing history 4 events
-
2026-04-27status Pending
-
2026-04-17$135,000 Active
-
1981-03-01soldstatus $53,600
-
1978-03-04soldstatus
ⓘ Source: listings_history table (triggers on properties + properties_extension) + one-shot
backfill from property_details.listing_events for pre-trigger history.
Tax reassessment forecast TX · Resets to sale price
- Current annual tax
- $4,756 · $396/mo
- Projected year-2 tax
- $4,756 · $396/mo
- Expected delta
- $0/yr ($0/mo · 0.0%)
ⓘ Screening estimate from a state-policy table — verify with the county assessor before closing.
Climate risk First Street
- Flood 1/10 Low FEMA zone X · 0% chance over 30 yrs
- Wildfire 3/10 Moderate
- Heat 6/10 Major 7 d/yr ≥100°F today · 27 d/yr by 30 yrs out
- Wind 1/10 Low
- Air quality 3/10 Moderate 2 unhealthy d/yr today · 2 by 30 yrs out
Nearby sold comps map
Loading sold comps map…
Walkable amenities ~0.75 mi
Loading nearby amenities…
Taxation est. · year 1
- Rental income
- $21,435
- − Mortgage interest
- −$7,562
- − Property taxes
- −$4,756
- − Insurance
- −$675
- − Repairs & maintenance
- −$1,715
- − Management
- −$1,715
- − Depreciation
- −$3,927
- Taxable income
- $1,085
- Est. tax owed @ 24.0%
- −$260
- After-tax cash flow
- $2,747/yr
For passive investors: Depreciation is non-cash, so a rental often shows a tax loss while cash-flowing — sheltering income. Rental losses are passive: they offset passive income freely, and up to $25,000/yr can offset ordinary (W-2) income if you actively participate and your MAGI is under $100k (phasing out to $0 by $150k); unused losses carry forward. On sale, claimed depreciation is recaptured at up to 25%, and gains may owe capital-gains tax (a 1031 exchange can defer both). Figures are a year-1 estimate at your 24.0% rate — not tax advice; consult a CPA.
Schools (NCES district)
- District
- El Paso ISD
- NCES district ID
- 4818300
- Math proficiency
- 27% ▼ -24.00%
- Reading proficiency
- 37% ▼ -7.00%
- Median HH income
- $38,704
- Composite
- 26.75/100
- National rank
- #7138
- State rank
- #591 of 826 in TX
Livability — El Paso
- Score
- 81/100
- State rank
- #23
- US rank
- #1375
Category grades
Schools grade is shown separately in the Schools card above.
Census & demographics
- Census place
- El Paso, TX
- County
- El Paso County · 761,266 people
- City population
- 630,223
- Metro
- El Paso, TX
- Population (ZIP)
- 60,364
- Household income
- $56,976
- Rent vs Own
- Severe rent burden
- 1903.0
Population outlook (El Paso County) Hauer SSP2
- Today (2025)
- 897,899 people
- By 2030
- 922,694 · +2.8%
- By 2040
- 960,492 · +7.0%
- By 2050
- 982,919 · +9.5%
- By 2075
- 997,266 · +11.1%
- By 2100
- 900,630 · +0.3%
Race, ethnicity, and origin ACS 2023
- Neighborhood character
- Predominantly Hispanic (72%)
- Race & ethnicity
- Hispanic / Latino 72% Two or more races 35% White 16% Black 7% Asian 1% Native American 1%
- Hispanic origin (detail)
- Mexican 66% Puerto Rican 2%
- Common ancestry
- Lithuanian 1% Italian 1% Romanian 1%
- Foreign-born
- 19% · Canada, South Korea
- Languages at home
- 42% English-only · Spanish 56% German/W. Germanic 1% Korean 1%
Political lean MEDSL · El Paso
- 2024 margin
- D (+15.1) · D 57.0% · R 41.8% · Other 1.2%
- 2008→2024 swing
- -17.4pp toward R · 2008: 32.5pp · 2024: 15.1pp
- All cycles
- 2024: D+15.1 2020: D+35.1 2016: D+43.2 2012: D+32.6 2008: D+32.5
Not yet ingested
- Civics
- —
Market trends
- HPI YoY
- ▼ -40.46%
- Current HPI
- 265.8729
- Rent YoY
- ▲ 4.50%
- Metro
- El Paso, TX
- State GDP YoY
- ▲ 3.95%
- F500 in state
- 110
Industry mix (Fortune 500 HQ in TX)
| Industry | F500 HQs | Revenue |
|---|---|---|
| Energy | 16 | $1,198B |
|
||
| Technology | 5 | $198B |
|
||
| Engineering / Construction | 4 | $72B |
|
||
| Energy Services | 3 | $60B |
|
||
| Utilities | 3 | $41B |
|
||
| Healthcare | 2 | $330B |
|
||
Price history
+151.9% since first listed4 events — show timeline
- 2026-04-27 Pending — GEPARMLS
- 2026-04-17 Listed $135,000 GEPARMLS
- 1981-03-01 Sold (Public Records) $53,600 Public Records
- 1978-03-04 Sold (Public Records) — Public Records
Property tax history
+5.8%/yrLatest (2025): $4,756 · +12.0% YoY. Source: county tax records.
Cash-flow waterfall
monthlySold comps — $/sqft
last 12 mo · ≤1 miLoading sold comps…