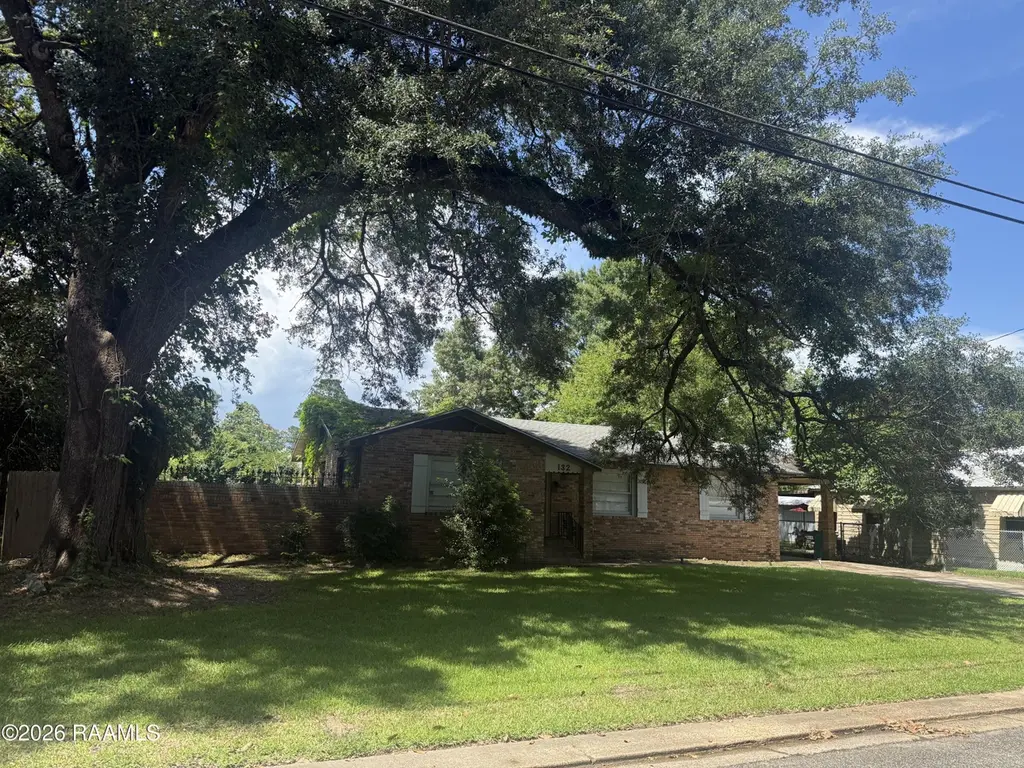
132 W White St · Opelousas, LA
Flood risk 1/10 · Minimal
- FEMA flood zone
- X (unshaded)
- Chance of flooding over 30 yrs
- 0.0%
- Est. flood insurance / yr
- $507 – $1,088
Fire risk 1/10 · Minimal
- Est. fire insurance / yr
- $1,269 – $2,357
Heat risk 8/10 · Major
- Hot days now (above 110°F)
- 7 days/yr
- Hot days in 30 yrs
- 20 days/yr
Wind risk 9/10 · Severe
- Chance of severe wind over 30 yrs
- 99.0%
Air-quality risk 1/10 · Minimal
- Unhealthy air days now
- 0 days/yr
- Unhealthy air days in 30 yrs
- 0 days/yr
Risk factors via First Street. Map © Google.
Why this score? — see what drove the C grade
The composite is a weighted blend of 9 inputs, each scored 0–100. Each bar is that input's sub-score; the figure is the points it added to the 100-point composite (weight × sub-score).
- Cash flow +25.2/30.0
- DSCR +8.3/10.0
- ARV discount +7.5/15.0
- 1% rule +5.5/10.0
- Livability +3.2/5.0
- Rent growth +2.5/5.0
- Condition / age +2.5/5.0
- Schools +2.2/10.0
- Appreciation +0.0/10.0
$115,000
🖨 Deal sheet (PDF) 📄 Offer letter ✓ Due diligence
Listing remarks
Beautiful brick home that was COMPLETELY renovated in 2020! Conveniently located near all that Opelousas has to offer! Just minutes from grocery stores, medical facilities, restaurants, boutiques, and everyday conveniences. Need to commute to Lafayette? No problem! This home offers close proximity to Interstate 49 making travel quick and convenient. Whether you're looking for comfort, accessibility, or a central location, this property checks all the boxes!
Key facts
- Near boutiques
- Near restaurants
- Central location
Tags
Property features AI
Exterior
- Parking: Attached carport; 1 covered parking space; 1 total parking space
- Utilities: Public sewer; Electric service: CLECO
- Home design: Single-family residence
- Construction: Brick veneer construction
- Exterior features: Composition roof; Brick veneer exterior
Interior
- Kitchen: Dishwasher
- Bathrooms: 2 full bathrooms; 1 half bathroom
- Heating & cooling: Central heating; Central air conditioning
- Interior features: Kitchen island; Walk-in closets
Neighborhood map
What this means for you Summary
Snapshot
- This is a 3-bed/2.5-bath other listed at $115k.
Deal economics
- At list price, monthly cash flow is $257 ($3k/yr) — positive.
- The deal already cash-flows at list — no discount required.
- Meets the 1% rule at list price ($1k rent vs $115k).
- Recommended offer: $113k (1.5% below list) — sets the bar for market timing.
- Cap rate 9.0% vs local median 4.0% in Opelousas — top-decile yield for the area; either an underpriced asset or a hidden risk that comps aren't pricing in. Stress-test before assuming the spread holds.
Location & tenants
- Location reads 63/100 on livability (#187 in LA) — a middle-class / working-renter tenant base. Strengths: cost of living A+, housing A+, health & safety A+; Watch: crime F, amenities F, commute F.
- St. Landry Parish (town): math 20% / reading 33% proficiency, ranked #54 of 98 in LA (top 55%) — low school quality limits family demand, transient renter base, plan for 1-2y turnover; 73% free/reduced lunch — lower-income household profile, screen leases tightly.
- Zoned schools: Park Vista Elementary School (math 18% / reading 25%, grade F, #434 of 646 statewide, top 68%, 575 students, 77% FRL); Opelousas Middle School (math 5% / reading 16%, grade F, #197 of 218 statewide, top 91%, 246 students, 92% FRL); Opelousas Senior High School (math 11% / reading 18%, grade F, #224 of 265 statewide, top 86%, 840 students, 77% FRL).
- Market conditions: 312 active listings in the ZIP; 142 units permitted in St. Landry Parish in 2024 (0 in 5+ unit buildings).
Forward outlook
- Local home prices are declining (-3.0%/yr); year-one equity from $795 of loan paydown is wiped out by about $3k of value loss. Plan a longer hold.
- St. Landry County population projected to shrink 9% by 2050 — rents likely to lag national; underwrite the cash flow, not the appreciation.
Negotiation context
- It's been on market 25 days — a 2% lower offer ($113k) is reasonable based on typical stale-listing flexibility.
- 2 sale attempts since 7y ago; this cycle's ask is 6% above the opening price — seller raised mid-cycle; expect resistance to lowballs.
Risks & watch-outs
- Climate carrying-cost: severe wind risk, 99% chance of damaging wind over 30y; extreme-heat days projected 7→20/yr by 2055 (HVAC capex compounding) — expect insurance premiums to compound above CPI over the hold.
Questions for the listing agent
- Is there a deadline driving the sale (1031 exchange, divorce, estate, relocation)? That informs how much negotiation room exists.
- Crime grade is F in this area — have there been break-ins, vandalism, or insurance claims at this property in the last 3 years? What carrier currently insures it and at what premium?
- What's the average days-on-market for RENTAL listings here right now (not sales)? A rising rental-DOM trend means longer vacancies and softer asking-rent achievability than the comps imply.
- What's the recent tenant-quality profile in this submarket — average credit score on applications, eviction rate, late-payment / NSF rate, and stable-employment percentage? A property-management company in the area should have these aggregated.
- How much new for-sale + rental construction is in the pipeline within 1–3 miles? Heavy new supply typically softens prices + rents 12–24 months out; constrained supply supports both.
Investment metrics
- 1% rule
- 1.05% ✓
- Cap rate
- 8.97%
- Cash-on-cash
- 9.56%
- DSCR
- 1.43
- GRM
- 8.0
CMA / ARV
No comps found within radius.
Projected returns pro-forma
-3.0% appreciation · 3.0% rent growth · sell at horizon
- IRR
- -1.9%
- Equity multiple
- 0.93×
- Total profit
- $-2,341
- Equity at exit
- $17,147
- IRR
- 7.7%
- Equity multiple
- 1.58×
- Total profit
- $18,820
- Equity at exit
- $9,943
Cash invested: $32,200 (down + closing). Projections, not guarantees.
Landlord ↔ Tenant lean methodology
- Overall (STATE)
- 90 Strongly Landlord-Friendly
- State Louisiana
- 90 Strongly Landlord-Friendly · R+12
- County
- — inherits STATE
- City
- — inherits STATE
ZIP-level market 70570
- Home prices YoY
- -34.7%
- Active inventory
- 312
- Price-to-rent
- 8.0×
Monthly cashflow live
- Estimated rent
- $1,202 medium interval (Pro) →
- Mortgage (P&I)
- −$603
- Tax from tax record
- −$42 /mo · $506/yr
- Insurance
- −$48
- HOA
- −$0
- Vacancy / Maint / Mgmt
- −$252
- Net cashflow
- $257
Break-even live
Sensitivity live
| Price | -10% $322 | -5% $289 | +0% $257 | +5% $224 | +10% $191 |
|---|---|---|---|---|---|
| Rent | -10% $162 | -5% $209 | +0% $257 | +5% $304 | +10% $351 |
| Rate | -1.0pp $314 | -0.5pp $286 | base $257 | +0.5pp $227 | +1.0pp $196 |
UW: 25.0% down · 7.5% · 30yr · 1.5% tax · 5.0% vac · 8.0% maint · 8.0% mgmt
Financing live
Cash to close
- Down payment
- $28,750
- Closing costs
- $3,450
- Reserves months
- —
- Total cash needed
- —
Loan-product check · same deal, 3 products live
Conventional
25% down · 7.5% · 30yr
- Down + closing
- —
- Monthly P&I
- —
- Monthly cashflow
- —
- DSCR
- —
- Eligible?
- —
Personal DTI + credit; lowest rate.
DSCR
20% down · 8.5% · 30yr
- Down + closing
- —
- Monthly P&I
- —
- Monthly cashflow
- —
- DSCR
- —
- Eligible?
- —
No personal income docs; deal must DSCR.
Hard money
10% down · 12.0% · 12mo
- Down + closing
- —
- Monthly P&I
- —
- Monthly cashflow
- —
- DSCR
- —
- Eligible?
- —
Short-term bridge; refi at stabilization.
Listing history 18 events
-
2026-06-21pricestatusdays on market $115,000 Pending 25 DOM
-
2026-06-18days on market $109,000 Active 23 DOM
-
2026-06-17days on market $109,000 Active 22 DOM
-
2026-06-16days on market $109,000 Active 21 DOM
-
2026-06-15days on market $109,000 Active 20 DOM
-
2026-06-13days on market $109,000 Active 18 DOM
-
2026-06-12days on market $109,000 Active 17 DOM
-
2026-06-09days on market $109,000 Active 14 DOM
-
2026-06-08days on market $109,000 Active 13 DOM
-
2026-06-07days on market $109,000 Active 12 DOM
-
2026-06-07days on market $109,000 Active 11 DOM
-
2026-06-04days on market $109,000 Active 8 DOM
-
2026-06-02days on market $109,000 Active 7 DOM
-
2026-06-01days on market $109,000 Active 6 DOM
-
2026-05-31days on market $109,000 Active 5 DOM
-
2026-05-31days on market $109,000 Active 4 DOM
-
2026-05-26$109,000 Active
-
2019-12-14$139,999
ⓘ Source: listings_history table (triggers on properties + properties_extension) + one-shot
backfill from property_details.listing_events for pre-trigger history.
Tax reassessment forecast LA · Resets to sale price
- Current annual tax
- $506 · $42/mo
- Projected year-2 tax
- $632 · $53/mo
- Expected delta
- +$127/yr (+$11/mo · 25.1%)
ⓘ Screening estimate from a state-policy table — verify with the county assessor before closing.
Climate risk First Street
- Flood 1/10 Low FEMA zone X (unshaded) · 0% chance over 30 yrs
- Wildfire 1/10 Low
- Heat 8/10 Severe 7 d/yr ≥110°F today · 20 d/yr by 30 yrs out
- Wind 9/10 Extreme 99% chance of damaging wind over 30 yrs
- Air quality 1/10 Low 0 unhealthy d/yr today · 0 by 30 yrs out
Nearby sold comps map
Loading sold comps map…
Walkable amenities ~0.75 mi
Loading nearby amenities…
Taxation est. · year 1
- Rental income
- $14,425
- − Mortgage interest
- −$6,442
- − Property taxes
- −$506
- − Insurance
- −$575
- − Repairs & maintenance
- −$1,154
- − Management
- −$1,154
- − Depreciation
- −$3,345
- Taxable income
- $1,249
- Est. tax owed @ 24.0%
- −$300
- After-tax cash flow
- $2,779/yr
For passive investors: Depreciation is non-cash, so a rental often shows a tax loss while cash-flowing — sheltering income. Rental losses are passive: they offset passive income freely, and up to $25,000/yr can offset ordinary (W-2) income if you actively participate and your MAGI is under $100k (phasing out to $0 by $150k); unused losses carry forward. On sale, claimed depreciation is recaptured at up to 25%, and gains may owe capital-gains tax (a 1031 exchange can defer both). Figures are a year-1 estimate at your 24.0% rate — not tax advice; consult a CPA.
Schools (NCES district)
- District
- St. Landry Parish
- NCES district ID
- 2201560
- Math proficiency
- 20% ▼ -43.00%
- Reading proficiency
- 33% ▼ -35.00%
- Median HH income
- $32,635
- Composite
- 21.59/100
- National rank
- #8303
- State rank
- #54 of 98 in LA
Livability — Opelousas
- Score
- 63/100
- State rank
- #187
- US rank
- #14928
Category grades
Schools grade is shown separately in the Schools card above.
Census & demographics
- Census place
- Opelousas, LA
- Population (ZIP)
- 37,188
Population outlook (St. Landry County) Hauer SSP2
- Today (2025)
- 83,114 people
- By 2030
- 82,110 · -1.2%
- By 2040
- 79,445 · -4.4%
- By 2050
- 75,855 · -8.7%
- By 2075
- 65,684 · -21.0%
- By 2100
- 51,739 · -37.7%
Race, ethnicity, and origin ACS 2023
- Neighborhood character
- Diverse neighborhood (Simpson 0.56)
- Race & ethnicity
- Black 55% White 37% Two or more races 4% Hispanic / Latino 4%
- Common ancestry
- Lithuanian 8%
- Foreign-born
- 1% · Canada
- Languages at home
- 92% English-only · French/Haitian/Cajun 5% Spanish 3%
Political lean MEDSL · St. Landry
- 2024 margin
- R (+18.8) · D 40.0% · R 58.9% · Other 1.1%
- 2008→2024 swing
- -15.6pp toward R · 2008: -3.2pp · 2024: -18.8pp
- All cycles
- 2024: R+18.8 2020: R+14.1 2016: R+11.9 2012: R+4.3 2008: R+3.2
Not yet ingested
- Civics
- —
Market trends
- HPI YoY
- ▼ -52.38%
- Current HPI
- 98.4256
- Rent YoY
- —
- Metro
- —
- State GDP YoY
- ▲ 3.29%
- F500 in state
- 10
Industry mix (Fortune 500 HQ in LA)
| Industry | F500 HQs | Revenue |
|---|---|---|
| Telecommunications | 2 | $23B |
|
||
| Utilities | 1 | $12B |
|
||
| Wholesale / Distribution | 1 | $5B |
|
||
| Advertising | 1 | $2B |
|
||
Price history
-22.1% since first listed2 events — show timeline
- 2026-05-26 Listed $109,000 AcadianaMLS
- 2019-12-14 Listed $139,999 AcadianaMLS
Property tax history
+1.4%/yrLatest (2025): $506 · +0.0% YoY. Source: county tax records.
Cash-flow waterfall
monthlySold comps — $/sqft
last 12 mo · ≤1 miLoading sold comps…