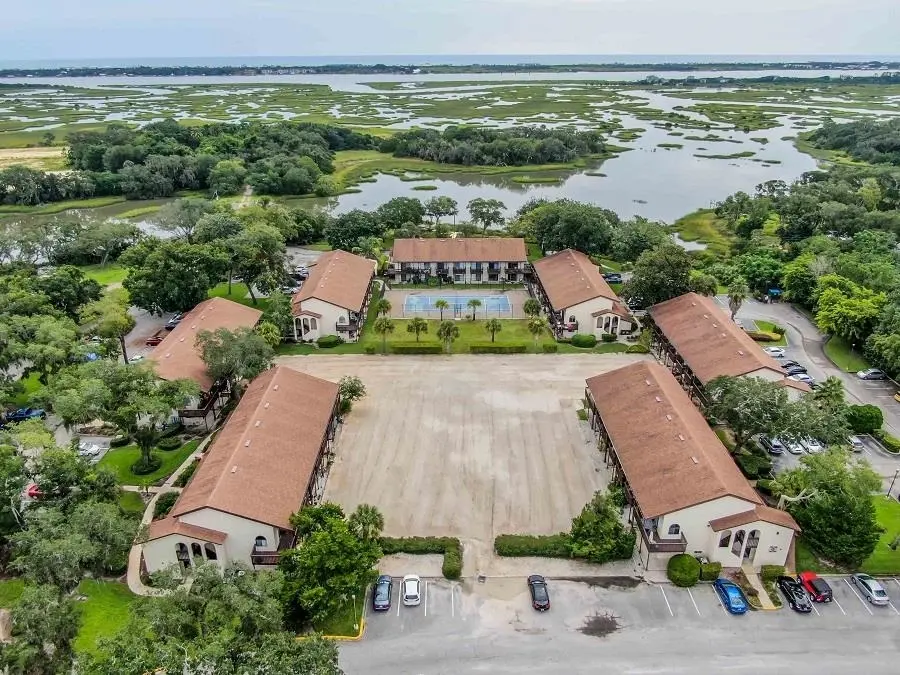
1255 A Ponce Island Dr #712 · St. Augustine, FL
Flood risk 7/10 · Major
- FEMA flood zone
- X (shaded)
- Chance of flooding over 30 yrs
- 0.87%
- Est. flood insurance / yr
- $507 – $1,088
Fire risk 3/10 · Minor
- Est. fire insurance / yr
- $947 – $1,759
Heat risk 10/10 · Severe
- Hot days now (above 106°F)
- 7 days/yr
- Hot days in 30 yrs
- 20 days/yr
Wind risk 10/10 · Severe
- Chance of severe wind over 30 yrs
- 99.0%
Air-quality risk 3/10 · Minor
- Unhealthy air days now
- 3 days/yr
- Unhealthy air days in 30 yrs
- 3 days/yr
Risk factors via First Street. Map © Google.
Why this score? — see what drove the D grade
The composite is a weighted blend of 9 inputs, each scored 0–100. Each bar is that input's sub-score; the figure is the points it added to the 100-point composite (weight × sub-score).
- ARV discount +12.0/15.0
- Cash flow +7.8/30.0
- Schools +6.4/10.0
- 1% rule +6.1/10.0
- Rent growth +2.9/5.0
- Livability +2.5/5.0
- Condition / age +2.5/5.0
- DSCR +1.9/10.0
- Appreciation +0.0/10.0
$129,900
🖨 Deal sheet 📄 Offer letter ✓ Due diligence
Listing remarks MLS
Welcome to the Tennis Village, this hidden gem of a community is brimming with potential, and just minutes away from nearby Beaches. This peaceful and private complex is situated on the ICW and has water access, walking paths, and a nearby bird sanctuary. Launch your kayak and explore more of the nature just outside your front door. Great location, close to Beaches, area businesses, downtown St. Augustine, Flagler College and a short commute to Jacksonville. Would make a perfect cozy second home, Snowbird retreat, or Turn key rental. Nearby development plans should only benefit this community.
Key facts
- Kayak launch
- Nature access
- Walking paths
Tags
Neighborhood map
What this means for you Summary
Snapshot
- This is a 1-bed/1.5-bath condo listed at $130k.
Deal economics
- At list price, monthly cash flow is $-211 ($-3k/yr) — negative.
- To cash-flow at today's rent, offer at most $93k (28.7% below list).
- Meets the 1% rule at list price ($1k rent vs $130k).
- Recommended offer: $93k (28.7% below list) — sets the bar for cash-flow.
- Cap rate 5.0% vs local median 3.1% in St. Augustine — top-decile yield for the area; either an underpriced asset or a hidden risk that comps aren't pricing in. Stress-test before assuming the spread holds.
Location & tenants
- Location reads: area grade D — affects rentability + tenant quality, not the cash-flow math above.
- St. Johns (rural): math 75% / reading 73% proficiency, ranked #2 of 73 in FL (top 3%) — strong family-tenant draw, lease renewals of 3-5y typical; only 20% free/reduced lunch — higher-income household profile.
- Market conditions: Rents rising (+1.8%/yr); 456 active listings in the ZIP; 1 comparable units currently listed for rent nearby; high-income renter base; 5,575 units permitted in St. Johns County in 2024 (584 in 5+ unit buildings).
- This rent is only 13% of the median local income ($136k/yr) — well below the 30% rent-burden line; pricing power to push rent on renewal without tenant pushback.
Forward outlook
- Local home prices are declining (-3.0%/yr); year-one equity from $898 of loan paydown is wiped out by about $4k of value loss. Plan a longer hold.
- St. Johns County population projected at +60% by 2050 — long-run rental-demand tailwind backs the buy-and-hold thesis.
Negotiation context
- It's been on market 118 days — a 9% lower offer ($118k) is reasonable based on typical stale-listing flexibility.
- 2 sale attempts since 8y ago with the ask held roughly flat each time — persistent listings suggest the price (not the market) is what's stuck; bring a comps-based counter.
- Current owner paid $84k; list at $130k implies a 55% gain — meaningful room to come down on a strong offer.
Risks & watch-outs
- Watch-outs: flood insurance adds $66/mo; HOA is 30% of rent.
- Climate carrying-cost: major flood risk; severe wind risk, 99% chance of damaging wind over 30y; extreme-heat days projected 7→20/yr by 2055 (HVAC capex compounding) — expect insurance premiums to compound above CPI over the hold.
Questions for the listing agent
- What do current leases actually rent for vs. the listed asking? Can we see a recent rent roll and the last 12 months of T-12 income?
- It's been on market 118 days. Have you received any prior offers? Is the seller open to a 29% concession, seller financing, or rate buy-down credit?
- What's the actual annual flood-insurance premium (NFIP or private), and is the property in a SFHA with mandatory coverage?
- What does the HOA fee cover, when was the last increase, and are there any pending special assessments or reserve-fund shortfalls?
- Any open or pending special assessments — roof, HVAC, plumbing, elevator, façade? What's the per-unit balance and payoff schedule, and is the seller paying it off at close or rolling it to the buyer?
- Why hasn't it sold? Are there any deal-killer items the seller is aware of (foundation, flood, title, zoning, code violations)?
- Is there a deadline driving the sale (1031 exchange, divorce, estate, relocation)? That informs how much negotiation room exists.
- The area grade is low — what's the realistic commute time and amenity access for the typical tenant pool here? Any planned neighborhood developments (good or bad) we should know about?
- What's the average days-on-market for RENTAL listings here right now (not sales)? A rising rental-DOM trend means longer vacancies and softer asking-rent achievability than the comps imply.
- What's the recent tenant-quality profile in this submarket — average credit score on applications, eviction rate, late-payment / NSF rate, and stable-employment percentage? A property-management company in the area should have these aggregated.
- How much new apartment / multifamily construction is in the pipeline within 1–3 miles? Heavy new supply (>2% of stock underway) typically softens rents 12–24 months out; light construction supports rent growth.
Investment metrics
- 1% rule
- 1.11% ✓
- Cap rate
- 4.96%
- Cash-on-cash
- -4.77%
- DSCR
- 0.79
- GRM
- 7.5
CMA / ARV
- ARV (median comp)
- $144,365
- List price
- $129,900
- Delta
- -10.02%
- Verdict
- UNDERPRICED
- Comps
- 20 within 1.0 mi
Projected returns pro-forma
-3.0% appreciation · 1.77% rent growth · sell at horizon
- IRR
- -30.3%
- Equity multiple
- 0.01×
- Total profit
- $-35,952
- Equity at exit
- $19,369
- IRR
- -41.9%
- Equity multiple
- -0.50×
- Total profit
- $-54,459
- Equity at exit
- $11,231
Cash invested: $36,372 (down + closing). Projections, not guarantees.
Landlord ↔ Tenant lean methodology
- Overall (STATE)
- 87 Strongly Landlord-Friendly
- State Florida
- 87 Strongly Landlord-Friendly · R+3
- County
- — inherits STATE
- City
- — inherits STATE
ZIP-level market 32095
- Home prices YoY
- -18.4%
- Rents YoY
- 1.8%
- Active inventory
- 456
- Price-to-rent
- 7.5×
Monthly cashflow live
- Estimated rent
- $1,446 medium interval (Pro) →
- Mortgage (P&I)
- −$681
- Tax from tax record
- −$122 /mo · $1,461/yr
- Insurance
- −$54
- Flood insurance flood zone
- −$66 /mo · $798/yr
- HOA
- −$430
- Vacancy / Maint / Mgmt
- −$304
- Net cashflow
- $-211
Break-even live
UW: 25.0% down · 7.5% · 30yr · 1.5% tax · 5.0% vac · 8.0% maint · 8.0% mgmt
Financing live
Cash to close
- Down payment
- $32,475
- Closing costs
- $3,897
- Reserves months
- —
- Total cash needed
- —
Loan-product check · same deal, 3 products live
Conventional
25% down · 7.5% · 30yr
- Down + closing
- —
- Monthly P&I
- —
- Monthly cashflow
- —
- DSCR
- —
- Eligible?
- —
Personal DTI + credit; lowest rate.
DSCR
20% down · 8.5% · 30yr
- Down + closing
- —
- Monthly P&I
- —
- Monthly cashflow
- —
- DSCR
- —
- Eligible?
- —
No personal income docs; deal must DSCR.
Hard money
10% down · 12.0% · 12mo
- Down + closing
- —
- Monthly P&I
- —
- Monthly cashflow
- —
- DSCR
- —
- Eligible?
- —
Short-term bridge; refi at stabilization.
Rent comps 1 comps
| Address | Beds | Baths | Sqft | Rent | $/sqft | DOM | Units | Dist |
|---|---|---|---|---|---|---|---|---|
| 3540 Datura St Unit B St. Augustine, FL | 1.0 | 1.0 | 264 | $1,500 | $5.68 | 23d | 1 | 1.25mi |
HOA detail condo
- Monthly dues
- $430 · $5,160/yr
- Likely covers
- water
- Assessments
- None detected in remarks — confirm with the listing agent.
Listing history 22 events
-
2026-06-18days on market $129,900 Active 118 DOM
-
2026-06-17days on market $129,900 Active 117 DOM
-
2026-06-16days on market $129,900 Active 116 DOM
-
2026-06-15days on market $129,900 Active 115 DOM
-
2026-06-13days on market $129,900 Active 113 DOM
-
2026-06-13days on market $129,900 Active 112 DOM
-
2026-06-10days on market $129,900 Active 109 DOM
-
2026-06-08days on market $129,900 Active 108 DOM
-
2026-06-07days on market $129,900 Active 107 DOM
-
2026-06-03days on market $129,900 Active 103 DOM
-
2026-06-02remarks 638-char remark
-
2026-06-02days on market $129,900 Active 102 DOM
-
2026-06-01days on market $129,900 Active 101 DOM
-
2026-05-31days on market $129,900 Active 100 DOM
-
2026-02-20$129,900 Active 600-char remark
Show marketing remark (600 chars)
Welcome to the Tennis Village, this hidden gem of a community is brimming with potential, and just minutes away from nearby Beaches. This peaceful and private complex is situated on the ICW and has water access, walking paths, and a nearby bird sanctuary. Launch your kayak and explore more of the nature just outside your front door. Great location, close to Beaches, area businesses, downtown St. Augustine, Flagler College and a short commute to Jacksonville. Would make a perfect cozy second home, Snowbird retreat, or Turn key rental. Nearby development plans should only benefit this community.
-
2018-03-09soldstatus $84,000 133-char remark
Show marketing remark (133 chars)
Entered for statistical purposes only. Sold with 90% of the furnishings, unit had a remodeled and expanded kitchen and other updates.
-
2018-03-08$84,000 133-char remark
Show marketing remark (133 chars)
Entered for statistical purposes only. Sold with 90% of the furnishings, unit had a remodeled and expanded kitchen and other updates.
-
2018-03-08historical 133-char remark
Show marketing remark (133 chars)
Entered for statistical purposes only. Sold with 90% of the furnishings, unit had a remodeled and expanded kitchen and other updates.
-
2004-01-02soldstatus $75,000
-
2002-02-05soldstatus $64,800
-
1998-09-09soldstatus $54,900
-
1987-12-01soldstatus $38,900
ⓘ Source: listings_history table (triggers on properties + properties_extension) + one-shot
backfill from property_details.listing_events for pre-trigger history.
Tax reassessment forecast FL · Resets to sale price
- Current annual tax
- $1,461 · $122/mo
- Projected year-2 tax
- $1,461 · $122/mo
- Expected delta
- $0/yr ($0/mo · 0.0%)
ⓘ Screening estimate from a state-policy table — verify with the county assessor before closing.
Climate risk First Street
- Flood 7/10 Severe FEMA zone X (shaded) · 87% chance over 30 yrs
- Wildfire 3/10 Moderate
- Heat 10/10 Extreme 7 d/yr ≥106°F today · 20 d/yr by 30 yrs out
- Wind 10/10 Extreme 99% chance of damaging wind over 30 yrs
- Air quality 3/10 Moderate 3 unhealthy d/yr today · 3 by 30 yrs out
Nearby sold comps map
Loading sold comps map…
Walkable amenities ~0.75 mi
Loading nearby amenities…
Taxation est. · year 1
- Rental income
- $17,355
- − Mortgage interest
- −$7,276
- − Property taxes
- −$1,461
- − Insurance
- −$1,447
- − Repairs & maintenance
- −$1,388
- − Management
- −$1,388
- − HOA
- −$5,160
- − Depreciation
- −$3,779
- Taxable loss
- −$4,545
- Est. tax savings @ 24.0%
- +$1,091
- After-tax cash flow
- $-1,441/yr
For passive investors: Depreciation is non-cash, so a rental often shows a tax loss while cash-flowing — sheltering income. Rental losses are passive: they offset passive income freely, and up to $25,000/yr can offset ordinary (W-2) income if you actively participate and your MAGI is under $100k (phasing out to $0 by $150k); unused losses carry forward. On sale, claimed depreciation is recaptured at up to 25%, and gains may owe capital-gains tax (a 1031 exchange can defer both). Figures are a year-1 estimate at your 24.0% rate — not tax advice; consult a CPA.
Schools (NCES district)
- District
- St. Johns
- NCES district ID
- 1201740
- Math proficiency
- 75% ▼ -5.00%
- Reading proficiency
- 73% ▼ -2.00%
- Median HH income
- $66,842
- Composite
- 64.31/100
- National rank
- #556
- State rank
- #2 of 73 in FL
Livability — St. Augustine
No livability data for this city. (Only ~50 U.S. cities are tracked.)
Census & demographics
- County
- Saint Johns County · 301,599 people
- Metro
- Jacksonville, FL
- Population (ZIP)
- 21,399
- Household income
- $136,038
- Rent vs Own
- Severe rent burden
- 101.0
Population outlook (St. Johns County) Hauer SSP2
- Today (2025)
- 303,941 people
- By 2030
- 342,590 · +12.7%
- By 2040
- 417,328 · +37.3%
- By 2050
- 487,011 · +60.2%
- By 2075
- 635,395 · +109.1%
- By 2100
- 717,469 · +136.1%
Race, ethnicity, and origin ACS 2023
- Neighborhood character
- Predominantly White (75%)
- Race & ethnicity
- White 75% Hispanic / Latino 11% Asian 6% Two or more races 5% Black 4%
- Hispanic origin (detail)
- Mexican 1% Cuban 3% Dominican 2%
- Common ancestry
- Romanian 4% Lithuanian 4% Slovak 3%
- Foreign-born
- 12% · Canada, Jamaica, China
- Languages at home
- 85% English-only · Spanish 9% Other Indo-European 1% Russian/Polish/Slavic 1%
Political lean MEDSL · St. Johns
- 2024 margin
- Solid R (+31.4) · D 33.9% · R 65.2%
- 2008→2024 swing
- +0.2pp no change · 2008: -31.6pp · 2024: -31.4pp
- All cycles
- 2024: R+31.4 2020: R+26.7 2016: R+33.4 2012: R+37.8 2008: R+31.6
Not yet ingested
- Civics
- —
Market trends
- HPI YoY
- ▼ -55.44%
- Current HPI
- 246.0743
- Rent YoY
- ▲ 1.77%
- Metro
- Jacksonville, FL
- State GDP YoY
- ▲ 3.28%
- F500 in state
- 36
Industry mix (Fortune 500 HQ in FL)
| Industry | F500 HQs | Revenue |
|---|---|---|
| Industrial Technology | 2 | $29B |
|
||
| Insurance | 2 | $17B |
|
||
| Retail | 1 | $60B |
|
||
| Technology Distribution | 1 | $58B |
|
||
| Homebuilding | 1 | $35B |
|
||
| Technology Manufacturing | 1 | $35B |
|
||
Price history
+233.9% since first listed8 events — show timeline
- 2026-02-20 Listed $129,900 St. Augustine and St. Johns County Board of REALTORS®
- 2018-03-09 Sold (MLS) $84,000 St. Augustine and St. Johns County Board of REALTORS®
- 2018-03-08 Delisted — St. Augustine and St. Johns County Board of REALTORS®
- 2018-03-08 Listed $84,000 St. Augustine and St. Johns County Board of REALTORS®
- 2004-01-02 Sold (Public Records) $75,000 Public Records
- 2002-02-05 Sold (Public Records) $64,800 Public Records
- 1998-09-09 Sold (Public Records) $54,900 Public Records
- 1987-12-01 Sold (Public Records) $38,900 Public Records
Property tax history
+8.7%/yrLatest (2025): $1,461 · +4.8% YoY. Source: county tax records.
Cash-flow waterfall
monthlySold comps — $/sqft
last 12 mo · ≤1 miLoading sold comps…