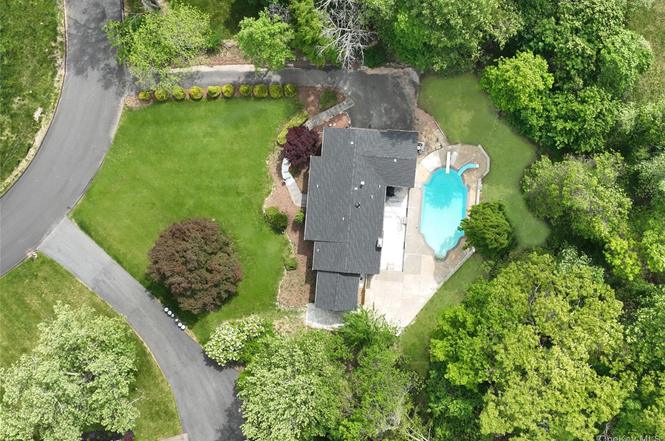
7 Charlotte Dr · Wesley Hills, NY
Flood risk 7/10 · Major
- FEMA flood zone
- X (unshaded)
- Chance of flooding over 30 yrs
- 0.78%
- Est. flood insurance / yr
- $473 – $860
Fire risk 3/10 · Minor
- Est. fire insurance / yr
- $691 – $1,283
Heat risk 5/10 · Moderate
- Hot days now (above 97°F)
- 7 days/yr
- Hot days in 30 yrs
- 15 days/yr
Wind risk 4/10 · Minor
- Chance of severe wind over 30 yrs
- 20.0%
Air-quality risk 3/10 · Minor
- Unhealthy air days now
- 2 days/yr
- Unhealthy air days in 30 yrs
- 4 days/yr
Risk factors via First Street. Map © Google.
Why this score? — see what drove the F grade
The composite is a weighted blend of 9 inputs, each scored 0–100. Each bar is that input's sub-score; the figure is the points it added to the 100-point composite (weight × sub-score).
- ARV discount +11.5/15.0
- Cash flow +8.1/30.0
- Livability +3.0/5.0
- Schools +2.6/10.0
- 1% rule +2.5/10.0
- Rent growth +2.5/5.0
- Condition / age +2.5/5.0
- DSCR +2.1/10.0
- Appreciation +0.0/10.0
$1,199,000
🖨 Deal sheet 📄 Offer letter ✓ Due diligence
Listing remarks
Super location in the cul de sac of Charlotte dr, Wesley Hills! INGROUND POOL in PRIVATE setting! Home is fully RENOVATED! NEW WINDOWS AND NEW APPLIANCES too! Extended bi-level with 7 bedrooms and 3 full bathrooms. 4 season Sunroom-Family room off kitchen with cathedral ceilings! New kitchen features 2 full ovens and 2 sinks, and quartz counters! 2 new bathrooms. Master bathroom renovated. New roof, new plumbing, new electric and more! Hardwood floors. Huge master bedroom and private master bathroom. Walkout lower level. Great neighborhood! Additional Information: ParkingFeatures:2 Car Attached,
Key facts
- Fully renovated
- Inground pool
- New appliances
Tags
Neighborhood map
What this means for you Summary
Snapshot
- This is a 5-bed/3.0-bath single-family listed at $1.20M.
Deal economics
- At list price, monthly cash flow is $-1k ($-15k/yr) — negative.
- To cash-flow at today's rent, offer at most $980k (18.3% below list).
- To meet the 1% rule (rent ≥ 1% of price), the offer needs to be $899k (25.0% below list).
- Recommended offer: $899k (25.0% below list) — sets the bar for 1% rule.
- Cap rate 5.1% vs local median 1.5% in Wesley Hills — top-decile yield for the area; either an underpriced asset or a hidden risk that comps aren't pricing in. Stress-test before assuming the spread holds.
Location & tenants
- Location reads 59/100 on livability (#1,036 in NY) — a working-class tenant base; expect higher turnover. Strengths: crime A+, employment A+, housing A-; Watch: amenities F, commute F, cost of living F.
- East Ramapo Central School District (Spring Valley) (suburban): math 22% / reading 34% proficiency, ranked #576 of 590 in NY (top 98%) — low school quality limits family demand, transient renter base, plan for 1-2y turnover; 68% free/reduced lunch — lower-income household profile, screen leases tightly.
- Zoned schools: Grandview Elementary School (math 32% / reading 17%, grade F, #1,846 of 2,108 statewide, top 91%, 558 students, 76% FRL); Pomona Middle School (math 6% / reading 19%, grade F, #713 of 729 statewide, top 98%, 574 students, 81% FRL); Ramapo High School (math 66% / reading 76%, grade B+, #699 of 1,100 statewide, top 64%, 1,603 students, 83% FRL).
- Market conditions: 259 active listings in the ZIP; 2 comparable units currently listed for rent nearby; 429 units permitted in Rockland County in 2024 (231 in 5+ unit buildings).
Forward outlook
- Local home prices are declining (-3.0%/yr); year-one equity from $8k of loan paydown is wiped out by about $36k of value loss. Plan a longer hold.
- Rockland County population projected at +7% by 2050 — modest demand growth; plan on rents tracking national, not racing it.
Negotiation context
- It's been on market 81 days — a 6% lower offer ($1.13M) is reasonable based on typical stale-listing flexibility.
- 15 sale attempts since 8y ago with the ask held roughly flat each time — persistent listings suggest the price (not the market) is what's stuck; bring a comps-based counter.
Risks & watch-outs
- Watch-outs: flood insurance adds $56/mo.
- Climate carrying-cost: major flood risk; extreme-heat days projected 7→15/yr by 2055 (HVAC capex compounding) — expect insurance premiums to compound above CPI over the hold.
Questions for the listing agent
- What do current leases actually rent for vs. the listed asking? Can we see a recent rent roll and the last 12 months of T-12 income?
- It's been on market 81 days. Have you received any prior offers? Is the seller open to a 25% concession, seller financing, or rate buy-down credit?
- Built in 1964 — when were the roof, HVAC, electrical panel, plumbing, and water heater last replaced?
- What's the actual annual flood-insurance premium (NFIP or private), and is the property in a SFHA with mandatory coverage?
- Why hasn't it sold? Are there any deal-killer items the seller is aware of (foundation, flood, title, zoning, code violations)?
- Is there a deadline driving the sale (1031 exchange, divorce, estate, relocation)? That informs how much negotiation room exists.
- Schools are B-rated — typically a magnet for longer-tenancy family renters. What's the average tenant stay here, and is there a school-zone premium baked into asking?
- The area grade is low — what's the realistic commute time and amenity access for the typical tenant pool here? Any planned neighborhood developments (good or bad) we should know about?
- What's the average days-on-market for RENTAL listings here right now (not sales)? A rising rental-DOM trend means longer vacancies and softer asking-rent achievability than the comps imply.
- What's the recent tenant-quality profile in this submarket — average credit score on applications, eviction rate, late-payment / NSF rate, and stable-employment percentage? A property-management company in the area should have these aggregated.
- How much new for-sale + rental construction is in the pipeline within 1–3 miles? Heavy new supply typically softens prices + rents 12–24 months out; constrained supply supports both.
Investment metrics
- 1% rule
- 0.75% ✗
- Cap rate
- 5.11%
- Cash-on-cash
- -4.24%
- DSCR
- 0.81
- GRM
- 11.1
CMA / ARV
- ARV (on-the-fly)
- $1,314,716
- Comps found
- 8
Show comp detail 8 sales within ~0.75 mi
| Address | Dist | Beds/Ba | Sqft | Sold | Price | $/sf | Match |
|---|---|---|---|---|---|---|---|
| 1 Forest Glen Ct | 0.32mi | 6/3.5 (+1) | 3,268 (-4%) | 0mo | $937,500 | $287 | 71 |
| 28 Lime Kiln Rd | 0.46mi | 5/3.0 | 3,184 (-6%) | 3mo | $1,065,000 | $334 | 65 |
| 10 Salem Ct | 0.74mi | 5/2.5 | 3,439 (+1%) | 11mo | $1,225,000 | $356 | 53 |
| 27 Pomona Ln | 0.31mi | 6/4.0 (+1) | 3,686 (+8%) | 15mo | $2,500,000 | $678 | 51 |
| 15 East Ln | 0.60mi | 4/3.0 (-1) | 3,204 (-6%) | 15mo | $815,000 | $254 | 44 |
| 4 Baker Ln | 0.64mi | 5/3.5 | 3,743 (+10%) | 10mo | $1,710,000 | $457 | 44 |
| 3 Ethan Allen Dr | 0.63mi | 4/3.5 (-1) | 3,200 (-6%) | 13mo | $1,235,000 | $386 | 43 |
| 15 Argo Ln | 0.73mi | 5/3.5 | 3,760 (+10%) | 6mo | $1,750,000 | $465 | 41 |
Match score weights: distance 35% · size 25% · config 20% · recency 20%. Top-matched comps best support the ARV.
Projected returns pro-forma
-3.0% appreciation · 3.0% rent growth · sell at horizon
- IRR
- -23.8%
- Equity multiple
- 0.19×
- Total profit
- $-273,192
- Equity at exit
- $178,775
- IRR
- -18.8%
- Equity multiple
- -0.01×
- Total profit
- $-339,008
- Equity at exit
- $103,668
Cash invested: $335,720 (down + closing). Projections, not guarantees.
Landlord ↔ Tenant lean methodology
- Overall (STATE)
- 15 Strongly Tenant-Friendly
- State New York
- 15 Strongly Tenant-Friendly · D+10
- County
- — inherits STATE
- City
- — inherits STATE
ZIP-level market 10977
- Active inventory
- 259
- Price-to-rent
- 11.1×
Monthly cashflow live
- Estimated rent
- $8,995 medium interval (Pro) →
- Mortgage (P&I)
- −$6,288
- Tax from tax record
- −$1,504 /mo · $18,054/yr
- Insurance
- −$500
- Flood insurance flood zone
- −$56 /mo · $666/yr
- HOA
- −$0
- Vacancy / Maint / Mgmt
- −$1,889
- Net cashflow
- $-1,242
Break-even live
UW: 25.0% down · 7.5% · 30yr · 1.5% tax · 5.0% vac · 8.0% maint · 8.0% mgmt
Financing live
Cash to close
- Down payment
- $299,750
- Closing costs
- $35,970
- Reserves months
- —
- Total cash needed
- —
Loan-product check · same deal, 3 products live
Conventional
25% down · 7.5% · 30yr
- Down + closing
- —
- Monthly P&I
- —
- Monthly cashflow
- —
- DSCR
- —
- Eligible?
- —
Personal DTI + credit; lowest rate.
DSCR
20% down · 8.5% · 30yr
- Down + closing
- —
- Monthly P&I
- —
- Monthly cashflow
- —
- DSCR
- —
- Eligible?
- —
No personal income docs; deal must DSCR.
Hard money
10% down · 12.0% · 12mo
- Down + closing
- —
- Monthly P&I
- —
- Monthly cashflow
- —
- DSCR
- —
- Eligible?
- —
Short-term bridge; refi at stabilization.
Rent comps 2 comps
| Address | Beds | Baths | Sqft | Rent | $/sqft | DOM | Units | Dist |
|---|---|---|---|---|---|---|---|---|
| 13 White Birch Dr Pomona, NY | 5.0 | 4.5 | 3286 | $6,500 | $1.98 | 10d | 1 | 0.70mi |
| 996 Haverstraw Rd Suffern, NY | 6.0 | 7.5 | 4048 | $15,000 | $3.71 | 4d | 1 | 1.46mi |
Listing history 40 events
-
2026-01-30status Pending
-
2025-11-10$1,199,000 Active
-
2025-11-08historical $6,000
-
2025-11-07historical
-
2025-10-21$1,199,000 Active
-
2025-10-21historical
-
2025-10-21$6,000
-
2025-09-01price $1,199,000
-
2025-07-21$1,250,000 Active
-
2025-06-13historical
-
2025-06-12status Active
-
2025-03-11status Pending
-
2025-02-03$1,290,000 Active
-
2025-02-03historical
-
2024-06-24$1,290,000 Active
-
2024-06-24historical
-
2024-05-16historical $6,500
-
2024-04-07$1,295,495 Active
-
2024-04-04price $1,295,495
-
2024-04-04historical
-
2024-03-19price $6,500
-
2024-01-11$8,995
-
2023-11-10soldstatus $1,110,000
-
2023-11-07soldstatus $1,110,000 Closed
-
2023-07-07status Pending
-
2023-05-18$1,199,000 Active
-
2022-08-10soldstatus $450,000
-
2021-12-28historical
-
2021-11-21$739,000 Active
-
2021-11-18historical
-
2020-01-29historical
-
2020-01-28$499,000 Active
-
2020-01-23historical
-
2019-11-01status Pending
-
2019-11-01status Active
-
2019-07-30status Pending
-
2019-07-01price $525,000
-
2019-07-01status Active
-
2019-01-24status Pending
-
2018-10-31$579,000 Active
ⓘ Source: listings_history table (triggers on properties + properties_extension) + one-shot
backfill from property_details.listing_events for pre-trigger history.
Tax reassessment forecast NY · Partial reset (capped growth)
- Current annual tax
- $18,054 · $1,504/mo
- Projected year-2 tax
- $19,158 · $1,597/mo
- Expected delta
- +$1,105/yr (+$92/mo · 6.1%)
ⓘ Screening estimate from a state-policy table — verify with the county assessor before closing.
Climate risk First Street
- Flood 7/10 Severe FEMA zone X (unshaded) · 78% chance over 30 yrs
- Wildfire 3/10 Moderate
- Heat 5/10 Major 7 d/yr ≥97°F today · 15 d/yr by 30 yrs out
- Wind 4/10 Moderate 20% chance of damaging wind over 30 yrs
- Air quality 3/10 Moderate 2 unhealthy d/yr today · 4 by 30 yrs out
Nearby sold comps map
Loading sold comps map…
Walkable amenities ~0.75 mi
Loading nearby amenities…
Taxation est. · year 1
- Rental income
- $107,935
- − Mortgage interest
- −$67,163
- − Property taxes
- −$18,054
- − Insurance
- −$6,662
- − Repairs & maintenance
- −$8,635
- − Management
- −$8,635
- − Depreciation
- −$34,880
- Taxable loss
- −$36,092
- Est. tax savings @ 24.0%
- +$8,662
- After-tax cash flow
- $-6,237/yr
For passive investors: Depreciation is non-cash, so a rental often shows a tax loss while cash-flowing — sheltering income. Rental losses are passive: they offset passive income freely, and up to $25,000/yr can offset ordinary (W-2) income if you actively participate and your MAGI is under $100k (phasing out to $0 by $150k); unused losses carry forward. On sale, claimed depreciation is recaptured at up to 25%, and gains may owe capital-gains tax (a 1031 exchange can defer both). Figures are a year-1 estimate at your 24.0% rate — not tax advice; consult a CPA.
Schools (NCES district)
- District
- East Ramapo Central School District (Spring Valley)
- NCES district ID
- 3627810
- Math proficiency
- 22% ▼ -10.00%
- Reading proficiency
- 34% ▼ -2.00%
- Median HH income
- $61,547
- Composite
- 25.6/100
- National rank
- #7418
- State rank
- #576 of 590 in NY
Livability — Wesley Hills
- Score
- 59/100
- State rank
- #1036
- US rank
- #20498
Category grades
Schools grade is shown separately in the Schools card above.
Census & demographics
- Census place
- Wesley Hills, NY
- Population (ZIP)
- 71,465
Population outlook (Rockland County) Hauer SSP2
- Today (2025)
- 339,642 people
- By 2030
- 345,987 · +1.9%
- By 2040
- 357,178 · +5.2%
- By 2050
- 362,456 · +6.7%
- By 2075
- 367,281 · +8.1%
- By 2100
- 328,211 · -3.4%
Race, ethnicity, and origin ACS 2023
- Neighborhood character
- Diverse neighborhood (Simpson 0.62)
- Race & ethnicity
- White 55% Hispanic / Latino 23% Black 16% Two or more races 5% Asian 3%
- Hispanic origin (detail)
- Mexican 1% Puerto Rican 2% Dominican 2%
- Common ancestry
- Hispanic 7% Romanian 5% Italian 2%
- Foreign-born
- 27% · Canada
- Languages at home
- 31% English-only · German/W. Germanic 32% Spanish 21% French/Haitian/Cajun 10%
Political lean MEDSL · Rockland
- 2024 margin
- R (+11.8) · D 44.1% · R 55.9%
- 2008→2024 swing
- -17.7pp toward R · 2008: 5.9pp · 2024: -11.8pp
- All cycles
- 2024: R+11.8 2020: D+1.7 2016: D+5.1 2012: D+6.6 2008: D+5.9
Not yet ingested
- Civics
- —
Market trends
- HPI YoY
- ▼ -518.82%
- Current HPI
- 378.2133
- Rent YoY
- —
- Metro
- —
- State GDP YoY
- ▲ 2.60%
- F500 in state
- 92
Industry mix (Fortune 500 HQ in NY)
| Industry | F500 HQs | Revenue |
|---|---|---|
| Financial Services | 10 | $950B |
|
||
| Consumer Goods | 9 | $162B |
|
||
| Insurance | 4 | $225B |
|
||
| Telecommunications | 2 | $144B |
|
||
| Pharmaceuticals | 2 | $112B |
|
||
| Media / Entertainment | 2 | $69B |
|
||
Price history
+107.1% since first listed40 events — show timeline
- 2026-01-30 Pending — OneKey® MLS as Distributed by MLS Grid
- 2025-11-10 Listed $1,199,000 OneKey® MLS as Distributed by MLS Grid
- 2025-11-08 Rental Removed $6,000 ONEKEY
- 2025-11-07 Listing Removed — OneKey® MLS as Distributed by MLS Grid
- 2025-10-21 Listing Removed — OneKey® MLS as Distributed by MLS Grid
- 2025-10-21 Listed $1,199,000 OneKey® MLS as Distributed by MLS Grid
- 2025-10-21 Listed for Rent $6,000 ONEKEY
- 2025-09-01 Price Changed $1,199,000 OneKey® MLS as Distributed by MLS Grid
- 2025-07-21 Listed $1,250,000 OneKey® MLS as Distributed by MLS Grid
- 2025-06-13 Listing Removed — OneKey® MLS as Distributed by MLS Grid
- 2025-06-12 Relisted — OneKey® MLS as Distributed by MLS Grid
- 2025-03-11 Pending — OneKey® MLS as Distributed by MLS Grid
- 2025-02-03 Listing Removed — OneKey® MLS as Distributed by MLS Grid
- 2025-02-03 Listed $1,290,000 OneKey® MLS as Distributed by MLS Grid
- 2024-06-24 Listing Removed — OneKey® MLS as Distributed by MLS Grid
- 2024-06-24 Listed $1,290,000 OneKey® MLS as Distributed by MLS Grid
- 2024-05-16 Rental Removed $6,500 ONEKEY
- 2024-04-07 Listed $1,295,495 OneKey® MLS as Distributed by MLS Grid
- 2024-04-04 Price Changed $1,295,495 OneKey® MLS as Distributed by MLS Grid
- 2024-04-04 Coming Soon — OneKey® MLS as Distributed by MLS Grid
- 2024-03-19 Price Changed $6,500 ONEKEY
- 2024-01-11 Listed for Rent $8,995 ONEKEY
- 2023-11-10 Sold (Public Records) $1,110,000 Public Records
- 2023-11-07 Sold (MLS) $1,110,000 OneKey® MLS as Distributed by MLS Grid
- 2023-07-07 Pending — OneKey® MLS as Distributed by MLS Grid
- 2023-05-18 Listed $1,199,000 OneKey® MLS as Distributed by MLS Grid
- 2022-08-10 Sold (Public Records) $450,000 Public Records
- 2021-12-28 Listing Removed — OneKey® MLS as Distributed by MLS Grid
- 2021-11-21 Listed $739,000 OneKey® MLS as Distributed by MLS Grid
- 2021-11-18 Coming Soon — OneKey® MLS as Distributed by MLS Grid
- 2020-01-29 Listing Removed — OneKey® MLS as Distributed by MLS Grid
- 2020-01-28 Listed $499,000 OneKey® MLS as Distributed by MLS Grid
- 2020-01-23 Listing Removed — OneKey® MLS as Distributed by MLS Grid
- 2019-11-01 Pending — OneKey® MLS as Distributed by MLS Grid
- 2019-11-01 Relisted — OneKey® MLS as Distributed by MLS Grid
- 2019-07-30 Pending — OneKey® MLS as Distributed by MLS Grid
- 2019-07-01 Price Changed $525,000 OneKey® MLS as Distributed by MLS Grid
- 2019-07-01 Relisted — OneKey® MLS as Distributed by MLS Grid
- 2019-01-24 Pending — OneKey® MLS as Distributed by MLS Grid
- 2018-10-31 Listed $579,000 OneKey® MLS as Distributed by MLS Grid
Property tax history
+1.4%/yrLatest (2025): $18,054 · +1.0% YoY. Source: county tax records.
Cash-flow waterfall
monthlySold comps — $/sqft
last 12 mo · ≤1 miLoading sold comps…