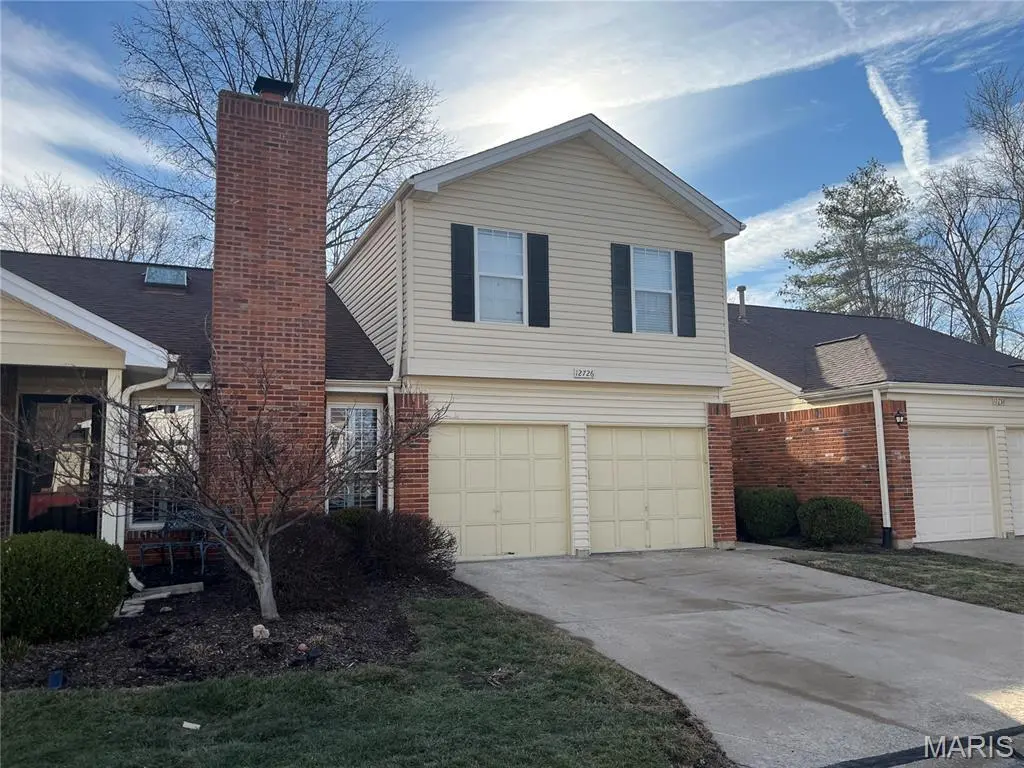
12726 Bennington Common Ln · Maryland Heights, MO
Flood risk 1/10 · Minimal
- FEMA flood zone
- X (unshaded)
- Chance of flooding over 30 yrs
- 0.0%
- Est. flood insurance / yr
- $473 – $860
Fire risk 1/10 · Minimal
- Est. fire insurance / yr
- $1,054 – $1,958
Heat risk 5/10 · Moderate
- Hot days now (above 106°F)
- 7 days/yr
- Hot days in 30 yrs
- 21 days/yr
Wind risk 2/10 · Minimal
- Chance of severe wind over 30 yrs
- 1.0%
Air-quality risk 2/10 · Minimal
- Unhealthy air days now
- 2 days/yr
- Unhealthy air days in 30 yrs
- 2 days/yr
Risk factors via First Street. Map © Google.
Why this score? — see what drove the C- grade
The composite is a weighted blend of 9 inputs, each scored 0–100. Each bar is that input's sub-score; the figure is the points it added to the 100-point composite (weight × sub-score).
- ARV discount +15.0/15.0
- Appreciation +10.0/10.0
- Cash flow +7.8/30.0
- Schools +5.1/10.0
- 1% rule +4.9/10.0
- Livability +3.6/5.0
- Condition / age +2.5/5.0
- DSCR +1.9/10.0
- Rent growth +1.8/5.0
$234,900
🖨 Deal sheet 📄 Offer letter ✓ Due diligence
Listing remarks MLS
Sherwood Manor townhome with two car garage; hardwood floors, skylights, wood burning fireplace, great room with vaulted ceiling. Primary suite includes double vanities, separate tub/shower and walk in closet. Two additional bedrooms and office nook upstairs. Dining room with sliding door to outdoor deck. ***This property is eligible under the Freddie Mac First Look Initiative through 05/07/2026. Seller will not complete any repairs to the subject property, either lender or buyer requested. The property is sold in AS IS condition. Pre-Approval letter or Proof of Funds required. Sale addendum and earnest money as certified funds will be required for final acceptance. Seller is open to concessions during negotiations. Concessions cannot exceed actual closing costs.
Key facts
- 3,049 sq ft lot
- 2 garage spots
- Built 1987
Neighborhood map
What this means for you Summary
Snapshot
- This is a 3-bed/2.5-bath single-family listed at $235k.
Deal economics
- At list price, monthly cash flow is $-258 ($-3k/yr) — negative.
- To cash-flow at today's rent, offer at most $189k (19.4% below list).
- To meet the 1% rule (rent ≥ 1% of price), the offer needs to be $232k (1.3% below list).
- Recommended offer: $189k (19.4% below list) — sets the bar for cash-flow.
Location & tenants
- Location reads 71/100 on livability (#101 in MO) — a middle-class / working-renter tenant base. Strengths: cost of living A+, housing A+, crime A-; Watch: health & safety C-, amenities F, commute F.
- Parkway C-2 (suburban): math 49% / reading 62% proficiency, ranked #18 of 324 in MO (top 6%) — acceptable for families but not a draw, mixed tenant base, ~2y average lease; only 14% free/reduced lunch — higher-income household profile.
- Market conditions: Rents soft (-3.0%/yr); 170 active listings in the ZIP; 11 comparable units currently listed for rent nearby; rentals leasing fast (median 4d on market — plan ~1-2 weeks tenant-placement turnaround); solid renter incomes; 920 units permitted in St. Louis County in 2024 (250 in 5+ unit buildings).
- This rent runs 33% of the median local income ($85k/yr) — at the standard rent-burdened threshold; future hikes will face affordability resistance.
Forward outlook
- In year one you build about $25k of equity ($2k loan paydown + $23k appreciation (10.0% local appreciation)).
- By year 2, paydown + projected appreciation supports a ~$40k cash-out refi (75% LTV) — recoverable capital for the next deal without selling this one.
Negotiation context
- It's been on market 72 days — a 6% lower offer ($221k) is reasonable based on typical stale-listing flexibility.
- 3 sale attempts since 5y ago; this cycle's ask has dropped $15k (6%) from the opening price — seller is motivated, your offer sets the floor, not the list.
Risks & watch-outs
- Watch-outs: HOA is 22% of rent.
- Climate carrying-cost: extreme-heat days projected 7→21/yr by 2055 (HVAC capex compounding) — expect insurance premiums to compound above CPI over the hold.
Questions for the listing agent
- What do current leases actually rent for vs. the listed asking? Can we see a recent rent roll and the last 12 months of T-12 income?
- It's been on market 72 days. Have you received any prior offers? Is the seller open to a 19% concession, seller financing, or rate buy-down credit?
- What does the HOA fee cover, when was the last increase, and are there any pending special assessments or reserve-fund shortfalls?
- Why hasn't it sold? Are there any deal-killer items the seller is aware of (foundation, flood, title, zoning, code violations)?
- Is there a deadline driving the sale (1031 exchange, divorce, estate, relocation)? That informs how much negotiation room exists.
- Schools are B-rated — typically a magnet for longer-tenancy family renters. What's the average tenant stay here, and is there a school-zone premium baked into asking?
- What's the average days-on-market for RENTAL listings here right now (not sales)? A rising rental-DOM trend means longer vacancies and softer asking-rent achievability than the comps imply.
- What's the recent tenant-quality profile in this submarket — average credit score on applications, eviction rate, late-payment / NSF rate, and stable-employment percentage? A property-management company in the area should have these aggregated.
- How much new for-sale + rental construction is in the pipeline within 1–3 miles? Heavy new supply typically softens prices + rents 12–24 months out; constrained supply supports both.
Investment metrics
- 1% rule
- 0.99% ✗
- Cap rate
- 4.98%
- Cash-on-cash
- -4.70%
- DSCR
- 0.79
- GRM
- 8.4
CMA / ARV
- ARV (median comp)
- $350,367
- List price
- $234,900
- Delta
- -32.96%
- Verdict
- UNDERPRICED
- Comps
- 20 within 1.0 mi
Show comp detail 12 sales within ~0.75 mi
| Address | Dist | Beds/Ba | Sqft | Sold | Price | $/sf | Match |
|---|---|---|---|---|---|---|---|
| 12792 Bennington Common Ln | 0.07mi | 3/3.0 | 1,720 (-1%) | 1mo | $265,000 | $154 | 93 |
| 1503 Papillon Dr | 0.63mi | 3/2.0 | 1,774 (+2%) | 3mo | $379,900 | $214 | 62 |
| 12853 Glenbernie Ln | 0.52mi | 3/2.0 | 1,649 (-5%) | 5mo | $295,000 | $179 | 62 |
| 12924 Midfield Ter | 0.57mi | 3/2.5 | 1,558 (-10%) | 3mo | $325,000 | $209 | 55 |
| 12597 Fee Fee Rd | 0.40mi | 3/2.0 | 1,949 (+13%) | 4mo | $270,000 | $139 | 55 |
| 12935 Polo Parc Dr | 0.59mi | 3/2.5 | 1,836 (+6%) | 10mo | $425,000 | $231 | 53 |
| 12929 Ballantine Ct | 0.50mi | 3/3.0 | 1,530 (-12%) | 7mo | $450,000 | $294 | 50 |
| 1559 Fontana Dr | 0.65mi | 3/2.0 | 1,887 (+9%) | 5mo | $334,500 | $177 | 49 |
| 2042 King Arthur Ct | 0.66mi | 3/3.0 | 1,500 (-13%) | 1mo | $299,900 | $200 | 44 |
| 12558 Pepperwood Dr | 0.51mi | 3/2.0 | 1,989 (+15%) | 7mo | $319,000 | $160 | 43 |
| 12558 Westport Dr | 0.57mi | 4/2.0 (+1) | 1,977 (+14%) | 5mo | $350,000 | $177 | 38 |
| 1312 Susanaire Cir | 0.68mi | 3/2.0 | 1,512 (-13%) | 9mo | $300,000 | $198 | 38 |
Match score weights: distance 35% · size 25% · config 20% · recency 20%. Top-matched comps best support the ARV.
Projected returns pro-forma
10.0% appreciation · 0.0% rent growth · sell at horizon
- IRR
- 19.9%
- Equity multiple
- 2.60×
- Total profit
- $105,051
- Equity at exit
- $211,617
- IRR
- 17.5%
- Equity multiple
- 5.72×
- Total profit
- $310,727
- Equity at exit
- $456,359
Cash invested: $65,772 (down + closing). Projections, not guarantees.
Landlord ↔ Tenant lean methodology
- Overall (STATE)
- 81 Strongly Landlord-Friendly
- State Missouri
- 81 Strongly Landlord-Friendly · R+10
- County
- — inherits STATE
- City
- — inherits STATE
ZIP-level market 63146
- Home prices YoY
- 4.9%
- Rents YoY
- -3.0%
- Active inventory
- 170
- Price-to-rent
- 8.4×
Monthly cashflow live
- Estimated rent
- $2,320 high interval (Pro) →
- Mortgage (P&I)
- −$1,232
- Tax from tax record
- −$255 /mo · $3,064/yr
- Insurance
- −$98
- HOA
- −$505
- Vacancy / Maint / Mgmt
- −$487
- Net cashflow
- $-258
Break-even live
UW: 25.0% down · 7.5% · 30yr · 1.5% tax · 5.0% vac · 8.0% maint · 8.0% mgmt
Financing live
Cash to close
- Down payment
- $58,725
- Closing costs
- $7,047
- Reserves months
- —
- Total cash needed
- —
Loan-product check · same deal, 3 products live
Conventional
25% down · 7.5% · 30yr
- Down + closing
- —
- Monthly P&I
- —
- Monthly cashflow
- —
- DSCR
- —
- Eligible?
- —
Personal DTI + credit; lowest rate.
DSCR
20% down · 8.5% · 30yr
- Down + closing
- —
- Monthly P&I
- —
- Monthly cashflow
- —
- DSCR
- —
- Eligible?
- —
No personal income docs; deal must DSCR.
Hard money
10% down · 12.0% · 12mo
- Down + closing
- —
- Monthly P&I
- —
- Monthly cashflow
- —
- DSCR
- —
- Eligible?
- —
Short-term bridge; refi at stabilization.
Rent comps 11 comps
| Address | Beds | Baths | Sqft | Rent | $/sqft | DOM | Units | Dist |
|---|---|---|---|---|---|---|---|---|
| 12806 Willowyck Dr Saint Louis, MO | 3.0 | 2.0 | 1456 | $2,500 | $1.72 | 43d | 1 | 0.15mi |
| 1951 Oberlin Dr St. Louis, MO | 1.0–3.0 | 1.0–2.5 | 993 | $2,128 | $2.14 | 1d | 23 | 0.49mi |
| 1895 Boulder Springs Dr St. Louis, MO | 1.0–3.0 | 1.0–2.5 | 1083 | $2,900 | $2.68 | 1d | 6 | 0.78mi |
| 12401 Boulder Springs Pkwy St. Louis, MO | 1.0–3.0 | 1.0–2.0 | 1006 | $2,867 | $2.85 | 1d | 10 | 0.86mi |
| 12545 Markaire Dr St. Louis, MO | 1.0–3.0 | 1.0–4.0 | 1420 | $2,695 | $1.90 | 10d | 5 | 0.88mi |
| 12533 Starspur Ln Saint Louis, MO | 4.0 | 4.0 | 1982 | $2,795 | $1.41 | 3d | 1 | 0.96mi |
| 12465 Larkwood Dr Saint Louis, MO | 3.0 | 2.0 | 1563 | $2,196 | $1.40 | 7d | 1 | 0.98mi |
| 1432 Glenmeade Dr Maryland Heights, MO | 3.0 | 2.0 | 1090 | $2,176 | $2.00 | 10d | 1 | 1.15mi |
| 1638 Prestonpark Ln Saint Louis, MO | 3.0 | 2.5 | 1734 | $2,610 | $1.51 | 43d | 1 | 1.19mi |
| 1003 Mariners Point Dr Creve Coeur, MO | 1.0–2.0 | 1.0–1.5 | 942 | $1,815 | $1.93 | 1d | 7 | 1.29mi |
| 2050 Lakerun Ct Maryland Heights, MO | 1.0–3.0 | 1.0–2.5 | 1213 | $2,180 | $1.80 | 1d | 15 | 1.30mi |
HOA detail
- Monthly dues
- $505 · $6,060/yr
Listing history 21 events
-
2026-06-18days on market $234,900 Active 72 DOM
-
2026-06-17days on market $234,900 Active 71 DOM
-
2026-06-16days on market $234,900 Active 70 DOM
-
2026-06-15days on market $234,900 Active 69 DOM
-
2026-06-13days on market $234,900 Active 67 DOM
-
2026-06-13days on market $234,900 Active 66 DOM
-
2026-06-09days on market $234,900 Active 63 DOM
-
2026-06-08days on market $234,900 Active 62 DOM
-
2026-06-07days on market $234,900 Active 61 DOM
-
2026-06-03days on market $234,900 Active 57 DOM
-
2026-06-02days on market $234,900 Active 56 DOM
-
2026-06-01days on market $234,900 Active 55 DOM
-
2026-05-31days on market $234,900 Active 54 DOM
-
2026-04-07$249,900 Active 778-char remark
Show marketing remark (778 chars)
Sherwood Manor townhome with two car garage; hardwood floors, skylights, wood burning fireplace, great room with vaulted ceiling. Primary suite includes double vanities, separate tub/shower and walk in closet. Two additional bedrooms and office nook upstairs. Dining room with sliding door to outdoor deck. ***This property is eligible under the Freddie Mac First Look Initiative through 05/07/2026. Seller will not complete any repairs to the subject property, either lender or buyer requested. The property is sold in AS IS condition. Pre-Approval letter or Proof of Funds required. Sale addendum and earnest money as certified funds will be required for final acceptance. Seller is open to concessions during negotiations. Concessions cannot exceed actual closing costs.
-
2025-12-24$1 Active
-
2021-03-23soldstatus $235,000
-
2021-03-17soldstatus Closed
-
2021-02-22historical Active Under Contract
-
2021-02-18$229,900 Active
-
2021-02-05historical $229,900
-
1998-07-24soldstatus
ⓘ Source: listings_history table (triggers on properties + properties_extension) + one-shot
backfill from property_details.listing_events for pre-trigger history.
Tax reassessment forecast MO · Resets to sale price
- Current annual tax
- $3,064 · $255/mo
- Projected year-2 tax
- $3,064 · $255/mo
- Expected delta
- $0/yr ($0/mo · 0.0%)
ⓘ Screening estimate from a state-policy table — verify with the county assessor before closing.
Climate risk First Street
- Flood 1/10 Low FEMA zone X (unshaded) · 0% chance over 30 yrs
- Wildfire 1/10 Low
- Heat 5/10 Major 7 d/yr ≥106°F today · 21 d/yr by 30 yrs out
- Wind 2/10 Low 100% chance of damaging wind over 30 yrs
- Air quality 2/10 Low 2 unhealthy d/yr today · 2 by 30 yrs out
Nearby sold comps map
Loading sold comps map…
Walkable amenities ~0.75 mi
Loading nearby amenities…
Taxation est. · year 1
- Rental income
- $27,835
- − Mortgage interest
- −$13,158
- − Property taxes
- −$3,064
- − Insurance
- −$1,174
- − Repairs & maintenance
- −$2,227
- − Management
- −$2,227
- − HOA
- −$6,060
- − Depreciation
- −$6,833
- Taxable loss
- −$6,909
- Est. tax savings @ 24.0%
- +$1,658
- After-tax cash flow
- $-1,433/yr
For passive investors: Depreciation is non-cash, so a rental often shows a tax loss while cash-flowing — sheltering income. Rental losses are passive: they offset passive income freely, and up to $25,000/yr can offset ordinary (W-2) income if you actively participate and your MAGI is under $100k (phasing out to $0 by $150k); unused losses carry forward. On sale, claimed depreciation is recaptured at up to 25%, and gains may owe capital-gains tax (a 1031 exchange can defer both). Figures are a year-1 estimate at your 24.0% rate — not tax advice; consult a CPA.
Schools (NCES district)
- District
- Parkway C-2
- NCES district ID
- 2923580
- Math proficiency
- 49% ▼ -11.00%
- Reading proficiency
- 62% ▼ -2.00%
- Median HH income
- $83,551
- Composite
- 50.5/100
- National rank
- #1851
- State rank
- #18 of 324 in MO
Livability — Maryland Heights
- Score
- 71/100
- State rank
- #101
- US rank
- #6808
Category grades
Schools grade is shown separately in the Schools card above.
Census & demographics
- County
- Saint Louis County · 888,823 people
- City population
- 21,924
- Metro
- St. Louis, MO-IL
- Population (ZIP)
- 30,678
- Household income
- $84,756
- Rent vs Own
- Severe rent burden
- 1156.0
Population outlook (St. Louis County) Hauer SSP2
- Today (2025)
- 1,025,227 people
- By 2030
- 1,028,023 · +0.3%
- By 2040
- 1,020,940 · -0.4%
- By 2050
- 1,007,280 · -1.8%
- By 2075
- 987,277 · -3.7%
- By 2100
- 921,984 · -10.1%
Race, ethnicity, and origin ACS 2023
- Neighborhood character
- Diverse neighborhood (Simpson 0.56)
- Race & ethnicity
- White 63% Asian 17% Black 13% Two or more races 4% Hispanic / Latino 3%
- Common ancestry
- Scotch-Irish 3% Romanian 3% Italian 2%
- Foreign-born
- 19% · China, South Korea, Canada
- Languages at home
- 79% English-only · Other Asian/Pacific 7% Other Indo-European 4% Chinese 3%
Political lean MEDSL · St. Louis
- 2024 margin
- Strong D (+23.4) · D 60.8% · R 37.4% · Other 1.7%
- 2008→2024 swing
- +3.5pp toward D · 2008: 19.9pp · 2024: 23.4pp
- All cycles
- 2024: D+23.4 2020: D+24.0 2016: D+16.2 2012: D+13.7 2008: D+19.9
Not yet ingested
- Civics
- —
Market trends
- HPI YoY
- ▲ 33.10%
- Current HPI
- 711.49
- Rent YoY
- ▼ -2.96%
- Metro
- St. Louis, MO-IL
- State GDP YoY
- ▲ 1.84%
- F500 in state
- 20
Industry mix (Fortune 500 HQ in MO)
| Industry | F500 HQs | Revenue |
|---|---|---|
| Healthcare | 1 | $163B |
|
||
| Insurance | 1 | $21B |
|
||
| Industrial Technology | 1 | $17B |
|
||
| Retail | 1 | $16B |
|
||
| Industrial Distribution | 1 | $10B |
|
||
| Utilities | 1 | $9B |
|
||
Price history
+8.7% since first listed8 events — show timeline
- 2026-04-07 Listed $249,900 MARIS as Distributed by MLS Grid
- 2025-12-24 Listed $1 MARIS as Distributed by MLS Grid
- 2021-03-23 Sold (Public Records) $235,000 Public Records
- 2021-03-17 Sold (MLS) — MARIS as Distributed by MLS Grid
- 2021-02-22 Contingent — MARIS as Distributed by MLS Grid
- 2021-02-18 Listed $229,900 MARIS as Distributed by MLS Grid
- 2021-02-05 Coming Soon $229,900 MARIS as Distributed by MLS Grid
- 1998-07-24 Sold (Public Records) — Public Records
Property tax history
+4.8%/yrLatest (2022): $3,064 · +0.7% YoY. Source: county tax records.
Cash-flow waterfall
monthlySold comps — $/sqft
last 12 mo · ≤1 miLoading sold comps…