63 Mundt St Unit B · Denison, TX
Flood risk 1/10 · Minimal
- FEMA flood zone
- X (unshaded)
- Chance of flooding over 30 yrs
- 0.0%
- Est. flood insurance / yr
- $507 – $1,088
Fire risk 7/10 · Major
- Est. fire insurance / yr
- $1,222 – $2,270
Heat risk 6/10 · Moderate
- Hot days now (above 107°F)
- 7 days/yr
- Hot days in 30 yrs
- 20 days/yr
Wind risk 4/10 · Minor
- Chance of severe wind over 30 yrs
- 18.0%
Air-quality risk 3/10 · Minor
- Unhealthy air days now
- 2 days/yr
- Unhealthy air days in 30 yrs
- 3 days/yr
Risk factors via First Street. Map © Google.
Why this score? — see what drove the C- grade
The composite is a weighted blend of 9 inputs, each scored 0–100. Each bar is that input's sub-score; the figure is the points it added to the 100-point composite (weight × sub-score).
- Cash flow +21.6/30.0
- ARV discount +7.5/15.0
- DSCR +6.9/10.0
- 1% rule +5.9/10.0
- Livability +3.7/5.0
- Schools +2.9/10.0
- Rent growth +2.5/5.0
- Condition / age +2.5/5.0
- Appreciation +0.0/10.0
$149,500
🖨 Deal sheet (PDF) 📄 Offer letter ✓ Due diligence
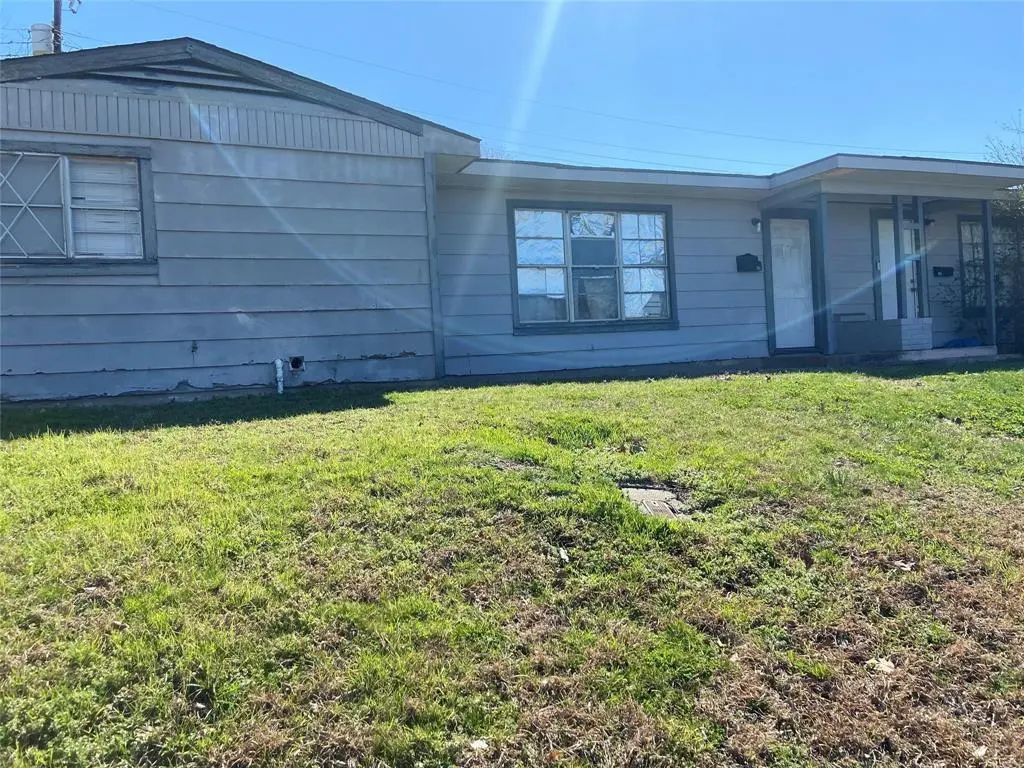
Listing remarks
Income-producing duplex offering a great investment opportunity. Each unit features 2 bedrooms and 1 bathroom, with a functional layout, hardwood flooring, and vinyl throughout. The kitchens are equipped with electric cooktops and refrigerators, with tile flooring for easy maintenance. Both units offer plenty of natural light and are finished with neutral gray paint and white trim for a clean, modern feel. Both units are currently leased for $950 per month, providing steady rental income from day one. This property is part of a larger portfolio opportunity. Contact the listing agent for more details. buyers and buyers agent verify all information
Key facts
- Hardwood flooring
- Vinyl flooring
- Electric cooktops
Tags
Property features AI
Finance
- Other: Lot approximately 0.27 acres; Single building on the parcel; Unit count: 2
- Financial info: 2-unit building (duplex); Gross annual income: $22,800; Gross annual expenses listed as $0
- HOA & community: No association
Exterior
- Parking: 1 parking space
- Security:
- Utilities: City water; City sewer; No municipal utility district
- Home design: Duplex (residential income); One story
- Construction: Wood construction; Composition roof; Slab foundation; Built in 1945
- Exterior features: On-site parking
Interior
- Kitchen: Electric oven
- Bedrooms: 4 bedrooms
- Flooring: Hardwood; Luxury vinyl plank
- Bathrooms: 2 full bathrooms
- Heating & cooling: Central heating; Central air conditioning
- Interior features: Other interior features
- Laundry & utility:
Neighborhood map
What this means for you Summary
Snapshot
- This is a 4-bed/2.0-bath other listed at $150k.
Deal economics
- At list price, monthly cash flow is $226 ($3k/yr) — positive.
- The deal already cash-flows at list — no discount required.
- Meets the 1% rule at list price ($2k rent vs $150k).
- Recommended offer: $141k (6.0% below list) — sets the bar for market timing.
- Cap rate 8.1% vs local median 3.9% in Denison — top-decile yield for the area; either an underpriced asset or a hidden risk that comps aren't pricing in. Stress-test before assuming the spread holds.
Location & tenants
- Location reads 73/100 on livability (#221 in TX) — a middle-class / working-renter tenant base. Strengths: cost of living A+, housing A+, crime A; Watch: health & safety D+, amenities F, commute F.
- Sherman ISD (urban): math 31% / reading 37% proficiency, ranked #546 of 826 in TX (top 66%) — families likely to look elsewhere, expect single-tenant / working-renter base with shorter leases.
- Zoned schools: Percy W Neblett El (math 27% / reading 32%, grade F, #2,525 of 4,322 statewide, top 62%, 559 students, 70% FRL); Piner Middle (math 31% / reading 41%, grade F, #805 of 1,662 statewide, top 50%, 818 students, 75% FRL); Sherman H S (math 28% / reading 44%, grade F, #930 of 1,632 statewide, top 57%, 2,155 students, 70% FRL).
- Market conditions: Rents flat; 492 active listings in the ZIP; 2 comparable units currently listed for rent nearby; 2,272 units permitted in Grayson County in 2024 (750 in 5+ unit buildings).
Forward outlook
- Local home prices are declining (-3.0%/yr); year-one equity from $1k of loan paydown is wiped out by about $4k of value loss. Plan a longer hold.
- Grayson County population projected at +12% by 2050 — modest demand growth; plan on rents tracking national, not racing it.
Negotiation context
- It's been on market 62 days — a 6% lower offer ($141k) is reasonable based on typical stale-listing flexibility.
- 3 sale attempts since 2y ago; this cycle's ask has dropped $30k (16%) from the opening price — seller is motivated, your offer sets the floor, not the list.
Risks & watch-outs
- Watch-outs: built in 1945 — expect roof / HVAC / electrical / plumbing capex.
- Climate carrying-cost: major wildfire risk; extreme-heat days projected 7→20/yr by 2055 (HVAC capex compounding) — expect insurance premiums to compound above CPI over the hold.
Questions for the listing agent
- It's been on market 62 days. Have you received any prior offers? Is the seller open to a 6% concession, seller financing, or rate buy-down credit?
- Built in 1945 — when were the roof, HVAC, electrical panel, plumbing, and water heater last replaced?
- Why hasn't it sold? Are there any deal-killer items the seller is aware of (foundation, flood, title, zoning, code violations)?
- Is there a deadline driving the sale (1031 exchange, divorce, estate, relocation)? That informs how much negotiation room exists.
- Schools are D-rated, which usually means shorter tenancies and higher turnover. Who's the typical renter profile here, and what's been the actual vacancy rate?
- What's the average days-on-market for RENTAL listings here right now (not sales)? A rising rental-DOM trend means longer vacancies and softer asking-rent achievability than the comps imply.
- What's the recent tenant-quality profile in this submarket — average credit score on applications, eviction rate, late-payment / NSF rate, and stable-employment percentage? A property-management company in the area should have these aggregated.
- How much new for-sale + rental construction is in the pipeline within 1–3 miles? Heavy new supply typically softens prices + rents 12–24 months out; constrained supply supports both.
Investment metrics
- 1% rule
- 1.09% ✓
- Cap rate
- 8.11%
- Cash-on-cash
- 6.48%
- DSCR
- 1.29
- GRM
- 7.7
CMA / ARV
No comps found within radius.
Projected returns pro-forma
-3.0% appreciation · 0.05% rent growth · sell at horizon
- IRR
- -9.8%
- Equity multiple
- 0.65×
- Total profit
- $-14,469
- Equity at exit
- $22,291
- IRR
- -5.1%
- Equity multiple
- 0.71×
- Total profit
- $-12,011
- Equity at exit
- $12,926
Cash invested: $41,860 (down + closing). Projections, not guarantees.
Landlord ↔ Tenant lean methodology
- Overall (STATE)
- 87 Strongly Landlord-Friendly
- State Texas
- 87 Strongly Landlord-Friendly · R+5
- County
- — inherits STATE
- City
- — inherits STATE
ZIP-level market 75020
- Rents YoY
- 0.1%
- Active inventory
- 492
- Price-to-rent
- 7.7×
Monthly cashflow live
- Estimated rent
- $1,624 medium interval (Pro) →
- Mortgage (P&I)
- −$784
- Tax from tax record
- −$211 /mo · $2,526/yr
- Insurance
- −$62
- HOA
- −$0
- Vacancy / Maint / Mgmt
- −$341
- Net cashflow
- $226
Break-even live
Sensitivity live
| Price | -10% $311 | -5% $268 | +0% $226 | +5% $184 | +10% $141 |
|---|---|---|---|---|---|
| Rent | -10% $98 | -5% $162 | +0% $226 | +5% $290 | +10% $354 |
| Rate | -1.0pp $301 | -0.5pp $264 | base $226 | +0.5pp $187 | +1.0pp $148 |
UW: 25.0% down · 7.5% · 30yr · 1.5% tax · 5.0% vac · 8.0% maint · 8.0% mgmt
Financing live
Cash to close
- Down payment
- $37,375
- Closing costs
- $4,485
- Reserves months
- —
- Total cash needed
- —
Loan-product check · same deal, 3 products live
Conventional
25% down · 7.5% · 30yr
- Down + closing
- —
- Monthly P&I
- —
- Monthly cashflow
- —
- DSCR
- —
- Eligible?
- —
Personal DTI + credit; lowest rate.
DSCR
20% down · 8.5% · 30yr
- Down + closing
- —
- Monthly P&I
- —
- Monthly cashflow
- —
- DSCR
- —
- Eligible?
- —
No personal income docs; deal must DSCR.
Hard money
10% down · 12.0% · 12mo
- Down + closing
- —
- Monthly P&I
- —
- Monthly cashflow
- —
- DSCR
- —
- Eligible?
- —
Short-term bridge; refi at stabilization.
Rent comps 2 comps
| Address | Beds | Baths | Sqft | Rent | $/sqft | DOM | Units | Dist |
|---|---|---|---|---|---|---|---|---|
| 62 Pershing Dr Unit 1 Denison, TX | 3.0 | 2.0 | 1650 | $950 | $0.58 | 23d | 1 | 0.04mi |
| 7 Pershing Dr Unit A Denison, TX | 3.0 | 1.0 | 2256 | $1,050 | $0.47 | 23d | 1 | 0.13mi |
Listing history 25 events
-
2026-06-21days on market $149,500 Active 62 DOM
-
2026-06-19days on market $149,500 Active 60 DOM
-
2026-06-18days on market $149,500 Active 59 DOM
-
2026-06-17days on market $149,500 Active 58 DOM
-
2026-06-16days on market $149,500 Active 57 DOM
-
2026-06-15days on market $149,500 Active 56 DOM
-
2026-06-14days on market $149,500 Active 54 DOM
-
2026-06-13days on market $149,500 Active 53 DOM
-
2026-06-10days on market $149,500 Active 51 DOM
-
2026-06-09days on market $149,500 Active 50 DOM
-
2026-06-08days on market $149,500 Active 49 DOM
-
2026-06-07days on market $149,500 Active 48 DOM
-
2026-06-03days on market $149,500 Active 44 DOM
-
2026-06-02days on market $149,500 Active 43 DOM
-
2026-06-01days on market $149,500 Active 42 DOM
-
2026-05-31days on market $149,500 Active 41 DOM
-
2026-05-30days on market $149,500 Active 40 DOM
-
2026-04-20$179,000 Active 663-char remark
-
2025-10-31historical
-
2025-01-10price $213,000
-
2024-07-29$216,000 Active
-
2024-07-26historical
-
2024-05-11price $216,150
-
2024-03-23$218,650 Active
-
2007-03-05soldstatus
ⓘ Source: listings_history table (triggers on properties + properties_extension) + one-shot
backfill from property_details.listing_events for pre-trigger history.
Tax reassessment forecast TX · Resets to sale price
- Current annual tax
- $2,526 · $211/mo
- Projected year-2 tax
- $2,736 · $228/mo
- Expected delta
- +$210/yr (+$17/mo · 8.3%)
ⓘ Screening estimate from a state-policy table — verify with the county assessor before closing.
Climate risk First Street
- Flood 1/10 Low FEMA zone X (unshaded) · 0% chance over 30 yrs
- Wildfire 7/10 Severe
- Heat 6/10 Major 7 d/yr ≥107°F today · 20 d/yr by 30 yrs out
- Wind 4/10 Moderate 18% chance of damaging wind over 30 yrs
- Air quality 3/10 Moderate 2 unhealthy d/yr today · 3 by 30 yrs out
Nearby sold comps map
Loading sold comps map…
Walkable amenities ~0.75 mi
Loading nearby amenities…
Taxation est. · year 1
- Rental income
- $19,487
- − Mortgage interest
- −$8,374
- − Property taxes
- −$2,526
- − Insurance
- −$748
- − Repairs & maintenance
- −$1,559
- − Management
- −$1,559
- − Depreciation
- −$4,349
- Taxable income
- $372
- Est. tax owed @ 24.0%
- −$89
- After-tax cash flow
- $2,624/yr
For passive investors: Depreciation is non-cash, so a rental often shows a tax loss while cash-flowing — sheltering income. Rental losses are passive: they offset passive income freely, and up to $25,000/yr can offset ordinary (W-2) income if you actively participate and your MAGI is under $100k (phasing out to $0 by $150k); unused losses carry forward. On sale, claimed depreciation is recaptured at up to 25%, and gains may owe capital-gains tax (a 1031 exchange can defer both). Figures are a year-1 estimate at your 24.0% rate — not tax advice; consult a CPA.
Schools (NCES district)
- District
- Sherman ISD
- NCES district ID
- 4840080
- Math proficiency
- 31% ▼ -9.00%
- Reading proficiency
- 37% ▼ -2.00%
- Median HH income
- $42,587
- Composite
- 28.79/100
- National rank
- #6665
- State rank
- #546 of 826 in TX
Livability — Denison
- Score
- 73/100
- State rank
- #221
- US rank
- #5428
Category grades
Schools grade is shown separately in the Schools card above.
Census & demographics
- Census place
- Denison, TX
- County
- Grayson County · 108,053 people
- City population
- 34,008
- Metro
- Sherman-Denison, TX
- Population (ZIP)
- 24,835
- Household income
- $71,605
- Rent vs Own
- Severe rent burden
- 997.0
Population outlook (Grayson County) Hauer SSP2
- Today (2025)
- 134,540 people
- By 2030
- 138,653 · +3.1%
- By 2040
- 145,958 · +8.5%
- By 2050
- 151,218 · +12.4%
- By 2075
- 161,802 · +20.3%
- By 2100
- 159,036 · +18.2%
Race, ethnicity, and origin ACS 2023
- Neighborhood character
- Predominantly White (73%)
- Race & ethnicity
- White 73% Hispanic / Latino 13% Two or more races 9% Black 6%
- Hispanic origin (detail)
- Mexican 11%
- Common ancestry
- Slovak 5% Serbian 2% Portuguese 2%
- Foreign-born
- 4% · Canada
- Languages at home
- 93% English-only · Spanish 6%
Political lean MEDSL · Grayson
- 2024 margin
- Solid R (+54.3) · D 22.5% · R 76.7%
- 2008→2024 swing
- -16.4pp toward R · 2008: -37.9pp · 2024: -54.3pp
- All cycles
- 2024: R+54.3 2020: R+49.9 2016: R+53.1 2012: R+48.0 2008: R+37.9
Not yet ingested
- Civics
- —
Market trends
- HPI YoY
- ▼ -295.96%
- Current HPI
- 257.1806
- Rent YoY
- ▬ 0.05%
- Metro
- Sherman-Denison, TX
- State GDP YoY
- ▲ 3.95%
- F500 in state
- 110
Industry mix (Fortune 500 HQ in TX)
| Industry | F500 HQs | Revenue |
|---|---|---|
| Energy | 16 | $1,198B |
|
||
| Technology | 5 | $198B |
|
||
| Engineering / Construction | 4 | $72B |
|
||
| Energy Services | 3 | $60B |
|
||
| Utilities | 3 | $41B |
|
||
| Healthcare | 2 | $330B |
|
||
Price history
-31.6% since first listed9 events — show timeline
- 2026-05-21 Price Changed $149,500 NTREIS
- 2026-04-20 Listed $179,000 NTREIS
- 2025-10-31 Listing Removed — NTREIS
- 2025-01-10 Price Changed $213,000 NTREIS
- 2024-07-29 Listed $216,000 NTREIS
- 2024-07-26 Listing Removed — NTREIS
- 2024-05-11 Price Changed $216,150 NTREIS
- 2024-03-23 Listed $218,650 NTREIS
- 2007-03-05 Sold (Public Records) — Public Records
Property tax history
+3.9%/yrLatest (2025): $2,526 · -15.8% YoY. Source: county tax records.
Cash-flow waterfall
monthlySold comps — $/sqft
last 12 mo · ≤1 miLoading sold comps…