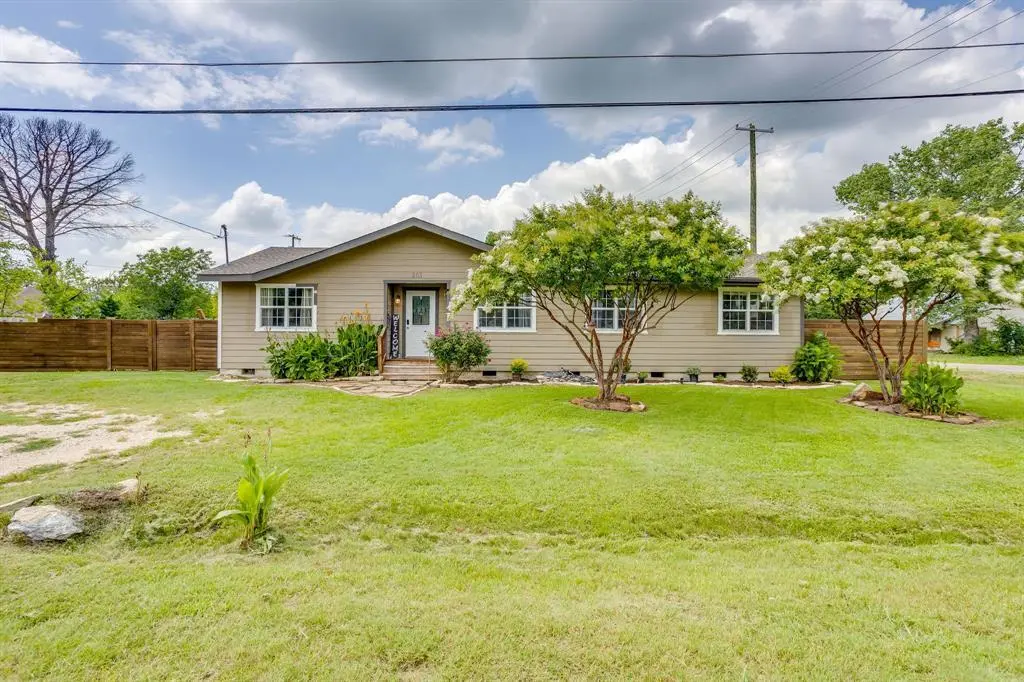
203 E Henderson St · Itasca, TX
Flood risk 3/10 · Minor
- FEMA flood zone
- X (unshaded)
- Chance of flooding over 30 yrs
- 0.2%
- Est. flood insurance / yr
- $507 – $1,088
Fire risk 5/10 · Moderate
- Est. fire insurance / yr
- $1,222 – $2,270
Heat risk 7/10 · Major
- Hot days now (above 109°F)
- 7 days/yr
- Hot days in 30 yrs
- 22 days/yr
Wind risk 6/10 · Moderate
- Chance of severe wind over 30 yrs
- 27.0%
Air-quality risk 2/10 · Minimal
- Unhealthy air days now
- 1 days/yr
- Unhealthy air days in 30 yrs
- 2 days/yr
Risk factors via First Street. Map © Google.
Why this score? — see what drove the D grade
The composite is a weighted blend of 9 inputs, each scored 0–100. Each bar is that input's sub-score; the figure is the points it added to the 100-point composite (weight × sub-score).
- Cash flow +10.1/30.0
- Appreciation +10.0/10.0
- ARV discount +6.7/15.0
- Livability +3.2/5.0
- DSCR +2.9/10.0
- 1% rule +2.7/10.0
- Rent growth +2.5/5.0
- Schools +2.5/10.0
- Condition / age +2.5/5.0
$220,000
🖨 Deal sheet (PDF) 📄 Offer letter ✓ Due diligence
Listing remarks MLS
Are you in need of an affordable 4 bedroom house? Fit all of the family in this 4 bed 2 bath! Master bedroom features an ensuite with jetted tub. 6 Mini split HVAC systems installed throughout to help target climate control for each room. Back yard deck leads you to a large 14x32 workshop that can be used for storage or possibly a craft room. New siding, new windows, some plumbing upgrades, and newer flooring in living areas and master. You will enjoy the small town living in Itasca located less than an hour from DFW metroplex! This is NOT a mobile home.
Key facts
- New siding
- Backyard deck
- New roof
Tags
Property features AI
Finance
- Other: Lot is less than 0.5 acre (approximately 0.161 acre); Soil type: black; Subdivision: Itasca Ot
- Financial info: Accepts cash and conventional financing; Second mortgage: no
- HOA & community: No association
Exterior
- Parking: Gravel parking
- Utilities: City water; City sewer; Municipal utility district: no
- Home design: Single-family residence (residential); Single story (one level); Property attached: yes
- Construction: Built in 1987
- Exterior features: Covered deck; Other exterior features; Wood fencing, fenced yard; Workshop with electricity
Interior
- Kitchen: Electric range; Built-in cabinets; Solid surface (non-natural) countertops
- Bedrooms: 3 bedrooms — all on the main level; Primary bedroom with ensuite bath, walk-in closet and custom closet system; Two additional bedrooms on the main level
- Bathrooms: 2 full bathrooms
- Heating & cooling: Electric cooling with wall/window units; Other heating
- Interior features: High speed internet available; One living area; One dining area; Total of 9 rooms
- Laundry & utility: Utility room on main level
Neighborhood map
What this means for you Summary
Snapshot
- This is a 3-bed/2.0-bath single-family listed at $220k.
Deal economics
- At list price, monthly cash flow is $-130 ($-2k/yr) — negative.
- To cash-flow at today's rent, offer at most $197k (10.4% below list).
- To meet the 1% rule (rent ≥ 1% of price), the offer needs to be $170k (22.5% below list).
- Recommended offer: $170k (22.5% below list) — sets the bar for 1% rule.
Location & tenants
- Location reads 63/100 on livability (#832 in TX) — a middle-class / working-renter tenant base. Strengths: cost of living A+, housing A+, crime A-; Watch: employment D, amenities F, commute F.
- Itasca ISD (rural): math 23% / reading 35% proficiency, ranked #636 of 826 in TX (top 77%) — low school quality limits family demand, transient renter base, plan for 1-2y turnover; 63% free/reduced lunch — lower-income household profile, screen leases tightly.
- Zoned schools: Itasca El (math 17% / reading 32%, grade F, #3,052 of 4,322 statewide, top 74%, 295 students, 74% FRL); Itasca Middle (math 32% / reading 32%, grade F, #971 of 1,662 statewide, top 60%, 164 students, 62% FRL); Itasca H S (math 15% / reading 44%, grade F, #1,106 of 1,632 statewide, top 68%, 192 students, 59% FRL) — zoned schools at 65% FRL track the district average.
- Market conditions: 85 active listings in the ZIP; 4 comparable units currently listed for rent nearby; rentals lingering (median 46d on market — plan ~5-8 weeks vacancy on turnover, expect pricing pressure); 75% of comp listings sitting > 30 days — soft ceiling on asking rent; 65 units permitted in Hill County in 2024 (0 in 5+ unit buildings).
Forward outlook
- In year one you build about $24k of equity ($2k loan paydown + $22k appreciation (10.0% local appreciation)).
- Hill County population projected at -12% by 2050 — secular population decline; favor cash flow + early exit over multi-decade hold.
- By year 2, paydown + projected appreciation supports a ~$38k cash-out refi (75% LTV) — recoverable capital for the next deal without selling this one.
Negotiation context
- Only 3 days on market — expect competitive offers; lowballing is unlikely to land.
- 3 sale attempts since 4y ago with the ask held roughly flat each time — persistent listings suggest the price (not the market) is what's stuck; bring a comps-based counter.
Risks & watch-outs
- Climate carrying-cost: major wind risk, 27% chance of damaging wind over 30y; moderate wildfire risk; extreme-heat days projected 7→22/yr by 2055 (HVAC capex compounding) — expect insurance premiums to compound above CPI over the hold.
Questions for the listing agent
- What do current leases actually rent for vs. the listed asking? Can we see a recent rent roll and the last 12 months of T-12 income?
- Is there a deadline driving the sale (1031 exchange, divorce, estate, relocation)? That informs how much negotiation room exists.
- Schools are D-rated, which usually means shorter tenancies and higher turnover. Who's the typical renter profile here, and what's been the actual vacancy rate?
- The area grade is low — what's the realistic commute time and amenity access for the typical tenant pool here? Any planned neighborhood developments (good or bad) we should know about?
- What's the average days-on-market for RENTAL listings here right now (not sales)? A rising rental-DOM trend means longer vacancies and softer asking-rent achievability than the comps imply.
- What's the recent tenant-quality profile in this submarket — average credit score on applications, eviction rate, late-payment / NSF rate, and stable-employment percentage? A property-management company in the area should have these aggregated.
- How much new for-sale + rental construction is in the pipeline within 1–3 miles? Heavy new supply typically softens prices + rents 12–24 months out; constrained supply supports both.
Investment metrics
- 1% rule
- 0.77% ✗
- Cap rate
- 5.58%
- Cash-on-cash
- -2.53%
- DSCR
- 0.89
- GRM
- 10.8
CMA / ARV
- ARV (on-the-fly)
- $216,150
- Comps found
- 12
Show comp detail 12 sales within ~0.75 mi
| Address | Dist | Beds/Ba | Sqft | Sold | Price | $/sf | Match |
|---|---|---|---|---|---|---|---|
| 205 E South St | 0.08mi | 3/2.0 | 1,462 (+2%) | 8mo | $219,900 | $150 | 88 |
| 202 E Henderson St | 0.03mi | 3/2.0 | 1,485 (+3%) | 13mo | $198,000 | $133 | 83 |
| 105 E North St | 0.31mi | 3/2.0 | 1,500 (+4%) | 2mo | $158,000 | $105 | 77 |
| 604 E South St | 0.27mi | 3/2.0 | 1,534 (+6%) | 3mo | $249,999 | $163 | 74 |
| 705 E South St | 0.38mi | 3/2.0 | 1,430 (-1%) | 10mo | $214,900 | $150 | 73 |
| 106 Don Ln | 0.31mi | 3/2.0 | 1,400 (-3%) | 13mo | $225,000 | $161 | 70 |
| 104 Don Ln | 0.31mi | 3/2.0 | 1,400 (-3%) | 14mo | $225,000 | $161 | 69 |
| 512 Don Ln | 0.39mi | 3/2.0 | 1,501 (+4%) | 8mo | $249,900 | $166 | 68 |
| 103 S Hooks St | 0.42mi | 3/2.0 | 1,416 (-2%) | 12mo | $282,000 | $199 | 68 |
| 526 Don Ln | 0.41mi | 4/2.0 (+1) | 1,401 (-3%) | 10mo | $182,990 | $131 | 63 |
| 104 Beard Dr | 0.41mi | 3/2.5 | 1,562 (+8%) | 3mo | $130,000 | $83 | 63 |
| 104 S College St | 0.32mi | 3/1.0 | 1,232 (-14%) | 9mo | $99,999 | $81 | 50 |
Match score weights: distance 35% · size 25% · config 20% · recency 20%. Top-matched comps best support the ARV.
Projected returns pro-forma
10.0% appreciation · 3.0% rent growth · sell at horizon
- IRR
- 22.5%
- Equity multiple
- 2.81×
- Total profit
- $111,549
- Equity at exit
- $198,193
- IRR
- 20.1%
- Equity multiple
- 6.44×
- Total profit
- $334,993
- Equity at exit
- $427,412
Cash invested: $61,600 (down + closing). Projections, not guarantees.
Landlord ↔ Tenant lean methodology
- Overall (STATE)
- 87 Strongly Landlord-Friendly
- State Texas
- 87 Strongly Landlord-Friendly · R+5
- County
- — inherits STATE
- City
- — inherits STATE
ZIP-level market 76055
- Home prices YoY
- 4.1%
- Active inventory
- 85
- Price-to-rent
- 10.8×
Monthly cashflow live
- Estimated rent
- $1,705 medium interval (Pro) →
- Mortgage (P&I)
- −$1,154
- Tax from tax record
- −$231 /mo · $2,773/yr
- Insurance
- −$92
- HOA
- −$0
- Vacancy / Maint / Mgmt
- −$358
- Net cashflow
- $-130
Break-even live
Sensitivity live
| Price | -10% $-5 | -5% $-68 | +0% $-130 | +5% $-192 | +10% $-254 |
|---|---|---|---|---|---|
| Rent | -10% $-264 | -5% $-197 | +0% $-130 | +5% $-62 | +10% $5 |
| Rate | -1.0pp $-19 | -0.5pp $-74 | base $-130 | +0.5pp $-187 | +1.0pp $-245 |
UW: 25.0% down · 7.5% · 30yr · 1.5% tax · 5.0% vac · 8.0% maint · 8.0% mgmt
Financing live
Cash to close
- Down payment
- $55,000
- Closing costs
- $6,600
- Reserves months
- —
- Total cash needed
- —
Loan-product check · same deal, 3 products live
Conventional
25% down · 7.5% · 30yr
- Down + closing
- —
- Monthly P&I
- —
- Monthly cashflow
- —
- DSCR
- —
- Eligible?
- —
Personal DTI + credit; lowest rate.
DSCR
20% down · 8.5% · 30yr
- Down + closing
- —
- Monthly P&I
- —
- Monthly cashflow
- —
- DSCR
- —
- Eligible?
- —
No personal income docs; deal must DSCR.
Hard money
10% down · 12.0% · 12mo
- Down + closing
- —
- Monthly P&I
- —
- Monthly cashflow
- —
- DSCR
- —
- Eligible?
- —
Short-term bridge; refi at stabilization.
Rent comps 4 comps
| Address | Beds | Baths | Sqft | Rent | $/sqft | DOM | Units | Dist |
|---|---|---|---|---|---|---|---|---|
| 202 E Henderson St Itasca, TX | 3.0 | 2.0 | 1485 | $1,750 | $1.18 | 0d | 1 | 0.05mi |
| 108 E Adams St Itasca, TX | 3.0 | 2.0 | 1188 | $1,650 | $1.39 | 45d | 1 | 0.12mi |
| 106 W Adams St Itasca, TX | 3.0 | 2.0 | 1174 | $1,650 | $1.41 | 45d | 1 | 0.21mi |
| 111 Minnie Dr Itasca, TX | 3.0 | 2.0 | 1250 | $1,775 | $1.42 | 45d | 1 | 0.45mi |
Listing history 4 events
-
2026-06-21days on market $220,000 Active 3 DOM
-
2026-06-21days on market $220,000 Active 2 DOM
-
2026-06-18remarks 699-char remark
-
2026-06-18$220,000 Active 1 DOM
ⓘ Source: listings_history table (triggers on properties + properties_extension) + one-shot
backfill from property_details.listing_events for pre-trigger history.
Tax reassessment forecast TX · Resets to sale price
- Current annual tax
- $2,773 · $231/mo
- Projected year-2 tax
- $4,026 · $336/mo
- Expected delta
- +$1,253/yr (+$104/mo · 45.2%)
ⓘ Screening estimate from a state-policy table — verify with the county assessor before closing.
Climate risk First Street
- Flood 3/10 Moderate FEMA zone X (unshaded) · 20% chance over 30 yrs
- Wildfire 5/10 Major
- Heat 7/10 Severe 7 d/yr ≥109°F today · 22 d/yr by 30 yrs out
- Wind 6/10 Major 27% chance of damaging wind over 30 yrs
- Air quality 2/10 Low 1 unhealthy d/yr today · 2 by 30 yrs out
Nearby sold comps map
Loading sold comps map…
Walkable amenities ~0.75 mi
Loading nearby amenities…
Taxation est. · year 1
- Rental income
- $20,455
- − Mortgage interest
- −$12,323
- − Property taxes
- −$2,773
- − Insurance
- −$1,100
- − Repairs & maintenance
- −$1,636
- − Management
- −$1,636
- − Depreciation
- −$6,400
- Taxable loss
- −$5,414
- Est. tax savings @ 24.0%
- +$1,299
- After-tax cash flow
- $-258/yr
For passive investors: Depreciation is non-cash, so a rental often shows a tax loss while cash-flowing — sheltering income. Rental losses are passive: they offset passive income freely, and up to $25,000/yr can offset ordinary (W-2) income if you actively participate and your MAGI is under $100k (phasing out to $0 by $150k); unused losses carry forward. On sale, claimed depreciation is recaptured at up to 25%, and gains may owe capital-gains tax (a 1031 exchange can defer both). Figures are a year-1 estimate at your 24.0% rate — not tax advice; consult a CPA.
Schools (NCES district)
- District
- Itasca ISD
- NCES district ID
- 4824480
- Math proficiency
- 23% ▼ -8.00%
- Reading proficiency
- 35% ▼ -1.00%
- Median HH income
- $49,224
- Composite
- 25.26/100
- National rank
- #7499
- State rank
- #636 of 826 in TX
Livability — Itasca
- Score
- 63/100
- State rank
- #832
- US rank
- #14977
Category grades
Schools grade is shown separately in the Schools card above.
Census & demographics
- Census place
- Itasca, TX
- City population
- 3,719
- Population (ZIP)
- 3,719
Population outlook (Hill County) Hauer SSP2
- Today (2025)
- 34,013 people
- By 2030
- 33,289 · -2.1%
- By 2040
- 31,688 · -6.8%
- By 2050
- 30,100 · -11.5%
- By 2075
- 26,818 · -21.2%
- By 2100
- 22,918 · -32.6%
Race, ethnicity, and origin ACS 2023
- Neighborhood character
- Majority White (60%)
- Race & ethnicity
- White 60% Hispanic / Latino 30% Two or more races 9% Black 6%
- Hispanic origin (detail)
- Mexican 29%
- Common ancestry
- Lithuanian 2% Slovak 1% Italian 1%
- Foreign-born
- 5% · Canada
- Languages at home
- 87% English-only · Spanish 11% German/W. Germanic 1% French/Haitian/Cajun 1%
Political lean MEDSL · Hill
- 2024 margin
- Solid R (+64.4) · D 17.5% · R 81.8%
- 2008→2024 swing
- -23.0pp toward R · 2008: -41.4pp · 2024: -64.4pp
- All cycles
- 2024: R+64.4 2020: R+60.7 2016: R+58.4 2012: R+53.0 2008: R+41.4
Not yet ingested
- Civics
- —
Market trends
- HPI YoY
- ▲ 10.37%
- Current HPI
- 264.5221
- Rent YoY
- —
- Metro
- —
- State GDP YoY
- ▲ 3.95%
- F500 in state
- 110
Industry mix (Fortune 500 HQ in TX)
| Industry | F500 HQs | Revenue |
|---|---|---|
| Energy | 16 | $1,198B |
|
||
| Technology | 5 | $198B |
|
||
| Engineering / Construction | 4 | $72B |
|
||
| Energy Services | 3 | $60B |
|
||
| Utilities | 3 | $41B |
|
||
| Healthcare | 2 | $330B |
|
||
Price history
-2.2% since first listed10 events — show timeline
- 2026-06-18 Listed $220,000 NTREIS
- 2022-07-22 Sold (Public Records) — Public Records
- 2022-07-21 Sold (Public Records) — Public Records
- 2022-07-20 Sold (MLS) — NTREIS
- 2022-07-20 Sold (MLS) — NTREIS
- 2022-06-14 Contingent — NTREIS
- 2022-06-02 Price Changed $199,900 NTREIS
- 2022-06-02 Listed $199,900 NTREIS
- 2022-05-24 Listed $225,000 NTREIS
- 2007-06-29 Sold (Public Records) — Public Records
Property tax history
+5.7%/yrLatest (2025): $2,773 · -0.9% YoY. Source: county tax records.
Cash-flow waterfall
monthlySold comps — $/sqft
last 12 mo · ≤1 miLoading sold comps…