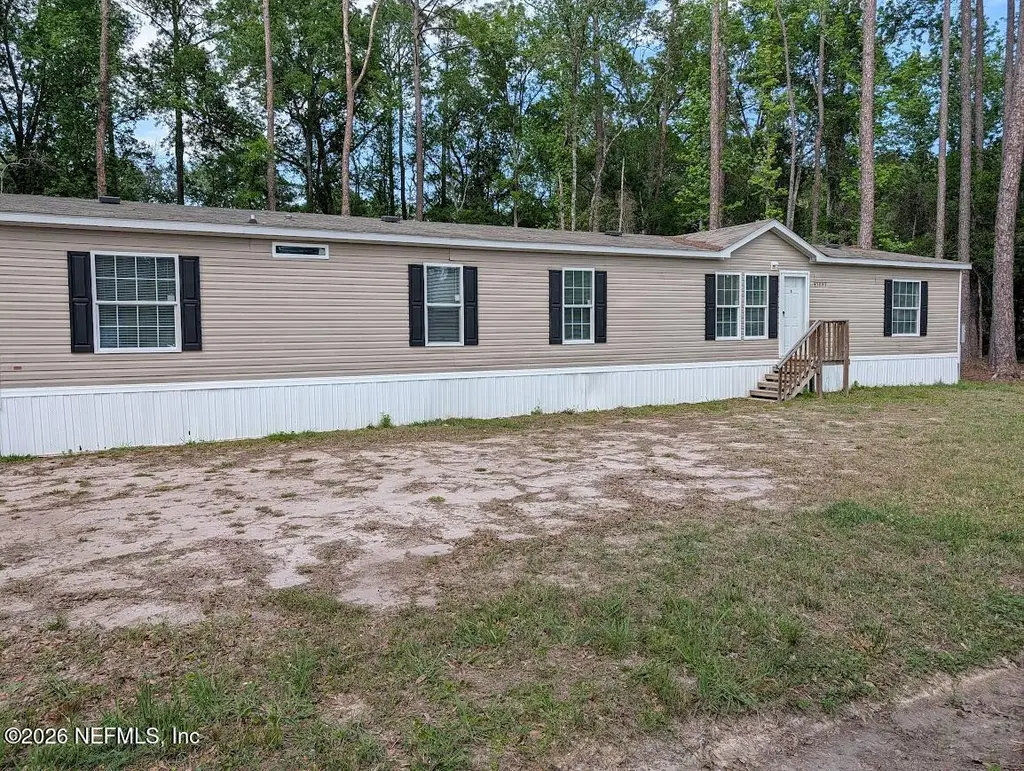
45053 R Jones Rd · Callahan, FL
Flood risk 6/10 · Moderate
- FEMA flood zone
- A
- Chance of flooding over 30 yrs
- 0.67%
- Est. flood insurance / yr
- $1,009 – $1,996
Fire risk 8/10 · Major
- Est. fire insurance / yr
- $947 – $1,759
Heat risk 8/10 · Major
- Hot days now (above 108°F)
- 7 days/yr
- Hot days in 30 yrs
- 20 days/yr
Wind risk 8/10 · Major
- Chance of severe wind over 30 yrs
- 99.0%
Air-quality risk 6/10 · Moderate
- Unhealthy air days now
- 12 days/yr
- Unhealthy air days in 30 yrs
- 13 days/yr
Risk factors via First Street. Map © Google.
Why this score? — see what drove the D+ grade
The composite is a weighted blend of 9 inputs, each scored 0–100. Each bar is that input's sub-score; the figure is the points it added to the 100-point composite (weight × sub-score).
- ARV discount +14.1/15.0
- Appreciation +10.0/10.0
- Cash flow +6.0/30.0
- Schools +6.0/10.0
- Livability +3.6/5.0
- Rent growth +2.5/5.0
- Condition / age +2.5/5.0
- 1% rule +0.8/10.0
- DSCR +0.3/10.0
$269,900
🖨 Deal sheet (PDF) 📄 Offer letter ✓ Due diligence
Listing remarks
Nearly new 2023 Manufactured home on 1.0 Acre This 4-Bedroom 3 Bath home has been completely renovated. New carpet and paint throughout. Inside you will find an open concept kitchen with breakfast bar. Kitchen is well appointed with Frigidaire appliances. This home offers a split plan. Primary bedroom includes walk-in closet ensuite with separate shower and a soaking tub. The living area is bathed in natural light. Tray ceilings with ceiling fans add to the openness. .This inviting home is a true gem. Close to schools and shopping. Just minutes from JIA, Jax International and the beaches of Amelia Island. Be the first to see and make an offer.
Key facts
- 0.9 acre lot
- Built 2023
- Listed 81 days
Property features AI
Finance
- HOA & community: Not a senior community
Exterior
- Parking: Additional parking
- Utilities: Septic tank; Cable available and connected; Electricity connected; Water connected
- Home design: Single family residence; One story; South-facing
- Construction: Vinyl siding; Shingle roof
- Exterior features: Dead-end street; Many trees; Wooded lot; Asphalt road frontage (city street)
Interior
- Kitchen: Dishwasher; Electric range; Refrigerator; Plumbed for ice maker
- Bedrooms: 4 bedrooms
- Flooring: Carpet; Vinyl
- Bathrooms: 3 full bathrooms
- Heating & cooling: Central heating; Central air conditioning
- Interior features: Breakfast bar; Ceiling fan(s); Jack and Jill bathroom; Kitchen island; Primary bathroom with tub and separate shower; Split bedroom layout; Walk-in closet(s)
- Laundry & utility: In-unit laundry; Washer hookup; Electric dryer hookup; Electric water heater
Neighborhood map
What this means for you Summary
Snapshot
- This is a 4-bed/3.0-bath manufactured listed at $270k.
Deal economics
- At list price, monthly cash flow is $-646 ($-8k/yr) — negative.
- To cash-flow at today's rent, offer at most $156k (42.3% below list).
- To meet the 1% rule (rent ≥ 1% of price), the offer needs to be $156k (42.2% below list).
- Recommended offer: $156k (42.3% below list) — sets the bar for cash-flow.
- Cap rate 4.0% vs local median 2.6% in Callahan — top-decile yield for the area; either an underpriced asset or a hidden risk that comps aren't pricing in. Stress-test before assuming the spread holds.
Location & tenants
- Location reads 71/100 on livability (#408 in FL) — a middle-class / working-renter tenant base. Strengths: crime A+, cost of living A+, housing A+; Watch: employment D+, amenities F, commute F.
- Nassau (town): math 74% / reading 65% proficiency, ranked #4 of 73 in FL (top 6%) — acceptable for families but not a draw, mixed tenant base, ~2y average lease.
- Zoned schools: Callahan Elementary School (658 students, 51% FRL); Callahan Middle School (math 79% / reading 65%, grade A, #52 of 571 statewide, top 10%, 705 students, 46% FRL); West Nassau County High School (math 39% / reading 55%, grade D-, #207 of 667 statewide, top 32%, 974 students, 40% FRL).
- Market conditions: 103 active listings in the ZIP; 953 units permitted in Nassau County in 2024 (24 in 5+ unit buildings).
Forward outlook
- In year one you build about $29k of equity ($2k loan paydown + $27k appreciation (10.0% local appreciation)).
- Nassau County population projected at +17% by 2050 — long-run rental-demand tailwind backs the buy-and-hold thesis.
- By year 2, paydown + projected appreciation supports a ~$46k cash-out refi (75% LTV) — recoverable capital for the next deal without selling this one.
Negotiation context
- It's been on market 81 days — a 6% lower offer ($254k) is reasonable based on typical stale-listing flexibility.
- 3 sale attempts since 11y ago; this cycle's ask has dropped $25k (9%) from the opening price — seller is motivated, your offer sets the floor, not the list.
Risks & watch-outs
- Watch-outs: flood insurance adds $125/mo.
- Climate carrying-cost: in FEMA flood zone A (mandatory federal flood insurance); severe wind risk, 99% chance of damaging wind over 30y; severe wildfire risk; extreme-heat days projected 7→20/yr by 2055 (HVAC capex compounding) — expect insurance premiums to compound above CPI over the hold.
Questions for the listing agent
- What do current leases actually rent for vs. the listed asking? Can we see a recent rent roll and the last 12 months of T-12 income?
- It's been on market 81 days. Have you received any prior offers? Is the seller open to a 42% concession, seller financing, or rate buy-down credit?
- What's the actual annual flood-insurance premium (NFIP or private), and is the property in a SFHA with mandatory coverage?
- Why hasn't it sold? Are there any deal-killer items the seller is aware of (foundation, flood, title, zoning, code violations)?
- Is there a deadline driving the sale (1031 exchange, divorce, estate, relocation)? That informs how much negotiation room exists.
- Schools are B-rated — typically a magnet for longer-tenancy family renters. What's the average tenant stay here, and is there a school-zone premium baked into asking?
- The area grade is low — what's the realistic commute time and amenity access for the typical tenant pool here? Any planned neighborhood developments (good or bad) we should know about?
- What's the average days-on-market for RENTAL listings here right now (not sales)? A rising rental-DOM trend means longer vacancies and softer asking-rent achievability than the comps imply.
- What's the recent tenant-quality profile in this submarket — average credit score on applications, eviction rate, late-payment / NSF rate, and stable-employment percentage? A property-management company in the area should have these aggregated.
- How much new for-sale + rental construction is in the pipeline within 1–3 miles? Heavy new supply typically softens prices + rents 12–24 months out; constrained supply supports both.
Investment metrics
- 1% rule
- 0.58% ✗
- Cap rate
- 3.98%
- Cash-on-cash
- -8.27%
- DSCR
- 0.63
- GRM
- 14.4
CMA / ARV
- ARV (on-the-fly)
- $316,160
- Comps found
- 1
Show comp detail 1 sale within ~0.75 mi
| Address | Dist | Beds/Ba | Sqft | Sold | Price | $/sf | Match |
|---|---|---|---|---|---|---|---|
| 45116 R Jones Rd | 0.08mi | 5/3.0 (+1) | 2,036 (+3%) | 21mo | $325,000 | $160 | 69 |
Match score weights: distance 35% · size 25% · config 20% · recency 20%. Top-matched comps best support the ARV.
Projected returns pro-forma
10.0% appreciation · 3.0% rent growth · sell at horizon
- IRR
- 17.1%
- Equity multiple
- 2.40×
- Total profit
- $105,867
- Equity at exit
- $243,147
- IRR
- 16.2%
- Equity multiple
- 5.55×
- Total profit
- $344,192
- Equity at exit
- $524,356
Cash invested: $75,572 (down + closing). Projections, not guarantees.
Landlord ↔ Tenant lean methodology
- Overall (STATE)
- 87 Strongly Landlord-Friendly
- State Florida
- 87 Strongly Landlord-Friendly · R+3
- County
- — inherits STATE
- City
- — inherits STATE
ZIP-level market 32011
- Home prices YoY
- 19.2%
- Active inventory
- 103
- Price-to-rent
- 14.4×
Monthly cashflow live
- Estimated rent
- $1,560 medium interval (Pro) →
- Mortgage (P&I)
- −$1,415
- Tax from tax record
- −$226 /mo · $2,710/yr
- Insurance
- −$112
- Flood insurance flood zone
- −$125 /mo · $1,502/yr
- HOA
- −$0
- Vacancy / Maint / Mgmt
- −$328
- Net cashflow
- $-646
Break-even live
Sensitivity live
| Price | -10% $-493 | -5% $-570 | +0% $-646 | +5% $-723 | +10% $-799 |
|---|---|---|---|---|---|
| Rent | -10% $-770 | -5% $-708 | +0% $-646 | +5% $-585 | +10% $-523 |
| Rate | -1.0pp $-510 | -0.5pp $-578 | base $-646 | +0.5pp $-716 | +1.0pp $-787 |
UW: 25.0% down · 7.5% · 30yr · 1.5% tax · 5.0% vac · 8.0% maint · 8.0% mgmt
Financing live
Cash to close
- Down payment
- $67,475
- Closing costs
- $8,097
- Reserves months
- —
- Total cash needed
- —
Loan-product check · same deal, 3 products live
Conventional
25% down · 7.5% · 30yr
- Down + closing
- —
- Monthly P&I
- —
- Monthly cashflow
- —
- DSCR
- —
- Eligible?
- —
Personal DTI + credit; lowest rate.
DSCR
20% down · 8.5% · 30yr
- Down + closing
- —
- Monthly P&I
- —
- Monthly cashflow
- —
- DSCR
- —
- Eligible?
- —
No personal income docs; deal must DSCR.
Hard money
10% down · 12.0% · 12mo
- Down + closing
- —
- Monthly P&I
- —
- Monthly cashflow
- —
- DSCR
- —
- Eligible?
- —
Short-term bridge; refi at stabilization.
Listing history 19 events
-
2026-06-21days on market $269,900 Active 81 DOM
-
2026-06-18days on market $269,900 Active 78 DOM
-
2026-06-17days on market $269,900 Active 77 DOM
-
2026-06-16days on market $269,900 Active 76 DOM
-
2026-06-15days on market $269,900 Active 75 DOM
-
2026-06-13pricedays on market $269,900 Active 73 DOM
-
2026-06-13days on market $280,000 Active 72 DOM
-
2026-06-09days on market $280,000 Active 69 DOM
-
2026-06-08days on market $280,000 Active 68 DOM
-
2026-06-07days on market $280,000 Active 67 DOM
-
2026-06-05days on market $280,000 Active 64 DOM
-
2026-06-03days on market $280,000 Active 63 DOM
-
2026-06-02days on market $280,000 Active 62 DOM
-
2026-06-01days on market $280,000 Active 61 DOM
-
2026-05-31days on market $280,000 Active 60 DOM
-
2026-05-14price $280,000
-
2026-04-01$295,000 Active
-
2016-07-29$14,900
-
2015-06-30$14,500
ⓘ Source: listings_history table (triggers on properties + properties_extension) + one-shot
backfill from property_details.listing_events for pre-trigger history.
Tax reassessment forecast FL · Resets to sale price
- Current annual tax
- $2,710 · $226/mo
- Projected year-2 tax
- $2,710 · $226/mo
- Expected delta
- $0/yr ($0/mo · 0.0%)
ⓘ Screening estimate from a state-policy table — verify with the county assessor before closing.
Climate risk First Street
- Flood 6/10 Major FEMA zone A · 67% chance over 30 yrs
- Wildfire 8/10 Severe
- Heat 8/10 Severe 7 d/yr ≥108°F today · 20 d/yr by 30 yrs out
- Wind 8/10 Severe 99% chance of damaging wind over 30 yrs
- Air quality 6/10 Major 12 unhealthy d/yr today · 13 by 30 yrs out
Nearby sold comps map
Loading sold comps map…
Walkable amenities ~0.75 mi
Loading nearby amenities…
Taxation est. · year 1
- Rental income
- $18,723
- − Mortgage interest
- −$15,119
- − Property taxes
- −$2,710
- − Insurance
- −$2,852
- − Repairs & maintenance
- −$1,498
- − Management
- −$1,498
- − Depreciation
- −$7,852
- Taxable loss
- −$12,804
- Est. tax savings @ 24.0%
- +$3,073
- After-tax cash flow
- $-4,682/yr
For passive investors: Depreciation is non-cash, so a rental often shows a tax loss while cash-flowing — sheltering income. Rental losses are passive: they offset passive income freely, and up to $25,000/yr can offset ordinary (W-2) income if you actively participate and your MAGI is under $100k (phasing out to $0 by $150k); unused losses carry forward. On sale, claimed depreciation is recaptured at up to 25%, and gains may owe capital-gains tax (a 1031 exchange can defer both). Figures are a year-1 estimate at your 24.0% rate — not tax advice; consult a CPA.
Schools (NCES district)
- District
- Nassau
- NCES district ID
- 1201350
- Math proficiency
- 74% ▼ -2.00%
- Reading proficiency
- 65% ▼ -2.00%
- Median HH income
- $58,267
- Composite
- 59.79/100
- National rank
- #899
- State rank
- #4 of 73 in FL
Livability — Callahan
- Score
- 71/100
- State rank
- #408
- US rank
- #7208
Category grades
Schools grade is shown separately in the Schools card above.
Census & demographics
- Population (ZIP)
- 15,716
Population outlook (Nassau County) Hauer SSP2
- Today (2025)
- 88,419 people
- By 2030
- 92,679 · +4.8%
- By 2040
- 99,257 · +12.3%
- By 2050
- 103,378 · +16.9%
- By 2075
- 109,726 · +24.1%
- By 2100
- 107,006 · +21.0%
Race, ethnicity, and origin ACS 2023
- Neighborhood character
- Predominantly White (92%)
- Race & ethnicity
- White 92% Black 3% Hispanic / Latino 3% Two or more races 3%
- Common ancestry
- Italian 2% Slovak 2% Lithuanian 1%
- Foreign-born
- 2% · Canada
- Languages at home
- 98% English-only · Spanish 1%
Political lean MEDSL · Nassau
- 2024 margin
- Solid R (+46.9) · D 26.1% · R 73.1%
- 2008→2024 swing
- -3.1pp toward R · 2008: -43.8pp · 2024: -46.9pp
- All cycles
- 2024: R+46.9 2020: R+45.9 2016: R+50.2 2012: R+48.6 2008: R+43.8
Not yet ingested
- Civics
- —
Market trends
- HPI YoY
- ▲ 56.56%
- Current HPI
- 351.8301
- Rent YoY
- —
- Metro
- —
- State GDP YoY
- ▲ 3.28%
- F500 in state
- 36
Industry mix (Fortune 500 HQ in FL)
| Industry | F500 HQs | Revenue |
|---|---|---|
| Industrial Technology | 2 | $29B |
|
||
| Insurance | 2 | $17B |
|
||
| Retail | 1 | $60B |
|
||
| Technology Distribution | 1 | $58B |
|
||
| Homebuilding | 1 | $35B |
|
||
| Technology Manufacturing | 1 | $35B |
|
||
Price history
+1831.0% since first listed4 events — show timeline
- 2026-05-14 Price Changed $280,000 realMLS
- 2026-04-01 Listed $295,000 realMLS
- 2016-07-29 Listed $14,900 AINCAR
- 2015-06-30 Listed $14,500 AINCAR
Property tax history
+27.4%/yrLatest (2025): $2,710 · +1.5% YoY. Source: county tax records.
Cash-flow waterfall
monthlySold comps — $/sqft
last 12 mo · ≤1 miLoading sold comps…