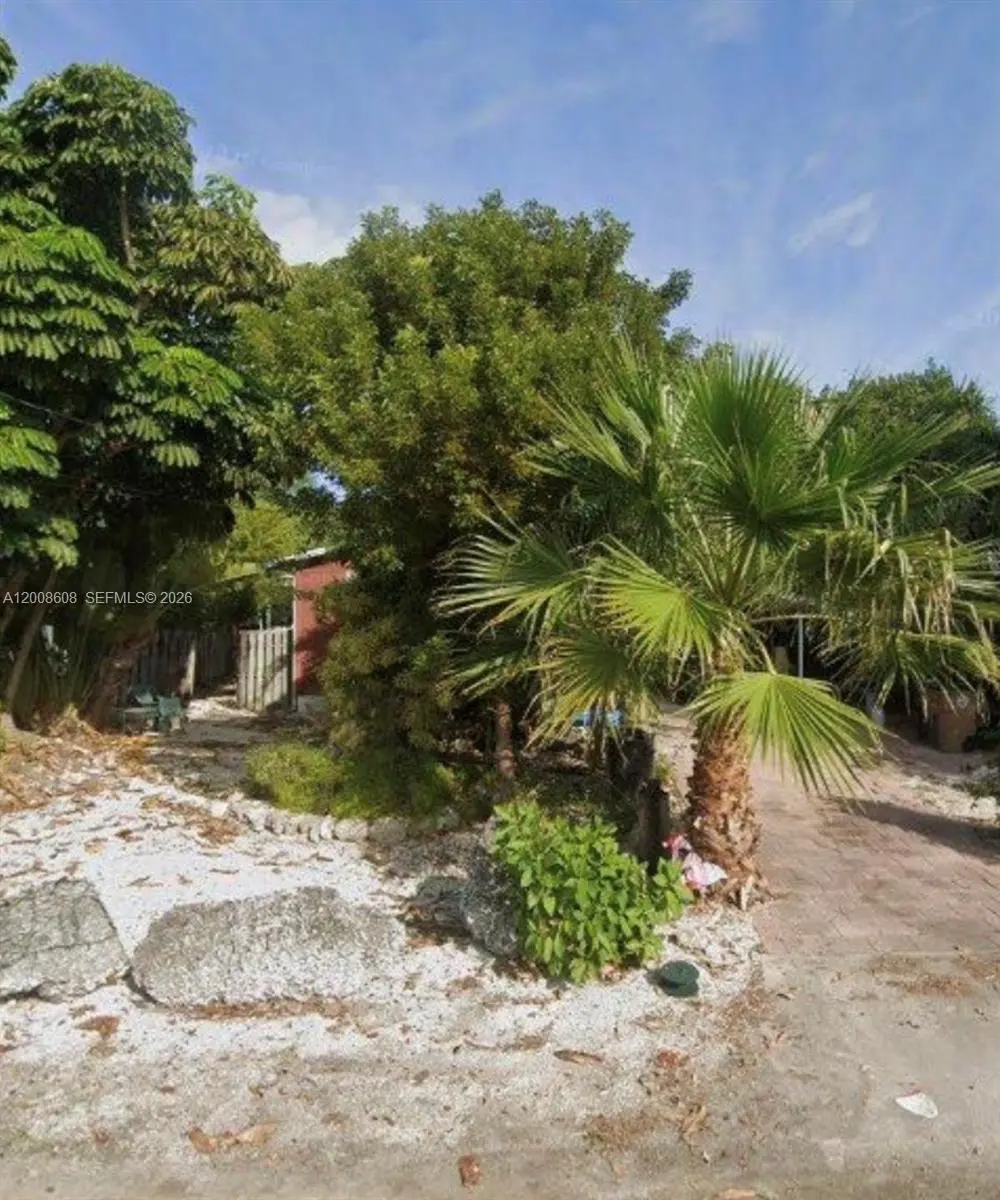
22963 Anne Bonny Ln · Cudjoe Key, FL
Flood risk 10/10 · Severe
- FEMA flood zone
- AE
- Chance of flooding over 30 yrs
- 0.99%
- Est. flood insurance / yr
- $1,737 – $8,500
Fire risk 1/10 · Minimal
- Est. fire insurance / yr
- $947 – $1,759
Heat risk No data
- Hot days now (above threshold)
- —
- Hot days in 30 yrs
- —
Wind risk 10/10 · Severe
- Chance of severe wind over 30 yrs
- 99.0%
Air-quality risk 1/10 · Minimal
- Unhealthy air days now
- 0 days/yr
- Unhealthy air days in 30 yrs
- 0 days/yr
Risk factors via First Street. Map © Google.
Why this score? — see what drove the D+ grade
The composite is a weighted blend of 9 inputs, each scored 0–100. Each bar is that input's sub-score; the figure is the points it added to the 100-point composite (weight × sub-score).
- ARV discount +15.0/15.0
- Appreciation +10.0/10.0
- Cash flow +7.0/30.0
- Schools +4.6/10.0
- Livability +3.0/5.0
- Rent growth +2.5/5.0
- Condition / age +2.5/5.0
- DSCR +1.2/10.0
- 1% rule +0.7/10.0
$580,000
🖨 Deal sheet (PDF) 📄 Offer letter ✓ Due diligence
Listing remarks MLS
BEST PRICED CANAL FRONT HOME IN THE LOWER KEYS THIS ONE WON'T LAST LONG - VACANT AND EASY TO SHOW DRIVE BY AND TAKE A LOOK.
Key facts
- 6,188 sq ft lot
- Parking
- Built 1981
Property features AI
Finance
- HOA & community: Boat facilities
Exterior
- Parking: Driveway; Paver block
- Utilities: Public water; Public sewer
- Home design: Single-story; Faces east; Has a view; Fixer
- Construction: Metal roof; Slab foundation; Resale property (existing construction)
- Exterior features: Enclosed porch; Screened porch; Patio
Interior
- Kitchen: Dishwasher; Refrigerator
- Bedrooms: Bedroom on main level
- Flooring: Hardwood; Wood
- Bathrooms: 2 full bathrooms
- Heating & cooling: Central heating; Central air; Ceiling fan(s)
- Interior features: Unfurnished; Eat-in kitchen; First floor entry; Main-level primary; Tub with shower; Family room
- Laundry & utility: Dryer
Neighborhood map
What this means for you Summary
Snapshot
- This is a 2-bed/2.0-bath single-family listed at $580k.
Deal economics
- At list price, monthly cash flow is $-1k ($-15k/yr) — negative.
- To cash-flow at today's rent, offer at most $356k (38.7% below list).
- To meet the 1% rule (rent ≥ 1% of price), the offer needs to be $330k (43.1% below list).
- Recommended offer: $330k (43.1% below list) — sets the bar for 1% rule.
- Cap rate 4.5% vs local median 1.5% in Cudjoe Key — top-decile yield for the area; either an underpriced asset or a hidden risk that comps aren't pricing in. Stress-test before assuming the spread holds.
Location & tenants
- Location reads 59/100 on livability (#811 in FL) — a working-class tenant base; expect higher turnover. Strengths: crime A+, employment A+, housing B; Watch: schools D, health & safety D, amenities F.
- Monroe (town): math 50% / reading 55% proficiency, ranked #23 of 73 in FL (top 32%) — acceptable for families but not a draw, mixed tenant base, ~2y average lease.
- Market conditions: 244 active listings in the ZIP; solid renter incomes; 332 units permitted in Monroe County in 2024 (42 in 5+ unit buildings).
- This rent runs 38% of the median local income ($103k/yr) — at the standard rent-burdened threshold; future hikes will face affordability resistance.
Forward outlook
- In year one you build about $62k of equity ($4k loan paydown + $58k appreciation (10.0% local appreciation)).
- Monroe County population projected at +28% by 2050 — long-run rental-demand tailwind backs the buy-and-hold thesis.
- By year 2, paydown + projected appreciation supports a ~$100k cash-out refi (75% LTV) — recoverable capital for the next deal without selling this one.
Negotiation context
- It's been on market 34 days — a 3% lower offer ($563k) is reasonable based on typical stale-listing flexibility.
- 2 sale attempts since 29y ago with the ask held roughly flat each time — persistent listings suggest the price (not the market) is what's stuck; bring a comps-based counter.
- Current owner paid $139k; list at $580k implies a 317% gain — meaningful room to come down on a strong offer.
Risks & watch-outs
- Watch-outs: flood insurance adds $427/mo.
- Climate carrying-cost: in FEMA flood zone AE (mandatory federal flood insurance); severe wind risk, 99% chance of damaging wind over 30y — expect insurance premiums to compound above CPI over the hold.
Questions for the listing agent
- What do current leases actually rent for vs. the listed asking? Can we see a recent rent roll and the last 12 months of T-12 income?
- It's been on market 34 days. Have you received any prior offers? Is the seller open to a 43% concession, seller financing, or rate buy-down credit?
- What's the actual annual flood-insurance premium (NFIP or private), and is the property in a SFHA with mandatory coverage?
- Is there a deadline driving the sale (1031 exchange, divorce, estate, relocation)? That informs how much negotiation room exists.
- Schools are D-rated, which usually means shorter tenancies and higher turnover. Who's the typical renter profile here, and what's been the actual vacancy rate?
- The area grade is low — what's the realistic commute time and amenity access for the typical tenant pool here? Any planned neighborhood developments (good or bad) we should know about?
- What's the average days-on-market for RENTAL listings here right now (not sales)? A rising rental-DOM trend means longer vacancies and softer asking-rent achievability than the comps imply.
- What's the recent tenant-quality profile in this submarket — average credit score on applications, eviction rate, late-payment / NSF rate, and stable-employment percentage? A property-management company in the area should have these aggregated.
- How much new for-sale + rental construction is in the pipeline within 1–3 miles? Heavy new supply typically softens prices + rents 12–24 months out; constrained supply supports both.
Investment metrics
- 1% rule
- 0.57% ✗
- Cap rate
- 4.55%
- Cash-on-cash
- -6.23%
- DSCR
- 0.72
- GRM
- 14.6
CMA / ARV
- ARV (on-the-fly)
- $737,256
- Comps found
- 6
Show comp detail 6 sales within ~0.75 mi
| Address | Dist | Beds/Ba | Sqft | Sold | Price | $/sf | Match |
|---|---|---|---|---|---|---|---|
| 701 Spanish Main Dr #468 | 0.29mi | 2/2.0 | 864 (+4%) | 7mo | $710,000 | $822 | 75 |
| 701 Spanish Main Dr #366 | 0.30mi | 2/2.0 | 816 (-2%) | 16mo | $550,000 | $674 | 69 |
| 22464 La Fitte Dr | 0.53mi | 2/2.0 | 860 (+3%) | 8mo | $785,000 | $913 | 64 |
| 22979 Sharp Ln | 0.45mi | 2/2.0 | 900 (+8%) | 3mo | $808,000 | $898 | 64 |
| 22878 Privateer Dr | 0.19mi | 2/2.0 | 948 (+14%) | 7mo | $817,500 | $862 | 63 |
| 23012 Snapper Ln | 0.18mi | 3/2.0 (+1) | 950 (+14%) | 4mo | $840,000 | $884 | 60 |
Match score weights: distance 35% · size 25% · config 20% · recency 20%. Top-matched comps best support the ARV.
Projected returns pro-forma
10.0% appreciation · 3.0% rent growth · sell at horizon
- IRR
- 17.7%
- Equity multiple
- 2.45×
- Total profit
- $235,002
- Equity at exit
- $522,510
- IRR
- 16.6%
- Equity multiple
- 5.65×
- Total profit
- $755,559
- Equity at exit
- $1,126,812
Cash invested: $162,400 (down + closing). Projections, not guarantees.
Landlord ↔ Tenant lean methodology
- Overall (STATE)
- 87 Strongly Landlord-Friendly
- State Florida
- 87 Strongly Landlord-Friendly · R+3
- County
- — inherits STATE
- City
- — inherits STATE
ZIP-level market 33042
- Home prices YoY
- 2.5%
- Active inventory
- 244
- Price-to-rent
- 14.6×
Monthly cashflow live
- Estimated rent
- $3,300 medium interval (Pro) →
- Mortgage (P&I)
- −$3,042
- Tax from tax record
- −$167 /mo · $2,000/yr
- Insurance
- −$242
- Flood insurance flood zone
- −$427 /mo · $5,118/yr
- HOA
- −$0
- Vacancy / Maint / Mgmt
- −$693
- Net cashflow
- $-1,269
Break-even live
Sensitivity live
| Price | -10% $-941 | -5% $-1,105 | +0% $-1,269 | +5% $-1,434 | +10% $-1,598 |
|---|---|---|---|---|---|
| Rent | -10% $-1,530 | -5% $-1,400 | +0% $-1,269 | +5% $-1,139 | +10% $-1,009 |
| Rate | -1.0pp $-977 | -0.5pp $-1,122 | base $-1,269 | +0.5pp $-1,420 | +1.0pp $-1,573 |
UW: 25.0% down · 7.5% · 30yr · 1.5% tax · 5.0% vac · 8.0% maint · 8.0% mgmt
Financing live
Cash to close
- Down payment
- $145,000
- Closing costs
- $17,400
- Reserves months
- —
- Total cash needed
- —
Loan-product check · same deal, 3 products live
Conventional
25% down · 7.5% · 30yr
- Down + closing
- —
- Monthly P&I
- —
- Monthly cashflow
- —
- DSCR
- —
- Eligible?
- —
Personal DTI + credit; lowest rate.
DSCR
20% down · 8.5% · 30yr
- Down + closing
- —
- Monthly P&I
- —
- Monthly cashflow
- —
- DSCR
- —
- Eligible?
- —
No personal income docs; deal must DSCR.
Hard money
10% down · 12.0% · 12mo
- Down + closing
- —
- Monthly P&I
- —
- Monthly cashflow
- —
- DSCR
- —
- Eligible?
- —
Short-term bridge; refi at stabilization.
Listing history 14 events
-
2026-06-10status $580,000 Pending 34 DOM
-
2026-06-09days on market $580,000 Active Under Contract 34 DOM
-
2026-06-08days on market $580,000 Active Under Contract 33 DOM
-
2026-06-07days on market $580,000 Active Under Contract 32 DOM
-
2026-06-05days on market $580,000 Active Under Contract 29 DOM
-
2026-06-03days on market $580,000 Active Under Contract 28 DOM
-
2026-06-02days on market $580,000 Active Under Contract 27 DOM
-
2026-06-01days on market $580,000 Active Under Contract 26 DOM
-
2026-05-31days on market $580,000 Active Under Contract 25 DOM
-
2026-05-30days on market $580,000 Active Under Contract 24 DOM
-
2026-05-06historical Active Under Contract
-
2026-04-27$580,000 Active
-
1997-12-02soldstatus $139,000 123-char remark
Show marketing remark (123 chars)
BEST PRICED CANAL FRONT HOME IN THE LOWER KEYS THIS ONE WON'T LAST LONG - VACANT AND EASY TO SHOW DRIVE BY AND TAKE A LOOK.
-
1997-08-25$139,000 123-char remark
Show marketing remark (123 chars)
BEST PRICED CANAL FRONT HOME IN THE LOWER KEYS THIS ONE WON'T LAST LONG - VACANT AND EASY TO SHOW DRIVE BY AND TAKE A LOOK.
ⓘ Source: listings_history table (triggers on properties + properties_extension) + one-shot
backfill from property_details.listing_events for pre-trigger history.
Tax reassessment forecast FL · Resets to sale price
- Current annual tax
- $2,000 · $167/mo
- Projected year-2 tax
- $4,814 · $401/mo
- Expected delta
- +$2,814/yr (+$234/mo · 140.7%)
ⓘ Screening estimate from a state-policy table — verify with the county assessor before closing.
Climate risk First Street
- Flood 10/10 Extreme FEMA zone AE · 99% chance over 30 yrs
- Wildfire 1/10 Low
- Wind 10/10 Extreme 99% chance of damaging wind over 30 yrs
- Air quality 1/10 Low 0 unhealthy d/yr today · 0 by 30 yrs out
Nearby sold comps map
Loading sold comps map…
Walkable amenities ~0.75 mi
Loading nearby amenities…
Taxation est. · year 1
- Rental income
- $39,601
- − Mortgage interest
- −$32,489
- − Property taxes
- −$2,000
- − Insurance
- −$8,018
- − Repairs & maintenance
- −$3,168
- − Management
- −$3,168
- − Depreciation
- −$16,873
- Taxable loss
- −$26,116
- Est. tax savings @ 24.0%
- +$6,268
- After-tax cash flow
- $-8,965/yr
For passive investors: Depreciation is non-cash, so a rental often shows a tax loss while cash-flowing — sheltering income. Rental losses are passive: they offset passive income freely, and up to $25,000/yr can offset ordinary (W-2) income if you actively participate and your MAGI is under $100k (phasing out to $0 by $150k); unused losses carry forward. On sale, claimed depreciation is recaptured at up to 25%, and gains may owe capital-gains tax (a 1031 exchange can defer both). Figures are a year-1 estimate at your 24.0% rate — not tax advice; consult a CPA.
Schools (NCES district)
- District
- Monroe
- NCES district ID
- 1201320
- Math proficiency
- 50% ▼ -14.00%
- Reading proficiency
- 55% ▼ -6.00%
- Median HH income
- $56,955
- Composite
- 45.51/100
- National rank
- #2608
- State rank
- #23 of 73 in FL
Livability — Cudjoe Key
- Score
- 59/100
- State rank
- #811
- US rank
- #19681
Category grades
Schools grade is shown separately in the Schools card above.
Census & demographics
- Census place
- Cudjoe Key, FL
- County
- Monroe County · 66,185 people
- City population
- 6,781
- Metro
- Key West, FL
- Population (ZIP)
- 6,441
- Household income
- $103,041
- Rent vs Own
- Severe rent burden
- 146.0
Population outlook (Monroe County) Hauer SSP2
- Today (2025)
- 90,706 people
- By 2030
- 96,308 · +6.2%
- By 2040
- 106,565 · +17.5%
- By 2050
- 116,500 · +28.4%
- By 2075
- 141,423 · +55.9%
- By 2100
- 151,947 · +67.5%
Race, ethnicity, and origin ACS 2023
- Neighborhood character
- Predominantly White (81%)
- Race & ethnicity
- White 81% Two or more races 12% Hispanic / Latino 12% Black 3%
- Hispanic origin (detail)
- Mexican 3% Puerto Rican 2% Cuban 5%
- Common ancestry
- Romanian 3% Slovak 3% Iranian 3%
- Foreign-born
- 8% · Canada, Jamaica
- Languages at home
- 91% English-only · Spanish 5% Russian/Polish/Slavic 1% German/W. Germanic 1%
Political lean MEDSL · Monroe
- 2024 margin
- R (+18.3) · D 40.5% · R 58.8%
- 2008→2024 swing
- -23.2pp toward R · 2008: 4.9pp · 2024: -18.3pp
- All cycles
- 2024: R+18.3 2020: R+7.9 2016: R+6.9 2012: D+0.4 2008: D+4.9
Not yet ingested
- Civics
- —
Market trends
- HPI YoY
- ▲ 12.11%
- Current HPI
- 491.52
- Rent YoY
- —
- Metro
- Key West, FL
- State GDP YoY
- ▲ 3.28%
- F500 in state
- 36
Industry mix (Fortune 500 HQ in FL)
| Industry | F500 HQs | Revenue |
|---|---|---|
| Industrial Technology | 2 | $29B |
|
||
| Insurance | 2 | $17B |
|
||
| Retail | 1 | $60B |
|
||
| Technology Distribution | 1 | $58B |
|
||
| Homebuilding | 1 | $35B |
|
||
| Technology Manufacturing | 1 | $35B |
|
||
Price history
+317.3% since first listed4 events — show timeline
- 2026-05-06 Contingent — MARMLS
- 2026-04-27 Listed $580,000 MARMLS
- 1997-12-02 Sold (MLS) $139,000 FLKMLS
- 1997-08-25 Listed $139,000 FLKMLS
Property tax history
+1.2%/yrLatest (2025): $2,000 · +5.0% YoY. Source: county tax records.
Cash-flow waterfall
monthlySold comps — $/sqft
last 12 mo · ≤1 miLoading sold comps…