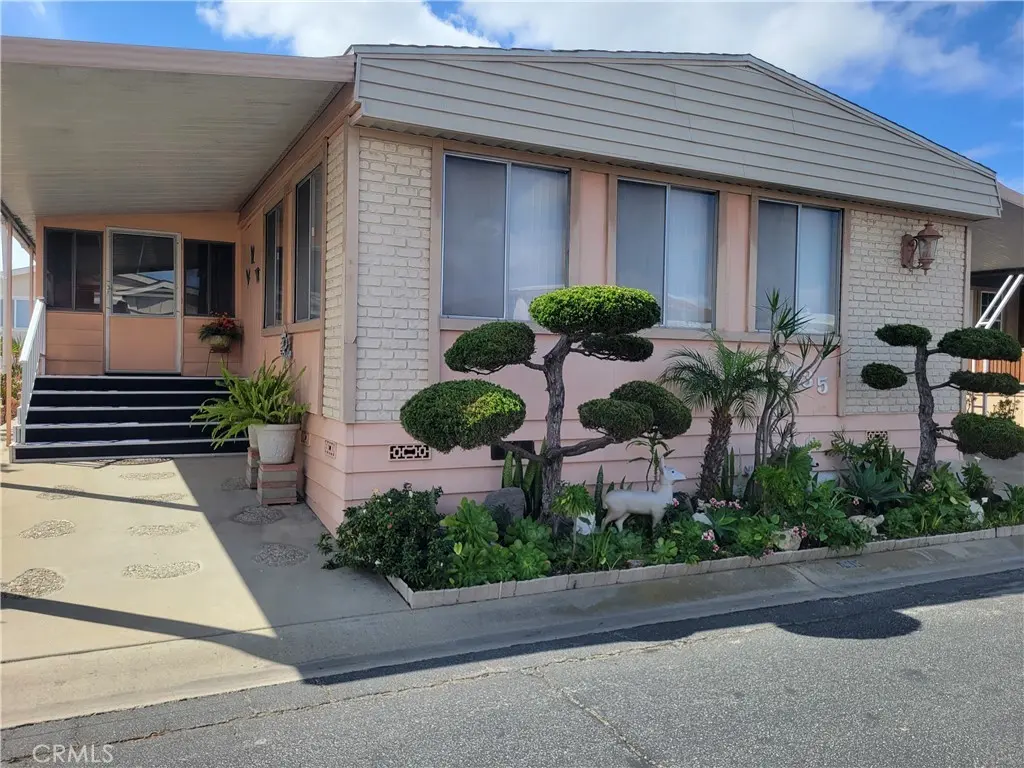
1065 Lomita Blvd #435 · West Carson, CA
Flood risk 1/10 · Minimal
- FEMA flood zone
- X (unshaded)
- Chance of flooding over 30 yrs
- 0.0%
- Est. flood insurance / yr
- $507 – $1,088
Fire risk 1/10 · Minimal
- Est. fire insurance / yr
- $659 – $1,223
Heat risk 3/10 · Minor
- Hot days now (above 87°F)
- 7 days/yr
- Hot days in 30 yrs
- 22 days/yr
Wind risk 1/10 · Minimal
- Chance of severe wind over 30 yrs
- —
Air-quality risk 5/10 · Moderate
- Unhealthy air days now
- 7 days/yr
- Unhealthy air days in 30 yrs
- 7 days/yr
Risk factors via First Street. Map © Google.
Why this score? — see what drove the C- grade
The composite is a weighted blend of 9 inputs, each scored 0–100. Each bar is that input's sub-score; the figure is the points it added to the 100-point composite (weight × sub-score).
- Cash flow +25.0/30.0
- DSCR +8.2/10.0
- 1% rule +6.5/10.0
- Schools +3.6/10.0
- Rent growth +3.3/5.0
- Livability +3.2/5.0
- ARV discount +2.6/15.0
- Condition / age +2.2/5.0
- Appreciation +0.0/10.0
$278,000
🖨 Deal sheet (PDF) 📄 Offer letter ✓ Due diligence
Listing remarks MLS
MANY UPGRADES, LARGE 8X32 ENCLOSED PORCH. SUPER LOCATION LOCATED IN INNER CIRCLE
Key facts
- Formal entry area
- Covered carport
- Huge living room
Tags
Property features AI
Finance
- Other: Private road with paved surface; Directions available from Lomita Blvd
- Financial info: Land lease (monthly): $1,032.56
- HOA & community: Part of homeowners association; Senior community; Community features include street lighting and a park; Park name: San Rafael Mobile Home Estates; Manager approval required
Exterior
- Parking: Attached garage; 2 garage spaces; 2 carport spaces; Tandem covered parking; Guest parking; Concrete driveway; Total 4 parking spaces
- Utilities: Private water; Private sewer; Natural gas connected; Electricity connected
- Home design: Single-story (one level); Mobile home remains on property; Mobile home approx. 24' x 65'; Front entry
- Construction: Year built (per public records)
- Exterior features: Covered enclosed front porch; Patio; Community pool; Shed (2)
Interior
- Kitchen: Gas cooktop; Gas oven; Dishwasher; Water heater unit
- Flooring: Vinyl flooring; Carpet
- Bathrooms: 2 full bathrooms; Master bath with soaking tub and double sinks; Shower
- Heating & cooling: Central cooling; Forced air heating; Central furnace
- Interior features: Wet bar; Ceiling fan; Blinds; Community spa
- Laundry & utility: Dedicated laundry room; Washer included; Dryer included
Neighborhood map
What this means for you Summary
Snapshot
- This is a 2-bed/2.0-bath manufactured listed at $278k. Condition is rated fair.
Deal economics
- At list price, monthly cash flow is $609 ($7k/yr) — positive.
- The deal already cash-flows at list — no discount required.
- Meets the 1% rule at list price ($3k rent vs $278k).
- Recommended offer: $270k (3.0% below list) — sets the bar for market timing.
- Cap rate 8.9% vs local median 2.9% in West Carson — top-decile yield for the area; either an underpriced asset or a hidden risk that comps aren't pricing in. Stress-test before assuming the spread holds.
Location & tenants
- Location reads 64/100 on livability (#408 in CA) — a middle-class / working-renter tenant base. Strengths: commute A+, employment A+; Watch: crime D+, amenities F, cost of living F.
- Los Angeles Unified (urban): math 29% / reading 54% proficiency, ranked #223 of 517 in CA (top 43%) — families likely to look elsewhere, expect single-tenant / working-renter base with shorter leases; 67% free/reduced lunch — lower-income household profile, screen leases tightly.
- Market conditions: Rents rising (+3.1%/yr); 64 active listings in the ZIP; 19 comparable units currently listed for rent nearby; rentals at typical pace (median 26d on market — plan ~3-4 weeks tenant-placement turnaround); solid renter incomes; 19,697 units permitted in Los Angeles County in 2024 (9,426 in 5+ unit buildings).
- At $3,203/mo this rent would consume 47% of the median local household income ($82k/yr) (locally 979% of renters already pay >50% of income on rent) — very limited rent-growth headroom before tenants either downsize or default.
Forward outlook
- Local home prices are declining (-3.0%/yr); year-one equity from $2k of loan paydown is wiped out by about $8k of value loss. Plan a longer hold.
- Los Angeles County population projected at +9% by 2050 — modest demand growth; plan on rents tracking national, not racing it.
Negotiation context
- It's been on market 58 days — a 3% lower offer ($270k) is reasonable based on typical stale-listing flexibility.
- 2 sale attempts since 23y ago; this cycle's ask has dropped $20k (7%) from the opening price — seller is motivated, your offer sets the floor, not the list.
- Current owner paid $60k; list at $278k implies a 363% gain — meaningful room to come down on a strong offer.
Questions for the listing agent
- It's been on market 58 days. Have you received any prior offers? Is the seller open to a 3% concession, seller financing, or rate buy-down credit?
- Have any recent inspections been done? Can we get a copy of the seller's disclosures and any deferred-maintenance estimates?
- Built in 1973 — when were the roof, HVAC, electrical panel, plumbing, and water heater last replaced?
- Is there a deadline driving the sale (1031 exchange, divorce, estate, relocation)? That informs how much negotiation room exists.
- Crime grade is D in this area — have there been break-ins, vandalism, or insurance claims at this property in the last 3 years? What carrier currently insures it and at what premium?
- What's the average days-on-market for RENTAL listings here right now (not sales)? A rising rental-DOM trend means longer vacancies and softer asking-rent achievability than the comps imply.
- What's the recent tenant-quality profile in this submarket — average credit score on applications, eviction rate, late-payment / NSF rate, and stable-employment percentage? A property-management company in the area should have these aggregated.
- How much new for-sale + rental construction is in the pipeline within 1–3 miles? Heavy new supply typically softens prices + rents 12–24 months out; constrained supply supports both.
Investment metrics
- 1% rule
- 1.15% ✓
- Cap rate
- 8.92%
- Cash-on-cash
- 9.39%
- DSCR
- 1.42
- GRM
- 7.2
CMA / ARV
- ARV (median comp)
- $250,614
- List price
- $278,000
- Delta
- 10.93%
- Verdict
- OVERPRICED
- Comps
- 20 within 1.0 mi
Show comp detail 11 sales within ~0.75 mi
| Address | Dist | Beds/Ba | Sqft | Sold | Price | $/sf | Match |
|---|---|---|---|---|---|---|---|
| 1065 Lomita Blvd #291 | 0.21mi | 2/2.0 | 1,880 (-1%) | 2mo | $295,000 | $157 | 87 |
| 1065 W Lomita Blvd #469 | 0.00mi | 3/2.0 (+1) | 1,744 (-8%) | 10mo | $299,000 | $171 | 73 |
| 1065 Lomita Blvd #115 | 0.00mi | 3/2.0 (+1) | 1,700 (-11%) | 9mo | $315,000 | $185 | 70 |
| 1065 Lomita Blvd #455 | 0.00mi | 3/2.0 (+1) | 1,680 (-12%) | 8mo | $255,000 | $152 | 68 |
| 1065 Lomita Blvd #400 | 0.20mi | 2/2.0 | 1,688 (-11%) | 9mo | $250,000 | $148 | 64 |
| 1065 W Lomita Blvd #220 | 0.24mi | 3/2.0 (+1) | 1,950 (+2%) | 21mo | $305,000 | $156 | 62 |
| 1065 W Lomita Blvd #171 | 0.00mi | 3/2.0 (+1) | 1,620 (-15%) | 19mo | $315,000 | $194 | 54 |
| 1065 Lomita Blvd #96 | 0.21mi | 2/2.0 | 1,640 (-14%) | 16mo | $232,500 | $142 | 54 |
| 1065 Lomita #397 | 0.21mi | 2/2.0 | 1,664 (-13%) | 24mo | $245,000 | $147 | 50 |
| 1065 Lomita Blvd #302 | 0.21mi | 3/3.0 (+1) | 1,650 (-13%) | 18mo | $295,000 | $179 | 44 |
| 760 Lomita Blvd #116 | 0.57mi | 3/2.0 (+1) | 1,620 (-15%) | 8mo | $295,000 | $182 | 36 |
Match score weights: distance 35% · size 25% · config 20% · recency 20%. Top-matched comps best support the ARV.
Projected returns pro-forma
-3.0% appreciation · 3.13% rent growth · sell at horizon
- IRR
- -2.0%
- Equity multiple
- 0.93×
- Total profit
- $-5,775
- Equity at exit
- $41,451
- IRR
- 7.9%
- Equity multiple
- 1.60×
- Total profit
- $46,862
- Equity at exit
- $24,036
Cash invested: $77,840 (down + closing). Projections, not guarantees.
Landlord ↔ Tenant lean methodology
- Overall (STATE)
- 18 Strongly Tenant-Friendly
- State California
- 18 Strongly Tenant-Friendly · D+13
- County
- — inherits STATE
- City
- — inherits STATE
ZIP-level market 90710
- Rents YoY
- 3.1%
- Active inventory
- 64
- Price-to-rent
- 7.2×
Monthly cashflow live
- Estimated rent
- $3,203 high interval (Pro) →
- Mortgage (P&I)
- −$1,458
- Tax est. 1.5%
- −$348 /mo · $4,170/yr
- Insurance
- −$116
- HOA
- −$0
- Vacancy / Maint / Mgmt
- −$673
- Net cashflow
- $609
Break-even live
Sensitivity live
| Price | -10% $801 | -5% $705 | +0% $609 | +5% $513 | +10% $417 |
|---|---|---|---|---|---|
| Rent | -10% $356 | -5% $483 | +0% $609 | +5% $736 | +10% $862 |
| Rate | -1.0pp $749 | -0.5pp $680 | base $609 | +0.5pp $537 | +1.0pp $464 |
UW: 25.0% down · 7.5% · 30yr · 1.5% tax · 5.0% vac · 8.0% maint · 8.0% mgmt
Financing live
Cash to close
- Down payment
- $69,500
- Closing costs
- $8,340
- Reserves months
- —
- Total cash needed
- —
Loan-product check · same deal, 3 products live
Conventional
25% down · 7.5% · 30yr
- Down + closing
- —
- Monthly P&I
- —
- Monthly cashflow
- —
- DSCR
- —
- Eligible?
- —
Personal DTI + credit; lowest rate.
DSCR
20% down · 8.5% · 30yr
- Down + closing
- —
- Monthly P&I
- —
- Monthly cashflow
- —
- DSCR
- —
- Eligible?
- —
No personal income docs; deal must DSCR.
Hard money
10% down · 12.0% · 12mo
- Down + closing
- —
- Monthly P&I
- —
- Monthly cashflow
- —
- DSCR
- —
- Eligible?
- —
Short-term bridge; refi at stabilization.
Rent comps 19 comps
| Address | Beds | Baths | Sqft | Rent | $/sqft | DOM | Units | Dist |
|---|---|---|---|---|---|---|---|---|
| 1115 252nd St Unit 6 Harbor City, CA | 2.0 | 1.0 | 1250 | $1,999 | $1.60 | 44d | 1 | 0.39mi |
| 1008 Harbor Heights Dr Unit B Harbor City, CA | 3.0 | 2.5 | 1434 | $3,295 | $2.30 | 16d | 1 | 0.55mi |
| 1435 Lomita Blvd #105 Harbor City, CA | 3.0 | 2.0 | 1260 | $3,250 | $2.58 | 44d | 1 | 0.58mi |
| 1673 251st St Harbor City, CA | 1.0 | 1.0 | 2104 | $1,200 | $0.57 | 25d | 1 | 0.84mi |
| 1623 255th St W Harbor City, CA | 3.0 | 3.0 | 1344 | $3,995 | $2.97 | 0d | 1 | 0.90mi |
| 25122 Ebony Ln Lomita, CA | 2.0 | 2.0 | 1716 | $2,955 | $1.72 | 21d | 1 | 1.03mi |
| 1311 Sepulveda Blvd Torrance, CA | 2.0–3.0 | 2.0 | 1201 | $3,400 | $2.83 | 0d | 1 | 1.10mi |
| 25316 Ebony Ln Lomita, CA | 3.0 | 3.0 | 1890 | $3,415 | $1.81 | 13d | 1 | 1.13mi |
| 25316 Ebony Ln Ste 1 Lomita, CA | 3.0 | 3.0 | 1890 | $3,415 | $1.81 | 12d | 1 | 1.13mi |
| 1918 252nd St Lomita, CA | 3.0 | 2.0 | 1488 | $3,900 | $2.62 | 44d | 1 | 1.20mi |
| 22919 Mariposa Ave Torrance, CA | 2.0–3.0 | 2.5–4.0 | 1480 | $3,400 | $2.30 | 44d | 2 | 1.20mi |
| 1676 259th St Harbor City, CA | 2.0 | 1.0 | 1250 | $2,795 | $2.24 | 17d | 1 | 1.20mi |
| 25018 Eshelman Ave Unit 9 Lomita, CA | 2.0 | 2.5 | 1400 | $3,295 | $2.35 | 25d | 1 | 1.21mi |
| 25018 Eshelman Ave Lomita, CA | 2.0 | 2.5 | 1400 | $3,295 | $2.35 | 44d | 1 | 1.22mi |
| 22919 Mariposa Ave #202 Torrance, CA | 3.0 | 4.0 | 1780 | $4,000 | $2.25 | 25d | 1 | 1.23mi |
| 22716 Meyler St Torrance, CA | 3.0 | 3.0 | 1650 | $4,700 | $2.85 | 23d | 1 | 1.32mi |
| 25021 Oak St Lomita, CA | 3.0 | 2.0 | 1281 | $3,995 | $3.12 | 8d | 1 | 1.43mi |
| 25326 Oak St Unit 1 Lomita, CA | 3.0 | 2.0 | 1300 | $3,650 | $2.81 | 44d | 1 | 1.46mi |
| 22553 Firenze St Carson, CA | 3.0 | 2.5 | 2012 | $4,500 | $2.24 | 25d | 1 | 1.46mi |
Listing history 22 events
-
2026-06-21days on market $278,000 Active 58 DOM
-
2026-06-18days on market $278,000 Active 55 DOM
-
2026-06-17days on market $278,000 Active 54 DOM
-
2026-06-16days on market $278,000 Active 53 DOM
-
2026-06-15days on market $278,000 Active 52 DOM
-
2026-06-13days on market $278,000 Active 50 DOM
-
2026-06-09days on market $278,000 Active 46 DOM
-
2026-06-08days on market $278,000 Active 45 DOM
-
2026-06-07days on market $278,000 Active 44 DOM
-
2026-06-04days on market $278,000 Active 41 DOM
-
2026-06-03pricedays on market $278,000 Active 40 DOM
-
2026-06-02days on market $288,000 Active 39 DOM
-
2026-06-01days on market $288,000 Active 38 DOM
-
2026-05-31days on market $288,000 Active 37 DOM
-
2026-04-24$298,000 Active 1936-char remark
-
2003-04-30soldstatus $60,000 80-char remark
Show marketing remark (80 chars)
MANY UPGRADES, LARGE 8X32 ENCLOSED PORCH. SUPER LOCATION LOCATED IN INNER CIRCLE
-
2003-04-16$64,950 80-char remark
Show marketing remark (80 chars)
MANY UPGRADES, LARGE 8X32 ENCLOSED PORCH. SUPER LOCATION LOCATED IN INNER CIRCLE
-
2002-03-01price $64,950 80-char remark
Show marketing remark (80 chars)
MANY UPGRADES, LARGE 8X32 ENCLOSED PORCH. SUPER LOCATION LOCATED IN INNER CIRCLE
-
2002-03-01price $64,950 80-char remark
Show marketing remark (80 chars)
MANY UPGRADES, LARGE 8X32 ENCLOSED PORCH. SUPER LOCATION LOCATED IN INNER CIRCLE
-
2002-03-01price $64,950 80-char remark
Show marketing remark (80 chars)
MANY UPGRADES, LARGE 8X32 ENCLOSED PORCH. SUPER LOCATION LOCATED IN INNER CIRCLE
-
2002-02-28price $320,000 80-char remark
Show marketing remark (80 chars)
MANY UPGRADES, LARGE 8X32 ENCLOSED PORCH. SUPER LOCATION LOCATED IN INNER CIRCLE
-
2002-02-28price $320,000 80-char remark
Show marketing remark (80 chars)
MANY UPGRADES, LARGE 8X32 ENCLOSED PORCH. SUPER LOCATION LOCATED IN INNER CIRCLE
ⓘ Source: listings_history table (triggers on properties + properties_extension) + one-shot
backfill from property_details.listing_events for pre-trigger history.
Climate risk First Street
- Flood 1/10 Low FEMA zone X (unshaded) · 0% chance over 30 yrs
- Wildfire 1/10 Low
- Heat 3/10 Moderate 7 d/yr ≥87°F today · 22 d/yr by 30 yrs out
- Wind 1/10 Low
- Air quality 5/10 Major 7 unhealthy d/yr today · 7 by 30 yrs out
Nearby sold comps map
Loading sold comps map…
Walkable amenities ~0.75 mi
Loading nearby amenities…
Taxation est. · year 1
- Rental income
- $38,438
- − Mortgage interest
- −$15,572
- − Property taxes
- −$4,170
- − Insurance
- −$1,390
- − Repairs & maintenance
- −$3,075
- − Management
- −$3,075
- − Depreciation
- −$8,087
- Taxable income
- $3,068
- Est. tax owed @ 24.0%
- −$736
- After-tax cash flow
- $6,575/yr
For passive investors: Depreciation is non-cash, so a rental often shows a tax loss while cash-flowing — sheltering income. Rental losses are passive: they offset passive income freely, and up to $25,000/yr can offset ordinary (W-2) income if you actively participate and your MAGI is under $100k (phasing out to $0 by $150k); unused losses carry forward. On sale, claimed depreciation is recaptured at up to 25%, and gains may owe capital-gains tax (a 1031 exchange can defer both). Figures are a year-1 estimate at your 24.0% rate — not tax advice; consult a CPA.
Condition & rehab AI · 12 photos
This manufactured home requires moderate renovations to update the kitchen and bathroom, which will significantly increase its resale and rental value.
Repairs flagged
- Major kitchen cabinets — severely dated and worn
- Major kitchen appliances — outdated and non-functional
- Major bathroom fixtures — dated and in poor condition
Value-add opportunities
- Resale update kitchen cabinets and appliances — modernizing the kitchen will attract more buyers
- Resale update bathroom fixtures — modernizing the bathroom will attract more buyers
- Both paint interior walls — painting the interior walls will improve the home's appearance and increase its value
Renovation cost estimate screening
| Repair item | Severity | Est. cost |
|---|---|---|
| kitchen cabinets · severely dated and worn | Major | $15,000–50,000 |
| kitchen appliances · outdated and non-functional | Major | $15,000–50,000 |
| bathroom fixtures · dated and in poor condition | Major | $15,000–50,000 |
| Total estimated repair cost · 3 items | $45,000–150,000 |
Value-add ROI direction
- Resale update kitchen cabinets and appliances — modernizing the kitchen will attract more buyers ↑
- Resale update bathroom fixtures — modernizing the bathroom will attract more buyers ↑
- Both paint interior walls — painting the interior walls will improve the home's appearance and increase its value ↑
ⓘ Cost ranges are severity-bucket heuristics (US national rule-of-thumb). Get contractor quotes + a written scope before underwriting a rehab budget.
Schools (NCES district)
- District
- Los Angeles Unified
- NCES district ID
- 0622710
- Math proficiency
- 29% ▼ -4.00%
- Reading proficiency
- 54% ▲ 10.00%
- Median HH income
- $50,403
- Composite
- 35.67/100
- National rank
- #4875
- State rank
- #223 of 517 in CA
Livability — West Carson
- Score
- 64/100
- State rank
- #408
- US rank
- #13927
Category grades
Schools grade is shown separately in the Schools card above.
Census & demographics
- Census place
- West Carson, CA
- County
- Los Angeles County · 9,444,647 people
- City population
- 18,467
- Metro
- Los Angeles-Long Beach-Anaheim, CA
- Population (ZIP)
- 26,761
- Household income
- $82,478
- Rent vs Own
- Severe rent burden
- 979.0
Population outlook (Los Angeles County) Hauer SSP2
- Today (2025)
- 10,940,515 people
- By 2030
- 11,256,481 · +2.9%
- By 2040
- 11,729,929 · +7.2%
- By 2050
- 11,948,407 · +9.2%
- By 2075
- 11,818,114 · +8.0%
- By 2100
- 10,842,928 · -0.9%
Race, ethnicity, and origin ACS 2023
- Neighborhood character
- Diverse neighborhood (Simpson 0.69)
- Race & ethnicity
- Hispanic / Latino 48% Two or more races 21% Asian 20% White 16% Black 11%
- Hispanic origin (detail)
- Mexican 35%
- Common ancestry
- Ukrainian 1% Lithuanian 1% Slovak 1%
- Foreign-born
- 35% · Canada, South Korea, China
- Languages at home
- 42% English-only · Spanish 38% Korean 6% Tagalog/Filipino 4%
Political lean MEDSL · Los Angeles
- 2024 margin
- Solid D (+32.9) · D 64.8% · R 31.9% · Other 3.3%
- 2008→2024 swing
- -7.4pp toward R · 2008: 40.4pp · 2024: 32.9pp
- All cycles
- 2024: D+32.9 2020: D+44.2 2016: D+48.0 2012: D+40.0 2008: D+40.4
Not yet ingested
- Civics
- —
Market trends
- HPI YoY
- ▼ -636.52%
- Current HPI
- 363.6265
- Rent YoY
- ▲ 3.13%
- Metro
- Los Angeles-Long Beach-Anaheim, CA
- State GDP YoY
- ▲ 3.21%
- F500 in state
- 116
Industry mix (Fortune 500 HQ in CA)
| Industry | F500 HQs | Revenue |
|---|---|---|
| Technology | 27 | $1,492B |
|
||
| Financial Services | 3 | $174B |
|
||
| Retail | 3 | $44B |
|
||
| Insurance | 3 | $26B |
|
||
| Media / Entertainment | 2 | $115B |
|
||
| Pharmaceuticals / Biotech | 2 | $62B |
|
||
Price history
-13.1% since first listed10 events — show timeline
- 2026-06-03 Price Changed $278,000 CRMLS
- 2026-05-22 Price Changed $288,000 CRMLS
- 2026-04-24 Listed $298,000 CRMLS
- 2003-04-30 Sold (MLS) $60,000 CRMLS
- 2003-04-16 Listed $64,950 CRMLS
- 2002-03-01 Price Changed $64,950 CRMLS
- 2002-03-01 Price Changed $64,950 CRMLS
- 2002-03-01 Price Changed $64,950 CRMLS
- 2002-02-28 Price Changed $320,000 CRMLS
- 2002-02-28 Price Changed $320,000 CRMLS
Property tax history
+5.7%/yrLatest (2025): $550 · +5.7% YoY. Source: county tax records.
Cash-flow waterfall
monthlySold comps — $/sqft
last 12 mo · ≤1 miLoading sold comps…