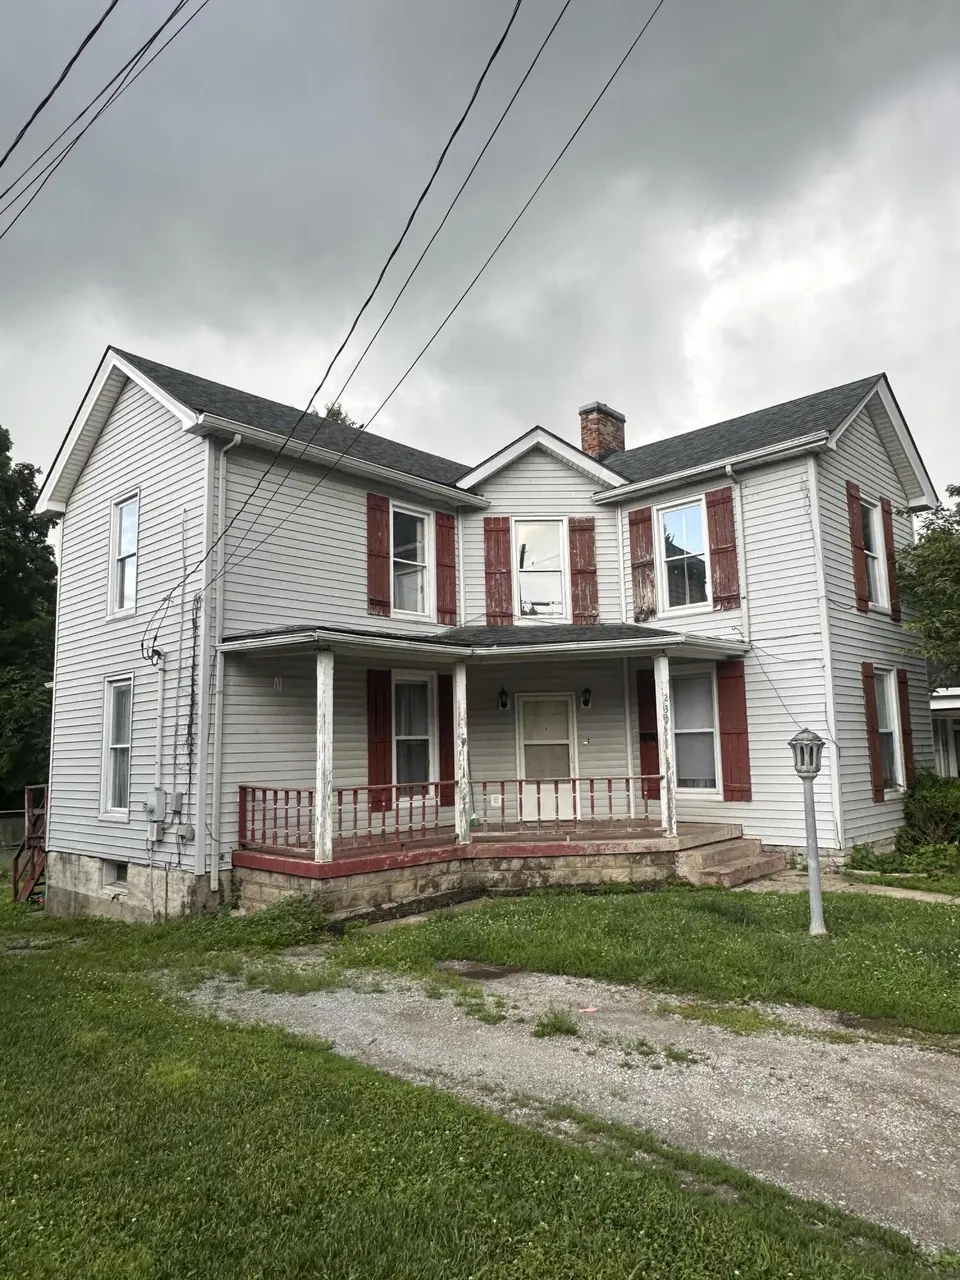
239 N Church St · Cynthiana, KY
Flood risk 1/10 · Minimal
- FEMA flood zone
- X (unshaded)
- Chance of flooding over 30 yrs
- 0.0%
- Est. flood insurance / yr
- $507 – $1,088
Fire risk 2/10 · Minimal
- Est. fire insurance / yr
- $839 – $1,559
Heat risk 4/10 · Minor
- Hot days now (above 102°F)
- 7 days/yr
- Hot days in 30 yrs
- 19 days/yr
Wind risk 2/10 · Minimal
- Chance of severe wind over 30 yrs
- 2.0%
Air-quality risk 2/10 · Minimal
- Unhealthy air days now
- 1 days/yr
- Unhealthy air days in 30 yrs
- 2 days/yr
Risk factors via First Street. Map © Google.
Why this score? — see what drove the C+ grade
The composite is a weighted blend of 9 inputs, each scored 0–100. Each bar is that input's sub-score; the figure is the points it added to the 100-point composite (weight × sub-score).
- Cash flow +19.1/30.0
- ARV discount +15.0/15.0
- Appreciation +10.0/10.0
- DSCR +6.0/10.0
- 1% rule +3.8/10.0
- Livability +3.7/5.0
- Rent growth +2.5/5.0
- Condition / age +2.5/5.0
- Schools +2.2/10.0
$189,000
🖨 Deal sheet 📄 Offer letter ✓ Due diligence
Listing remarks MLS
Spacious pre-1900's home with 4 bedrooms and over 2500 square feet on a residential street in-town with large private backyard. Home has eat-in kitchen, separate dining room, hardwood flooring and charming vintage trim. Previously renovated with easy care vinyl siding and central air conditioning.
Key facts
- Private driveway
- Outdoor entertaining
- Large backyard
Tags
Property features AI
Exterior
- Parking: Driveway; Off-street parking
- Utilities: Public water; Public sewer; Electricity connected; Natural gas connected; Water connected; Other utilities connected
- Home design: House; Two levels
- Construction: Vinyl siding; Block foundation; Shingle roof; Building area: 2,504 total
- Exterior features: Few trees on the lot
Interior
- Kitchen: Dishwasher; Microwave; Refrigerator; Range
- Bedrooms: Total rooms: 10
- Flooring: Hardwood; Vinyl
- Bathrooms: 2 full bathrooms
- Heating & cooling: Forced air heating (natural gas); Central air conditioning
- Interior features: Dishwasher; Microwave; Refrigerator; Range; Unfinished basement; No fireplace
- Laundry & utility: Washer hookup; Electric dryer hookup on main level
Neighborhood map
What this means for you Summary
Snapshot
- This is a 4-bed/2.0-bath single-family listed at $189k.
Deal economics
- At list price, monthly cash flow is $200 ($2k/yr) — positive.
- The deal already cash-flows at list — no discount required.
- To meet the 1% rule (rent ≥ 1% of price), the offer needs to be $167k (11.9% below list).
- Recommended offer: $167k (11.9% below list) — sets the bar for 1% rule.
- Cap rate 7.6% vs local median 3.5% in Cynthiana — top-decile yield for the area; either an underpriced asset or a hidden risk that comps aren't pricing in. Stress-test before assuming the spread holds.
Location & tenants
- Location reads 74/100 on livability (#113 in KY, #4,911 nationally) — a middle-class / working-renter tenant base. Strengths: cost of living A+, housing A+, health & safety A+; Watch: amenities F, commute F, employment D-.
- Harrison County (town): math 21% / reading 32% proficiency, ranked #133 of 165 in KY (top 81%) — low school quality limits family demand, transient renter base, plan for 1-2y turnover.
- Zoned schools: Eastside Elementary School (math 22% / reading 27%, grade F, #489 of 676 statewide, top 76%, 411 students, 61% FRL); Harrison County Middle School (math 19% / reading 35%, grade F, #172 of 217 statewide, top 80%, 607 students, 58% FRL); Harrison County High School (math 29% / reading 41%, grade F, #74 of 254 statewide, top 29%, 865 students, 46% FRL).
- Market conditions: 95 active listings in the ZIP; 69 units permitted in Harrison County in 2024 (0 in 5+ unit buildings).
Forward outlook
- In year one you build about $20k of equity ($1k loan paydown + $19k appreciation (10.0% local appreciation)).
- Harrison County population projected to shrink 10% by 2050 — rents likely to lag national; underwrite the cash flow, not the appreciation.
- At projected returns (10.0% appreciation + 3.0% rent growth), your $53k cash investment doubles in ~3 years — after that, you're playing with house money.
- By year 2, paydown + projected appreciation supports a ~$32k cash-out refi (75% LTV) — recoverable capital for the next deal without selling this one.
Negotiation context
- It's been on market 18 days — a 2% lower offer ($186k) is reasonable based on typical stale-listing flexibility.
- 2 sale attempts since 9y ago with the ask held roughly flat each time — persistent listings suggest the price (not the market) is what's stuck; bring a comps-based counter.
- Current owner paid $34k; list at $189k implies a 464% gain — meaningful room to come down on a strong offer.
Risks & watch-outs
- Watch-outs: built in 1884 — expect roof / HVAC / electrical / plumbing capex.
Questions for the listing agent
- Built in 1884 — when were the roof, HVAC, electrical panel, plumbing, and water heater last replaced?
- Is there a deadline driving the sale (1031 exchange, divorce, estate, relocation)? That informs how much negotiation room exists.
- What's the average days-on-market for RENTAL listings here right now (not sales)? A rising rental-DOM trend means longer vacancies and softer asking-rent achievability than the comps imply.
- What's the recent tenant-quality profile in this submarket — average credit score on applications, eviction rate, late-payment / NSF rate, and stable-employment percentage? A property-management company in the area should have these aggregated.
- How much new for-sale + rental construction is in the pipeline within 1–3 miles? Heavy new supply typically softens prices + rents 12–24 months out; constrained supply supports both.
Investment metrics
- 1% rule
- 0.88% ✗
- Cap rate
- 7.57%
- Cash-on-cash
- 4.54%
- DSCR
- 1.20
- GRM
- 9.5
CMA / ARV
- ARV (on-the-fly)
- $285,456
- Comps found
- 5
Show comp detail 5 sales within ~0.75 mi
| Address | Dist | Beds/Ba | Sqft | Sold | Price | $/sf | Match |
|---|---|---|---|---|---|---|---|
| 304 East Pleasant St | 0.35mi | 4/2.0 | 2,584 (+3%) | 12mo | $265,000 | $103 | 68 |
| 220 Oddville Ave | 0.19mi | 3/1.5 (-1) | 2,154 (-14%) | 15mo | $295,000 | $137 | 48 |
| 18 St Edwards Rd | 0.64mi | 3/2.5 (-1) | 2,150 (-14%) | 3mo | $570,000 | $265 | 37 |
| 105 South South Elmarch Ave | 0.59mi | 3/1.5 (-1) | 2,156 (-14%) | 15mo | $147,000 | $68 | 30 |
| 109 Taylor Dr | 0.65mi | 3/2.0 (-1) | 2,198 (-12%) | 18mo | $250,000 | $114 | 29 |
Match score weights: distance 35% · size 25% · config 20% · recency 20%. Top-matched comps best support the ARV.
Projected returns pro-forma
10.0% appreciation · 3.0% rent growth · sell at horizon
- IRR
- 27.5%
- Equity multiple
- 3.18×
- Total profit
- $115,603
- Equity at exit
- $170,266
- IRR
- 24.0%
- Equity multiple
- 7.24×
- Total profit
- $330,214
- Equity at exit
- $367,185
Cash invested: $52,920 (down + closing). Projections, not guarantees.
Landlord ↔ Tenant lean methodology
- Overall (STATE)
- 83 Strongly Landlord-Friendly
- State Kentucky
- 83 Strongly Landlord-Friendly · R+16
- County
- — inherits STATE
- City
- — inherits STATE
ZIP-level market 41031
- Home prices YoY
- 4.4%
- Active inventory
- 95
- Price-to-rent
- 9.5×
Monthly cashflow live
- Estimated rent
- $1,665 medium interval (Pro) →
- Mortgage (P&I)
- −$991
- Tax from tax record
- −$45 /mo · $543/yr
- Insurance
- −$79
- HOA
- −$0
- Vacancy / Maint / Mgmt
- −$350
- Net cashflow
- $200
Break-even live
UW: 25.0% down · 7.5% · 30yr · 1.5% tax · 5.0% vac · 8.0% maint · 8.0% mgmt
Financing live
Cash to close
- Down payment
- $47,250
- Closing costs
- $5,670
- Reserves months
- —
- Total cash needed
- —
Loan-product check · same deal, 3 products live
Conventional
25% down · 7.5% · 30yr
- Down + closing
- —
- Monthly P&I
- —
- Monthly cashflow
- —
- DSCR
- —
- Eligible?
- —
Personal DTI + credit; lowest rate.
DSCR
20% down · 8.5% · 30yr
- Down + closing
- —
- Monthly P&I
- —
- Monthly cashflow
- —
- DSCR
- —
- Eligible?
- —
No personal income docs; deal must DSCR.
Hard money
10% down · 12.0% · 12mo
- Down + closing
- —
- Monthly P&I
- —
- Monthly cashflow
- —
- DSCR
- —
- Eligible?
- —
Short-term bridge; refi at stabilization.
Listing history 13 events
-
2026-06-18days on market $189,000 Active 18 DOM
-
2026-06-17days on market $189,000 Active 17 DOM
-
2026-06-16days on market $189,000 Active 16 DOM
-
2026-06-15days on market $189,000 Active 15 DOM
-
2026-06-14days on market $189,000 Active 13 DOM
-
2026-06-10days on market $189,000 Active 10 DOM
-
2026-06-09days on market $189,000 Active 9 DOM
-
2026-06-08days on market $189,000 Active 8 DOM
-
2026-06-07days on market $189,000 Active 7 DOM
-
2026-06-03days on market $189,000 Active 3 DOM
-
2026-06-02days on market $189,000 Active 2 DOM
-
2026-06-01remarks 699-char remark
-
2026-06-01$189,000 Active 1 DOM
ⓘ Source: listings_history table (triggers on properties + properties_extension) + one-shot
backfill from property_details.listing_events for pre-trigger history.
Tax reassessment forecast KY · Resets to sale price
- Current annual tax
- $543 · $45/mo
- Projected year-2 tax
- $1,625 · $135/mo
- Expected delta
- +$1,083/yr (+$90/mo · 199.4%)
ⓘ Screening estimate from a state-policy table — verify with the county assessor before closing.
Climate risk First Street
- Flood 1/10 Low FEMA zone X (unshaded) · 0% chance over 30 yrs
- Wildfire 2/10 Low
- Heat 4/10 Moderate 7 d/yr ≥102°F today · 19 d/yr by 30 yrs out
- Wind 2/10 Low 2% chance of damaging wind over 30 yrs
- Air quality 2/10 Low 1 unhealthy d/yr today · 2 by 30 yrs out
Nearby sold comps map
Loading sold comps map…
Walkable amenities ~0.75 mi
Loading nearby amenities…
Taxation est. · year 1
- Rental income
- $19,982
- − Mortgage interest
- −$10,587
- − Property taxes
- −$543
- − Insurance
- −$945
- − Repairs & maintenance
- −$1,599
- − Management
- −$1,599
- − Depreciation
- −$5,498
- Taxable loss
- −$788
- Est. tax savings @ 24.0%
- +$189
- After-tax cash flow
- $2,593/yr
For passive investors: Depreciation is non-cash, so a rental often shows a tax loss while cash-flowing — sheltering income. Rental losses are passive: they offset passive income freely, and up to $25,000/yr can offset ordinary (W-2) income if you actively participate and your MAGI is under $100k (phasing out to $0 by $150k); unused losses carry forward. On sale, claimed depreciation is recaptured at up to 25%, and gains may owe capital-gains tax (a 1031 exchange can defer both). Figures are a year-1 estimate at your 24.0% rate — not tax advice; consult a CPA.
Schools (NCES district)
- District
- Harrison County
- NCES district ID
- 2102580
- Math proficiency
- 21% ▼ -25.00%
- Reading proficiency
- 32% ▼ -19.00%
- Median HH income
- $39,744
- Composite
- 22.28/100
- National rank
- #8138
- State rank
- #133 of 165 in KY
Livability — Cynthiana
- Score
- 74/100
- State rank
- #113
- US rank
- #4911
Category grades
Schools grade is shown separately in the Schools card above.
Census & demographics
- Census place
- Cynthiana, KY
- Population (ZIP)
- 16,748
Population outlook (Harrison County) Hauer SSP2
- Today (2025)
- 18,605 people
- By 2030
- 18,361 · -1.3%
- By 2040
- 17,685 · -4.9%
- By 2050
- 16,845 · -9.5%
- By 2075
- 14,882 · -20.0%
- By 2100
- 12,314 · -33.8%
Race, ethnicity, and origin ACS 2023
- Neighborhood character
- Predominantly White (93%)
- Race & ethnicity
- White 93% Two or more races 4% Hispanic / Latino 2% Black 2%
- Common ancestry
- Slovak 2% Serbian 2% Italian 2%
- Foreign-born
- 1% · Canada
- Languages at home
- 97% English-only · Spanish 1% German/W. Germanic 1%
Political lean MEDSL · Harrison
- 2024 margin
- Solid R (+48.5) · D 25.1% · R 73.6% · Other 1.3%
- 2008→2024 swing
- -27.4pp toward R · 2008: -21.1pp · 2024: -48.5pp
- All cycles
- 2024: R+48.5 2020: R+44.4 2016: R+43.8 2012: R+29.1 2008: R+21.1
Not yet ingested
- Civics
- —
Market trends
- HPI YoY
- ▲ 14.31%
- Current HPI
- 339.482
- Rent YoY
- —
- Metro
- —
- State GDP YoY
- ▲ 1.81%
- F500 in state
- 4
Industry mix (Fortune 500 HQ in KY)
| Industry | F500 HQs | Revenue |
|---|---|---|
| Healthcare | 1 | $118B |
|
||
| Food / Beverage | 1 | $7B |
|
||
Price history
+190.8% since first listed13 events — show timeline
- 2026-05-31 Listed $189,000 ImagineMLS
- 2017-09-01 Sold (Public Records) $33,500 Public Records
- 2017-08-29 Sold (Public Records) $33,500 Public Records
- 2017-07-31 Sold (MLS) $35,307 ImagineMLS
- 2017-07-06 Pending — ImagineMLS
- 2017-06-06 Price Changed $45,900 ImagineMLS
- 2017-05-19 Price Changed $50,900 ImagineMLS
- 2017-05-02 Price Changed $55,900 ImagineMLS
- 2017-03-24 Price Changed $65,100 ImagineMLS
- 2017-03-08 Price Changed $69,500 ImagineMLS
- 2017-02-17 Listed $74,200 ImagineMLS
- 2006-01-05 Sold (Public Records) $120,000 Public Records
- 1999-02-24 Sold (Public Records) $65,000 Public Records
Property tax history
-5.8%/yrLatest (2025): $543 · -0.6% YoY. Source: county tax records.
Cash-flow waterfall
monthlySold comps — $/sqft
last 12 mo · ≤1 miLoading sold comps…