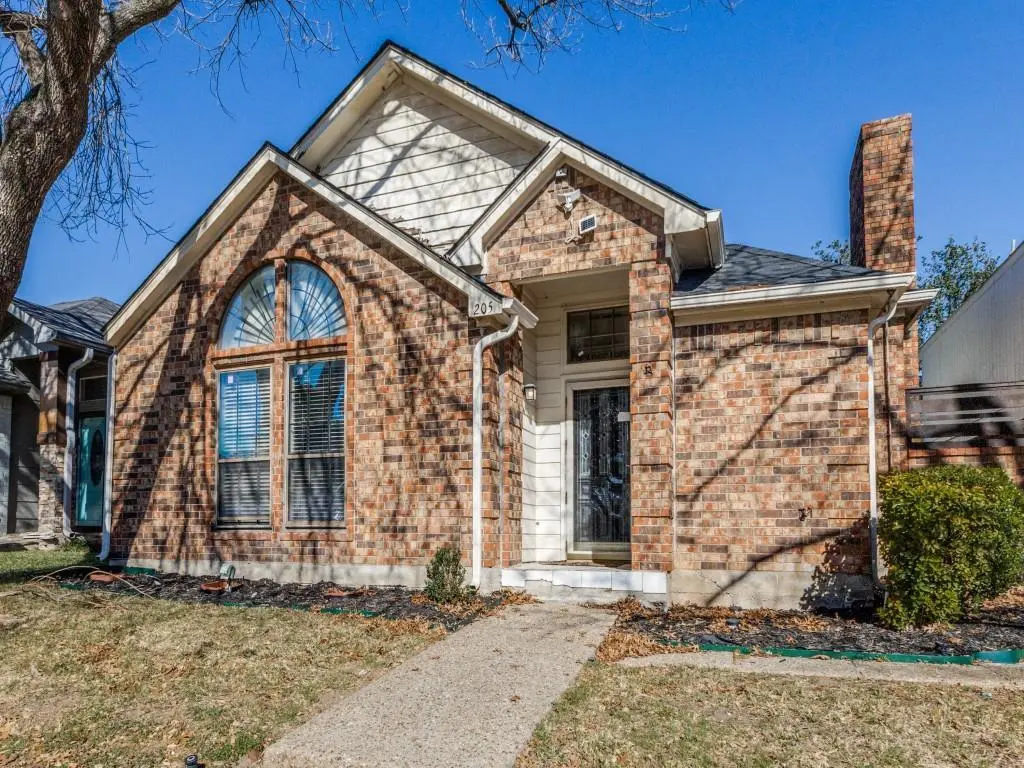
205 Benwynd Dr · Mesquite, TX
Flood risk 1/10 · Minimal
- FEMA flood zone
- X (unshaded)
- Chance of flooding over 30 yrs
- 0.0%
- Est. flood insurance / yr
- $507 – $1,088
Fire risk 1/10 · Minimal
- Est. fire insurance / yr
- $1,222 – $2,270
Heat risk 8/10 · Major
- Hot days now (above 110°F)
- 7 days/yr
- Hot days in 30 yrs
- 25 days/yr
Wind risk 6/10 · Moderate
- Chance of severe wind over 30 yrs
- 27.0%
Air-quality risk 2/10 · Minimal
- Unhealthy air days now
- 1 days/yr
- Unhealthy air days in 30 yrs
- 2 days/yr
Risk factors via First Street. Map © Google.
Why this score? — see what drove the D+ grade
The composite is a weighted blend of 9 inputs, each scored 0–100. Each bar is that input's sub-score; the figure is the points it added to the 100-point composite (weight × sub-score).
- ARV discount +15.0/15.0
- Cash flow +12.3/30.0
- 1% rule +4.8/10.0
- DSCR +3.7/10.0
- Livability +3.5/5.0
- Schools +2.9/10.0
- Rent growth +2.6/5.0
- Condition / age +2.5/5.0
- Appreciation +0.0/10.0
$244,900
🖨 Deal sheet 📄 Offer letter ✓ Due diligence
Listing remarks MLS
3 bedroom, 2.1 bath in Mesquite - 2 living areas , 2 dining areas, primary bedroom with 2 vanities, bathtub, separate shower and walk-in closet! Foreclosure being sold as-is. No repairs.
Key facts
- 3,790 sq ft lot
- 2 parking spots
- Built 1984
Neighborhood map
What this means for you Summary
Snapshot
- This is a 4-bed/2.5-bath single-family listed at $245k.
Deal economics
- At list price, monthly cash flow is $-44 ($-526/yr) — negative.
- To cash-flow at today's rent, offer at most $237k (3.2% below list).
- To meet the 1% rule (rent ≥ 1% of price), the offer needs to be $241k (1.7% below list).
- Recommended offer: $216k (12.0% below list) — sets the bar for market timing.
- Cap rate 6.1% vs local median 4.4% in Mesquite — top-decile yield for the area; either an underpriced asset or a hidden risk that comps aren't pricing in. Stress-test before assuming the spread holds.
Location & tenants
- Location reads 70/100 on livability (#358 in TX) — a middle-class / working-renter tenant base. Strengths: cost of living A+, housing A+, health & safety A-; Watch: schools C-, crime F, commute F.
- Mesquite ISD (suburban): math 35% / reading 32% proficiency, ranked #536 of 826 in TX (top 65%) — families likely to look elsewhere, expect single-tenant / working-renter base with shorter leases; 63% free/reduced lunch — lower-income household profile, screen leases tightly.
- Market conditions: Rents flat; 340 active listings in the ZIP; 8 comparable units currently listed for rent nearby; rentals lingering (median 44d on market — plan ~5-8 weeks vacancy on turnover, expect pricing pressure); 50% of comp listings sitting > 30 days — soft ceiling on asking rent; 12,577 units permitted in Dallas County in 2024 (6,829 in 5+ unit buildings).
- This rent runs 41% of the median local income ($71k/yr) — at the standard rent-burdened threshold; future hikes will face affordability resistance.
Forward outlook
- Local home prices are declining (-3.0%/yr); year-one equity from $2k of loan paydown is wiped out by about $7k of value loss. Plan a longer hold.
- Dallas County population projected at +35% by 2050 — long-run rental-demand tailwind backs the buy-and-hold thesis.
Negotiation context
- It's been on market 132 days — a 12% lower offer ($216k) is reasonable based on typical stale-listing flexibility.
- 11 sale attempts since 13y ago; this cycle's ask has dropped $45k (16%) from the opening price — seller is motivated, your offer sets the floor, not the list.
- Current owner paid $85k; list at $245k implies a 188% gain — meaningful room to come down on a strong offer.
Risks & watch-outs
- Watch-outs: property tax is 2.7% of price.
- Climate carrying-cost: major wind risk, 27% chance of damaging wind over 30y; extreme-heat days projected 7→25/yr by 2055 (HVAC capex compounding) — expect insurance premiums to compound above CPI over the hold.
Questions for the listing agent
- What do current leases actually rent for vs. the listed asking? Can we see a recent rent roll and the last 12 months of T-12 income?
- It's been on market 132 days. Have you received any prior offers? Is the seller open to a 12% concession, seller financing, or rate buy-down credit?
- Property tax is high relative to price — has the assessment been appealed recently, and will the sale trigger a re-assessment?
- Why hasn't it sold? Are there any deal-killer items the seller is aware of (foundation, flood, title, zoning, code violations)?
- Is there a deadline driving the sale (1031 exchange, divorce, estate, relocation)? That informs how much negotiation room exists.
- Crime grade is F in this area — have there been break-ins, vandalism, or insurance claims at this property in the last 3 years? What carrier currently insures it and at what premium?
- The area grade is low — what's the realistic commute time and amenity access for the typical tenant pool here? Any planned neighborhood developments (good or bad) we should know about?
- What's the average days-on-market for RENTAL listings here right now (not sales)? A rising rental-DOM trend means longer vacancies and softer asking-rent achievability than the comps imply.
- What's the recent tenant-quality profile in this submarket — average credit score on applications, eviction rate, late-payment / NSF rate, and stable-employment percentage? A property-management company in the area should have these aggregated.
- How much new for-sale + rental construction is in the pipeline within 1–3 miles? Heavy new supply typically softens prices + rents 12–24 months out; constrained supply supports both.
Investment metrics
- 1% rule
- 0.98% ✗
- Cap rate
- 6.08%
- Cash-on-cash
- -0.77%
- DSCR
- 0.97
- GRM
- 8.5
CMA / ARV
- ARV (median comp)
- $346,613
- List price
- $244,900
- Delta
- -29.34%
- Verdict
- UNDERPRICED
- Comps
- 20 within 1.0 mi
Show comp detail 12 sales within ~0.75 mi
| Address | Dist | Beds/Ba | Sqft | Sold | Price | $/sf | Match |
|---|---|---|---|---|---|---|---|
| 922 Lakeshore Dr | 0.17mi | 4/3.5 | 2,434 (-4%) | 9mo | $449,000 | $184 | 75 |
| 427 Riggs Cir | 0.42mi | 4/2.5 | 2,560 (+2%) | 5mo | $449,900 | $176 | 74 |
| 928 Tiffany Ln | 0.27mi | 3/2.5 (-1) | 2,658 (+5%) | 4mo | $374,999 | $141 | 70 |
| 915 Tiffany Ln | 0.31mi | 4/3.0 | 2,424 (-4%) | 10mo | $450,000 | $186 | 69 |
| 602 Creekbend Dr | 0.37mi | 3/2.5 (-1) | 2,632 (+4%) | 3mo | $429,900 | $163 | 68 |
| 813 Lakeshore Dr | 0.17mi | 4/3.5 | 2,736 (+8%) | 10mo | $459,000 | $168 | 66 |
| 104 Toler Dr | 0.41mi | 4/3.0 | 2,300 (-9%) | 9mo | $308,900 | $134 | 56 |
| 706 Cedar Dr | 0.48mi | 4/2.5 | 2,180 (-14%) | 0mo | $399,900 | $183 | 54 |
| 201 Running Brook Ln | 0.61mi | 4/3.0 | 2,661 (+6%) | 8mo | $320,000 | $120 | 53 |
| 519 S Galloway Ave | 0.32mi | 4/2.5 | 2,172 (-14%) | 14mo | $279,000 | $128 | 50 |
| 402 S Walker St | 0.53mi | 3/2.0 (-1) | 2,294 (-9%) | 6mo | $239,900 | $105 | 48 |
| 532 Kathy Dr | 0.59mi | 3/2.0 (-1) | 2,201 (-13%) | 13mo | $400,000 | $182 | 34 |
Match score weights: distance 35% · size 25% · config 20% · recency 20%. Top-matched comps best support the ARV.
Projected returns pro-forma
-3.0% appreciation · 0.22% rent growth · sell at horizon
- IRR
- -21.1%
- Equity multiple
- 0.29×
- Total profit
- $-48,837
- Equity at exit
- $36,515
- IRR
- -24.4%
- Equity multiple
- -0.03×
- Total profit
- $-70,780
- Equity at exit
- $21,174
Cash invested: $68,572 (down + closing). Projections, not guarantees.
Landlord ↔ Tenant lean methodology
- Overall (STATE)
- 87 Strongly Landlord-Friendly
- State Texas
- 87 Strongly Landlord-Friendly · R+5
- County
- — inherits STATE
- City
- — inherits STATE
ZIP-level market 75149
- Home prices YoY
- -27.4%
- Rents YoY
- 0.2%
- Active inventory
- 340
- Price-to-rent
- 8.5×
Monthly cashflow live
- Estimated rent
- $2,408 high interval (Pro) →
- Mortgage (P&I)
- −$1,284
- Tax from tax record
- −$560 /mo · $6,722/yr
- Insurance
- −$102
- HOA
- −$0
- Vacancy / Maint / Mgmt
- −$506
- Net cashflow
- $-44
Break-even live
UW: 25.0% down · 7.5% · 30yr · 1.5% tax · 5.0% vac · 8.0% maint · 8.0% mgmt
Financing live
Cash to close
- Down payment
- $61,225
- Closing costs
- $7,347
- Reserves months
- —
- Total cash needed
- —
Loan-product check · same deal, 3 products live
Conventional
25% down · 7.5% · 30yr
- Down + closing
- —
- Monthly P&I
- —
- Monthly cashflow
- —
- DSCR
- —
- Eligible?
- —
Personal DTI + credit; lowest rate.
DSCR
20% down · 8.5% · 30yr
- Down + closing
- —
- Monthly P&I
- —
- Monthly cashflow
- —
- DSCR
- —
- Eligible?
- —
No personal income docs; deal must DSCR.
Hard money
10% down · 12.0% · 12mo
- Down + closing
- —
- Monthly P&I
- —
- Monthly cashflow
- —
- DSCR
- —
- Eligible?
- —
Short-term bridge; refi at stabilization.
Rent comps 8 comps
| Address | Beds | Baths | Sqft | Rent | $/sqft | DOM | Units | Dist |
|---|---|---|---|---|---|---|---|---|
| 904 Tiffany Ln Unit 1019527P Mesquite, TX | 5.0 | 3.0 | 3272 | $13,340 | $4.08 | 22d | 1 | 0.29mi |
| 904 Tiffany Ln Mesquite, TX | 5.0 | 3.0 | 3278 | $9,750 | $2.97 | 22d | 1 | 0.29mi |
| 1513 Colborne Dr Mesquite, TX | 3.0 | 2.0 | 1805 | $2,045 | $1.13 | 44d | 1 | 0.77mi |
| 1005 Chelsea Dr Mesquite, TX | 3.0 | 2.0 | 1861 | $2,200 | $1.18 | 24d | 1 | 0.86mi |
| 1626 Rancho Dr Mesquite, TX | 4.0 | 2.0 | 2562 | $2,419 | $0.94 | 24d | 1 | 0.96mi |
| 12719 Bluffview Dr Balch Springs, TX | 3.0 | 2.5 | 1788 | $2,300 | $1.29 | 44d | 1 | 1.02mi |
| 1416 Poplar Dr Mesquite, TX | 4.0 | 2.5 | 2052 | $2,400 | $1.17 | 44d | 1 | 1.08mi |
| 732 Creekview Ct Mesquite, TX | 5.0 | 3.0 | 2313 | $3,495 | $1.51 | 44d | 1 | 1.45mi |
Listing history 50 events
-
2026-06-18days on market $244,900 Active 132 DOM
-
2026-06-17days on market $244,900 Active 131 DOM
-
2026-06-16days on market $244,900 Active 130 DOM
-
2026-06-15days on market $244,900 Active 129 DOM
-
2026-06-13days on market $244,900 Active 127 DOM
-
2026-06-13days on market $244,900 Active 126 DOM
-
2026-06-09days on market $244,900 Active 123 DOM
-
2026-06-08days on market $244,900 Active 122 DOM
-
2026-06-07days on market $244,900 Active 121 DOM
-
2026-06-04days on market $244,900 Active 118 DOM
-
2026-06-03days on market $244,900 Active 117 DOM
-
2026-06-02days on market $244,900 Active 116 DOM
-
2026-06-01days on market $244,900 Active 115 DOM
-
2026-05-31days on market $244,900 Active 114 DOM
-
2026-04-29price $249,900 191-char remark
Show marketing remark (191 chars)
3 bedroom, 2.1 bath in Mesquite - 2 living areas , 2 dining areas, primary bedroom with 2 vanities, bathtub, separate shower and walk-in closet! Foreclosure being sold as-is. No repairs.
-
2026-04-29status Active 191-char remark
Show marketing remark (191 chars)
3 bedroom, 2.1 bath in Mesquite - 2 living areas , 2 dining areas, primary bedroom with 2 vanities, bathtub, separate shower and walk-in closet! Foreclosure being sold as-is. No repairs.
-
2026-03-30price $259,900 191-char remark
Show marketing remark (191 chars)
3 bedroom, 2.1 bath in Mesquite - 2 living areas , 2 dining areas, primary bedroom with 2 vanities, bathtub, separate shower and walk-in closet! Foreclosure being sold as-is. No repairs.
-
2026-02-27price $264,900 191-char remark
Show marketing remark (191 chars)
3 bedroom, 2.1 bath in Mesquite - 2 living areas , 2 dining areas, primary bedroom with 2 vanities, bathtub, separate shower and walk-in closet! Foreclosure being sold as-is. No repairs.
-
2026-01-29soldstatus
-
2026-01-13$289,900 Active 191-char remark
Show marketing remark (191 chars)
3 bedroom, 2.1 bath in Mesquite - 2 living areas , 2 dining areas, primary bedroom with 2 vanities, bathtub, separate shower and walk-in closet! Foreclosure being sold as-is. No repairs.
-
2025-12-09historical
-
2025-10-14$319,900 Active
-
2025-09-30historical
-
2024-12-14historical $2,500
-
2024-09-24$319,900 Active
-
2024-09-23historical
-
2024-08-26price $324,800
-
2024-08-02$2,500
-
2024-08-01price $324,900
-
2024-07-27price $339,800
-
2024-07-16price $339,900
-
2024-06-26$349,900 Active
-
2024-06-25historical
-
2024-06-18$349,900 Active
-
2023-09-05soldstatus
-
2023-09-01soldstatus Closed
-
2023-08-22status Pending
-
2023-08-14historical Active Option Contract
-
2023-08-10price $317,000
-
2023-07-29price $319,700
-
2023-07-29price $324,700
-
2023-07-29price $325,000
-
2023-07-28price $327,000
-
2023-07-28price $328,500
-
2023-07-21price $328,700
-
2023-07-15price $329,000
-
2023-07-13price $337,500
-
2023-07-10price $337,000
-
2023-07-06price $347,700
-
2023-07-01$349,000 Active
ⓘ Source: listings_history table (triggers on properties + properties_extension) + one-shot
backfill from property_details.listing_events for pre-trigger history.
Tax reassessment forecast TX · Resets to sale price
- Current annual tax
- $6,722 · $560/mo
- Projected year-2 tax
- $6,722 · $560/mo
- Expected delta
- $0/yr ($0/mo · 0.0%)
ⓘ Screening estimate from a state-policy table — verify with the county assessor before closing.
Climate risk First Street
- Flood 1/10 Low FEMA zone X (unshaded) · 0% chance over 30 yrs
- Wildfire 1/10 Low
- Heat 8/10 Severe 7 d/yr ≥110°F today · 25 d/yr by 30 yrs out
- Wind 6/10 Major 27% chance of damaging wind over 30 yrs
- Air quality 2/10 Low 1 unhealthy d/yr today · 2 by 30 yrs out
Nearby sold comps map
Loading sold comps map…
Walkable amenities ~0.75 mi
Loading nearby amenities…
Taxation est. · year 1
- Rental income
- $28,902
- − Mortgage interest
- −$13,718
- − Property taxes
- −$6,722
- − Insurance
- −$1,224
- − Repairs & maintenance
- −$2,312
- − Management
- −$2,312
- − Depreciation
- −$7,124
- Taxable loss
- −$4,512
- Est. tax savings @ 24.0%
- +$1,083
- After-tax cash flow
- $557/yr
For passive investors: Depreciation is non-cash, so a rental often shows a tax loss while cash-flowing — sheltering income. Rental losses are passive: they offset passive income freely, and up to $25,000/yr can offset ordinary (W-2) income if you actively participate and your MAGI is under $100k (phasing out to $0 by $150k); unused losses carry forward. On sale, claimed depreciation is recaptured at up to 25%, and gains may owe capital-gains tax (a 1031 exchange can defer both). Figures are a year-1 estimate at your 24.0% rate — not tax advice; consult a CPA.
Schools (NCES district)
- District
- Mesquite ISD
- NCES district ID
- 4830390
- Math proficiency
- 35% ▼ -11.00%
- Reading proficiency
- 32% ▼ -7.00%
- Median HH income
- $49,372
- Composite
- 29.06/100
- National rank
- #6606
- State rank
- #536 of 826 in TX
Livability — Mesquite
- Score
- 70/100
- State rank
- #358
- US rank
- #7743
Category grades
Schools grade is shown separately in the Schools card above.
Census & demographics
- Census place
- Mesquite, TX
- County
- Dallas County · 2,612,404 people
- City population
- 150,788
- Metro
- Dallas-Fort Worth-Arlington, TX
- Population (ZIP)
- 58,262
- Household income
- $70,774
- Rent vs Own
- Severe rent burden
- 2266.0
Population outlook (Dallas County) Hauer SSP2
- Today (2025)
- 2,979,839 people
- By 2030
- 3,191,823 · +7.1%
- By 2040
- 3,619,611 · +21.5%
- By 2050
- 4,026,915 · +35.1%
- By 2075
- 4,957,073 · +66.4%
- By 2100
- 5,508,725 · +84.9%
Race, ethnicity, and origin ACS 2023
- Neighborhood character
- Diverse neighborhood (Simpson 0.65)
- Race & ethnicity
- Hispanic / Latino 49% White 25% Two or more races 21% Black 20% Asian 2% Native American 1%
- Hispanic origin (detail)
- Mexican 42% Cuban 1%
- Common ancestry
- Italian 1% Iranian 1% Serbian 1%
- Foreign-born
- 22% · Canada, Vietnam
- Languages at home
- 58% English-only · Spanish 39% Other Asian/Pacific 1% Vietnamese 1%
Political lean MEDSL · Dallas
- 2024 margin
- Strong D (+22.2) · D 60.2% · R 38.0% · Other 1.8%
- 2008→2024 swing
- +6.9pp toward D · 2008: 15.3pp · 2024: 22.2pp
- All cycles
- 2024: D+22.2 2020: D+31.6 2016: D+26.2 2012: D+15.4 2008: D+15.3
Not yet ingested
- Civics
- —
Market trends
- HPI YoY
- ▼ -130.12%
- Current HPI
- 345.6606
- Rent YoY
- ▲ 0.22%
- Metro
- Dallas-Fort Worth-Arlington, TX
- State GDP YoY
- ▲ 3.95%
- F500 in state
- 110
Industry mix (Fortune 500 HQ in TX)
| Industry | F500 HQs | Revenue |
|---|---|---|
| Energy | 16 | $1,198B |
|
||
| Technology | 5 | $198B |
|
||
| Engineering / Construction | 4 | $72B |
|
||
| Energy Services | 3 | $60B |
|
||
| Utilities | 3 | $41B |
|
||
| Healthcare | 2 | $330B |
|
||
Price history
+193.6% since first listed53 events — show timeline
- 2026-04-29 Price Changed $249,900 NTREIS
- 2026-04-29 Relisted — NTREIS
- 2026-03-30 Price Changed $259,900 NTREIS
- 2026-02-27 Price Changed $264,900 NTREIS
- 2026-01-29 Sold (Public Records) — Public Records
- 2026-01-13 Listed $289,900 NTREIS
- 2025-12-09 Listing Removed — NTREIS
- 2025-10-14 Listed $319,900 NTREIS
- 2025-09-30 Listing Removed — NTREIS
- 2024-12-14 Rental Removed $2,500 NTREIS
- 2024-09-24 Listed $319,900 NTREIS
- 2024-09-23 Listing Removed — NTREIS
- 2024-08-26 Price Changed $324,800 NTREIS
- 2024-08-02 Listed for Rent $2,500 NTREIS
- 2024-08-01 Price Changed $324,900 NTREIS
- 2024-07-27 Price Changed $339,800 NTREIS
- 2024-07-16 Price Changed $339,900 NTREIS
- 2024-06-26 Listed $349,900 NTREIS
- 2024-06-25 Listing Removed — NTREIS
- 2024-06-18 Listed $349,900 NTREIS
- 2023-09-05 Sold (Public Records) — Public Records
- 2023-09-01 Sold (MLS) — NTREIS
- 2023-08-22 Pending — NTREIS
- 2023-08-14 Contingent — NTREIS
- 2023-08-10 Price Changed $317,000 NTREIS
- 2023-07-29 Price Changed $319,700 NTREIS
- 2023-07-29 Price Changed $324,700 NTREIS
- 2023-07-29 Price Changed $325,000 NTREIS
- 2023-07-28 Price Changed $327,000 NTREIS
- 2023-07-28 Price Changed $328,500 NTREIS
- 2023-07-21 Price Changed $328,700 NTREIS
- 2023-07-15 Price Changed $329,000 NTREIS
- 2023-07-13 Price Changed $337,500 NTREIS
- 2023-07-10 Price Changed $337,000 NTREIS
- 2023-07-06 Price Changed $347,700 NTREIS
- 2023-07-01 Listed $349,000 NTREIS
- 2018-03-23 Sold (Public Records) — Public Records
- 2018-03-21 Sold (MLS) — NTREIS
- 2018-03-06 Pending — NTREIS
- 2018-02-22 Contingent — NTREIS
- 2018-02-19 Relisted — NTREIS
- 2018-02-13 Contingent — NTREIS
- 2018-01-08 Price Changed $189,500 NTREIS
- 2017-10-31 Listed $208,500 NTREIS
- 2013-07-24 Sold (Public Records) — Public Records
- 2013-06-10 Listing Removed — NTREIS
- 2013-06-04 Sold (MLS) — NTREIS
- 2013-05-21 Contingent — NTREIS
- 2013-04-18 Price Changed $125,000 NTREIS
- 2013-04-04 Listed $135,000 NTREIS
- 2013-01-11 Sold (Public Records) — Public Records
- 1996-10-02 Sold (Public Records) $85,120 Public Records
- 1996-10-02 Sold (Public Records) — Public Records
Property tax history
+4.7%/yrLatest (2025): $6,722 · -4.2% YoY. Source: county tax records.
Cash-flow waterfall
monthlySold comps — $/sqft
last 12 mo · ≤1 miLoading sold comps…