8 Clover Ln · Loudonville, NY
Flood risk 1/10 · Minimal
- FEMA flood zone
- X (unshaded)
- Chance of flooding over 30 yrs
- 0.0%
- Est. flood insurance / yr
- $507 – $1,088
Fire risk 1/10 · Minimal
- Est. fire insurance / yr
- $691 – $1,283
Heat risk 3/10 · Minor
- Hot days now (above 97°F)
- 7 days/yr
- Hot days in 30 yrs
- 15 days/yr
Wind risk 3/10 · Minor
- Chance of severe wind over 30 yrs
- 7.0%
Air-quality risk 1/10 · Minimal
- Unhealthy air days now
- 0 days/yr
- Unhealthy air days in 30 yrs
- 0 days/yr
Risk factors via First Street. Map © Google.
Why this score? — see what drove the C grade
The composite is a weighted blend of 9 inputs, each scored 0–100. Each bar is that input's sub-score; the figure is the points it added to the 100-point composite (weight × sub-score).
- Cash flow +18.1/30.0
- ARV discount +13.9/15.0
- Schools +6.4/10.0
- DSCR +5.7/10.0
- 1% rule +4.7/10.0
- Rent growth +2.5/5.0
- Livability +2.5/5.0
- Condition / age +2.5/5.0
- Appreciation +0.0/10.0
$269,000
🖨 Deal sheet (PDF) 📄 Offer letter ✓ Due diligence
Listing remarks
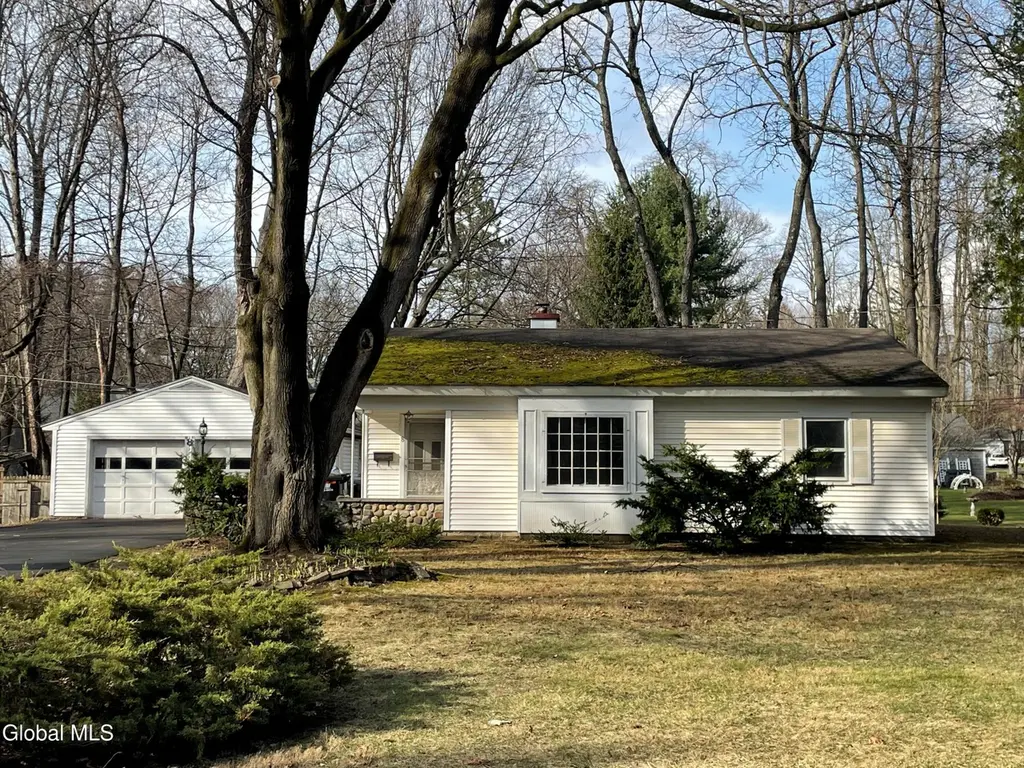
Welcome to a rare opportunity to own a home in the highly desirable Loudonville area and award-winning school district. This home is ideal for investors, renovators, or buyers looking to create their dream home in the Capital Region's most sought-after neighborhoods. The property includes a two-car garage, sits on a spacious lot on a dead end street, and is conveniently located near shopping, dining, and major highways. Priced accordingly to reflect its condition, this property is being sold ''as-is'', offering a great opportunity for buyers to bring their vision and make it their own. Open House- Saturday 4/18/26 - 12:00-1:30pm
Key facts
- Spacious lot
- Dead end street
- 0.35 acre lot
Tags
Property features AI
Exterior
- Parking: Attached garage with 2 garage spaces; Paved driveway; Total parking for 6 vehicles
- Utilities: Public water; Public sewer
- Home design: Single family residence; Fixer condition
- Construction: Vinyl siding; Shingle/asphalt roof
- Exterior features: Level, private, cleared lot; Main road frontage approximately 140 feet
Interior
- Kitchen: Kitchen on the first floor
- Bedrooms: Two bedrooms on the first floor
- Flooring: Linoleum flooring
- Bathrooms: One full bathroom on the first floor
- Heating & cooling: Baseboard heating; Electric heating; Oil heating
- Interior features: Five total rooms; French doors; Aluminum-framed windows; Slab foundation (no basement)
- Laundry & utility: Common area laundry
Neighborhood map
What this means for you Summary
Snapshot
- This is a 2-bed/1.0-bath single-family listed at $269k.
Deal economics
- At list price, monthly cash flow is $237 ($3k/yr) — positive.
- The deal already cash-flows at list — no discount required.
- To meet the 1% rule (rent ≥ 1% of price), the offer needs to be $260k (3.3% below list).
- Recommended offer: $260k (3.3% below list) — sets the bar for 1% rule.
- Cap rate 7.4% vs local median 2.8% in Loudonville — top-decile yield for the area; either an underpriced asset or a hidden risk that comps aren't pricing in. Stress-test before assuming the spread holds.
Location & tenants
- Location reads: area grade C — affects rentability + tenant quality, not the cash-flow math above.
- North Colonie CSD (suburban): math 70% / reading 76% proficiency, ranked #102 of 590 in NY (top 17%) — strong family-tenant draw, lease renewals of 3-5y typical; only 13% free/reduced lunch — higher-income household profile.
- Zoned schools: Loudonville School (math 77% / reading 72%, grade A, #314 of 2,108 statewide, top 17%, 287 students, 14% FRL); Shaker Middle School (math 54% / reading 72%, grade B+, #129 of 729 statewide, top 18%, 1,423 students, 26% FRL); Shaker High School (math 98% / reading 93%, grade A+, #76 of 1,100 statewide, top 7%, 2,018 students, 25% FRL).
- Market conditions: 40 active listings in the ZIP; 2 comparable units currently listed for rent nearby; 675 units permitted in Albany County in 2024 (451 in 5+ unit buildings).
Forward outlook
- Local home prices are declining (-3.0%/yr); year-one equity from $2k of loan paydown is wiped out by about $8k of value loss. Plan a longer hold.
- Albany County population projected at +9% by 2050 — modest demand growth; plan on rents tracking national, not racing it.
Negotiation context
- It's been on market 16 days — a 2% lower offer ($265k) is reasonable based on typical stale-listing flexibility.
Risks & watch-outs
- Watch-outs: built in 1954 — expect roof / HVAC / electrical / plumbing capex.
Questions for the listing agent
- Built in 1954 — when were the roof, HVAC, electrical panel, plumbing, and water heater last replaced?
- Is there a deadline driving the sale (1031 exchange, divorce, estate, relocation)? That informs how much negotiation room exists.
- What's the average days-on-market for RENTAL listings here right now (not sales)? A rising rental-DOM trend means longer vacancies and softer asking-rent achievability than the comps imply.
- What's the recent tenant-quality profile in this submarket — average credit score on applications, eviction rate, late-payment / NSF rate, and stable-employment percentage? A property-management company in the area should have these aggregated.
- How much new for-sale + rental construction is in the pipeline within 1–3 miles? Heavy new supply typically softens prices + rents 12–24 months out; constrained supply supports both.
Investment metrics
- 1% rule
- 0.97% ✗
- Cap rate
- 7.35%
- Cash-on-cash
- 3.78%
- DSCR
- 1.17
- GRM
- 8.6
CMA / ARV
- ARV (on-the-fly)
- $313,372
- Comps found
- 7
Show comp detail 7 sales within ~0.75 mi
| Address | Dist | Beds/Ba | Sqft | Sold | Price | $/sf | Match |
|---|---|---|---|---|---|---|---|
| 322 Osborne Rd | 0.16mi | 2/1.0 | 950 (-5%) | 1mo | $389,000 | $409 | 84 |
| 270 Osborne Rd | 0.67mi | 2/1.0 | 1,048 (+5%) | 8mo | $255,000 | $243 | 54 |
| 7 Twilight Ter | 0.74mi | 3/2.0 (+1) | 987 (-1%) | 9mo | $360,000 | $365 | 47 |
| 4 Krug Ct | 0.67mi | 3/1.0 (+1) | 1,083 (+8%) | 5mo | $340,000 | $314 | 45 |
| 25 Frantone Ln | 0.55mi | 3/1.5 (+1) | 1,096 (+10%) | 7mo | $390,000 | $356 | 45 |
| 21 Tipton Dr | 0.59mi | 3/1.5 (+1) | 1,100 (+10%) | 15mo | $242,500 | $220 | 36 |
| 2 Charming Ln | 0.66mi | 2/1.0 | 1,140 (+14%) | 19mo | $236,734 | $208 | 30 |
Match score weights: distance 35% · size 25% · config 20% · recency 20%. Top-matched comps best support the ARV.
Projected returns pro-forma
-3.0% appreciation · 3.0% rent growth · sell at horizon
- IRR
- -10.4%
- Equity multiple
- 0.62×
- Total profit
- $-28,479
- Equity at exit
- $40,109
- IRR
- -1.0%
- Equity multiple
- 0.93×
- Total profit
- $-5,304
- Equity at exit
- $23,258
Cash invested: $75,320 (down + closing). Projections, not guarantees.
Landlord ↔ Tenant lean methodology
- Overall (STATE)
- 15 Strongly Tenant-Friendly
- State New York
- 15 Strongly Tenant-Friendly · D+10
- County
- — inherits STATE
- City
- — inherits STATE
ZIP-level market 12211
- Active inventory
- 40
- Price-to-rent
- 8.6×
Monthly cashflow live
- Estimated rent
- $2,600 medium interval (Pro) →
- Mortgage (P&I)
- −$1,411
- Tax from tax record
- −$294 /mo · $3,530/yr
- Insurance
- −$112
- HOA
- −$0
- Vacancy / Maint / Mgmt
- −$546
- Net cashflow
- $237
Break-even live
Sensitivity live
| Price | -10% $389 | -5% $313 | +0% $237 | +5% $161 | +10% $85 |
|---|---|---|---|---|---|
| Rent | -10% $32 | -5% $134 | +0% $237 | +5% $340 | +10% $442 |
| Rate | -1.0pp $373 | -0.5pp $305 | base $237 | +0.5pp $167 | +1.0pp $96 |
UW: 25.0% down · 7.5% · 30yr · 1.5% tax · 5.0% vac · 8.0% maint · 8.0% mgmt
Financing live
Cash to close
- Down payment
- $67,250
- Closing costs
- $8,070
- Reserves months
- —
- Total cash needed
- —
Loan-product check · same deal, 3 products live
Conventional
25% down · 7.5% · 30yr
- Down + closing
- —
- Monthly P&I
- —
- Monthly cashflow
- —
- DSCR
- —
- Eligible?
- —
Personal DTI + credit; lowest rate.
DSCR
20% down · 8.5% · 30yr
- Down + closing
- —
- Monthly P&I
- —
- Monthly cashflow
- —
- DSCR
- —
- Eligible?
- —
No personal income docs; deal must DSCR.
Hard money
10% down · 12.0% · 12mo
- Down + closing
- —
- Monthly P&I
- —
- Monthly cashflow
- —
- DSCR
- —
- Eligible?
- —
Short-term bridge; refi at stabilization.
Rent comps 2 comps
| Address | Beds | Baths | Sqft | Rent | $/sqft | DOM | Units | Dist |
|---|---|---|---|---|---|---|---|---|
| 41 Oakwood Dr Albany, NY | 2.0 | 1.0 | 1008 | $2,600 | $2.58 | 25d | 1 | 1.21mi |
| 41 Oakwood Dr Albany, NY | 2.0 | 1.0 | 1008 | $2,600 | $2.58 | 45d | 1 | 1.21mi |
Listing history 3 events
-
2026-05-01status Pending
-
2026-04-30historical Contingent
-
2026-04-15$269,000 Active
ⓘ Source: listings_history table (triggers on properties + properties_extension) + one-shot
backfill from property_details.listing_events for pre-trigger history.
Tax reassessment forecast NY · Partial reset (capped growth)
- Current annual tax
- $3,530 · $294/mo
- Projected year-2 tax
- $4,038 · $337/mo
- Expected delta
- +$508/yr (+$42/mo · 14.4%)
ⓘ Screening estimate from a state-policy table — verify with the county assessor before closing.
Climate risk First Street
- Flood 1/10 Low FEMA zone X (unshaded) · 0% chance over 30 yrs
- Wildfire 1/10 Low
- Heat 3/10 Moderate 7 d/yr ≥97°F today · 15 d/yr by 30 yrs out
- Wind 3/10 Moderate 7% chance of damaging wind over 30 yrs
- Air quality 1/10 Low 0 unhealthy d/yr today · 0 by 30 yrs out
Nearby sold comps map
Loading sold comps map…
Walkable amenities ~0.75 mi
Loading nearby amenities…
Taxation est. · year 1
- Rental income
- $31,200
- − Mortgage interest
- −$15,068
- − Property taxes
- −$3,530
- − Insurance
- −$1,345
- − Repairs & maintenance
- −$2,496
- − Management
- −$2,496
- − Depreciation
- −$7,825
- Taxable loss
- −$1,561
- Est. tax savings @ 24.0%
- +$375
- After-tax cash flow
- $3,219/yr
For passive investors: Depreciation is non-cash, so a rental often shows a tax loss while cash-flowing — sheltering income. Rental losses are passive: they offset passive income freely, and up to $25,000/yr can offset ordinary (W-2) income if you actively participate and your MAGI is under $100k (phasing out to $0 by $150k); unused losses carry forward. On sale, claimed depreciation is recaptured at up to 25%, and gains may owe capital-gains tax (a 1031 exchange can defer both). Figures are a year-1 estimate at your 24.0% rate — not tax advice; consult a CPA.
Schools (NCES district)
- District
- North Colonie CSD
- NCES district ID
- 3621000
- Math proficiency
- 70% ▼ -5.00%
- Reading proficiency
- 76% ▲ 8.00%
- Median HH income
- $74,762
- Composite
- 64.2/100
- National rank
- #565
- State rank
- #102 of 590 in NY
Livability — Loudonville
No livability data for this city. (Only ~50 U.S. cities are tracked.)
Census & demographics
- Census place
- Loudonville, NY
- City population
- 13,800
- Population (ZIP)
- 13,800
Population outlook (Albany County) Hauer SSP2
- Today (2025)
- 320,794 people
- By 2030
- 327,401 · +2.1%
- By 2040
- 338,218 · +5.4%
- By 2050
- 348,467 · +8.6%
- By 2075
- 381,693 · +19.0%
- By 2100
- 393,809 · +22.8%
Race, ethnicity, and origin ACS 2023
- Neighborhood character
- Predominantly White (74%)
- Race & ethnicity
- White 74% Asian 10% Two or more races 7% Hispanic / Latino 7% Black 4%
- Hispanic origin (detail)
- Puerto Rican 1%
- Common ancestry
- Romanian 6% Lithuanian 4% Iranian 2%
- Foreign-born
- 10% · Canada, China, Jamaica
- Languages at home
- 89% English-only · Other Indo-European 2% Other Asian/Pacific 2% Arabic 2%
Political lean MEDSL · Albany
- 2024 margin
- Strong D (+25.8) · D 62.9% · R 37.1%
- 2008→2024 swing
- -3.6pp toward R · 2008: 29.4pp · 2024: 25.8pp
- All cycles
- 2024: D+25.8 2020: D+31.4 2016: D+24.3 2012: D+31.0 2008: D+29.4
Not yet ingested
- Civics
- —
Market trends
- HPI YoY
- ▼ -250.22%
- Current HPI
- 290.4282
- Rent YoY
- —
- Metro
- —
- State GDP YoY
- ▲ 2.60%
- F500 in state
- 92
Industry mix (Fortune 500 HQ in NY)
| Industry | F500 HQs | Revenue |
|---|---|---|
| Financial Services | 10 | $950B |
|
||
| Consumer Goods | 9 | $162B |
|
||
| Insurance | 4 | $225B |
|
||
| Telecommunications | 2 | $144B |
|
||
| Pharmaceuticals | 2 | $112B |
|
||
| Media / Entertainment | 2 | $69B |
|
||
Price history
3 events — show timeline
- 2026-05-01 Pending — Global MLS
- 2026-04-30 Contingent — Global MLS
- 2026-04-15 Listed $269,000 Global MLS
Property tax history
-3.3%/yrLatest (2025): $3,530 · -4.4% YoY. Source: county tax records.
Cash-flow waterfall
monthlySold comps — $/sqft
last 12 mo · ≤1 miLoading sold comps…