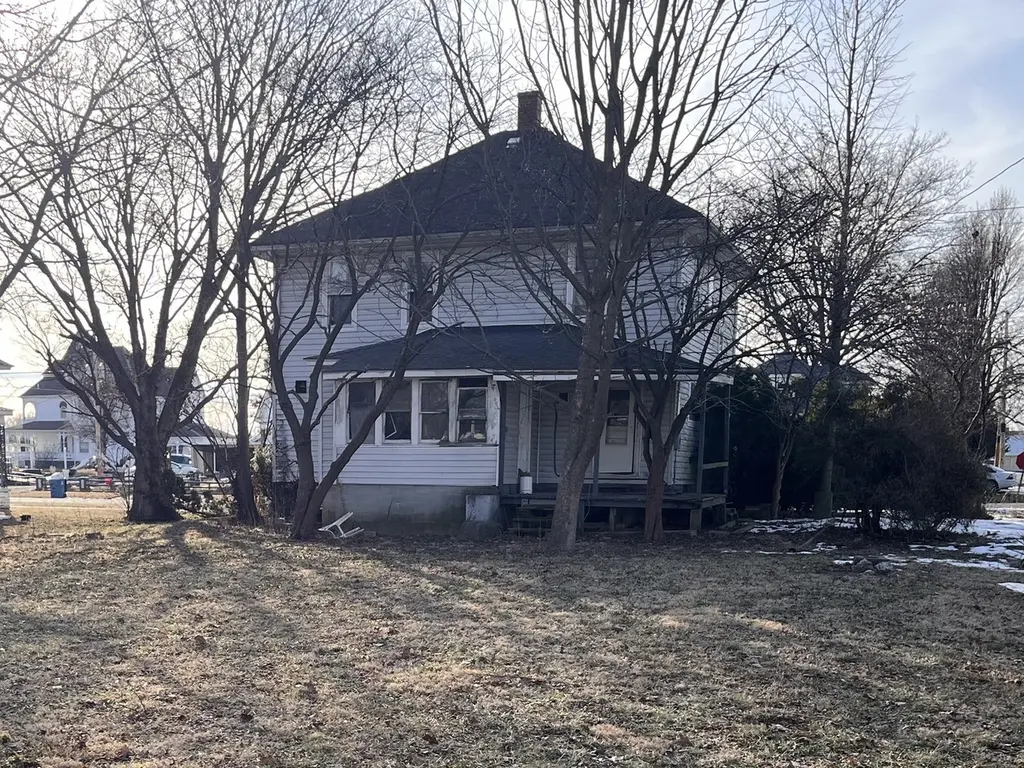
108 NW 2nd St · Fairfield, IL
Flood risk 3/10 · Minor
- FEMA flood zone
- —
- Chance of flooding over 30 yrs
- 0.1%
- Est. flood insurance / yr
- —
Fire risk 1/10 · Minimal
- Est. fire insurance / yr
- $804 – $1,492
Heat risk 5/10 · Moderate
- Hot days now (above 107°F)
- 7 days/yr
- Hot days in 30 yrs
- 21 days/yr
Wind risk 2/10 · Minimal
- Chance of severe wind over 30 yrs
- 2.0%
Air-quality risk 1/10 · Minimal
- Unhealthy air days now
- 0 days/yr
- Unhealthy air days in 30 yrs
- 0 days/yr
Risk factors via First Street. Map © Google.
Why this score? — see what drove the C- grade
The composite is a weighted blend of 9 inputs, each scored 0–100. Each bar is that input's sub-score; the figure is the points it added to the 100-point composite (weight × sub-score).
- Cash flow +15.0/30.0
- ARV discount +7.5/15.0
- Appreciation +7.5/10.0
- 1% rule +5.0/10.0
- DSCR +5.0/10.0
- Livability +3.5/5.0
- Rent growth +2.5/5.0
- Condition / age +2.5/5.0
- Schools +2.0/10.0
$10,000
🖨 Deal sheet (PDF) 📄 Offer letter ✓ Due diligence
Listing remarks
Seller says bring in offers!! Investor Special - Full Rehab Opportunity! This 4-bedroom, 2-bath, two-story home with a basement offers incredible potential for the right investor or visionary buyer. With approximately 1,700 square feet, this property is a true blank canvas ready for a complete renovation. The home is in need of a full gut and rehab, providing the perfect opportunity to design and customize every detail to your liking. With a solid roof and foundation already in place, much of the heavy lifting has been started-making this an ideal project for seasoned investors or those looking to build equity. Unlock the possibilities and bring your vision to life-don't miss this value-ad
Key facts
- 6,400 sq ft lot
- Listed 59 days
Neighborhood map
What this means for you Summary
Snapshot
- This is a 4-bed/2.0-bath other listed at $10k.
Deal economics
- At list price, monthly cash flow is $967 ($12k/yr) — positive.
- The deal already cash-flows at list — no discount required.
- Meets the 1% rule at list price ($1k rent vs $10k).
- Recommended offer: $10k (3.0% below list) — sets the bar for market timing.
Location & tenants
- Location reads 69/100 on livability (#408 in IL) — a middle-class / working-renter tenant base. Strengths: cost of living A+, housing A+, health & safety A+; Watch: employment D+, crime F, amenities F.
- Fairfield Comm H S District 225 (town): math 15% / reading 25% proficiency, ranked #725 of 919 in IL (top 79%) — low school quality limits family demand, transient renter base, plan for 1-2y turnover.
- Zoned schools: North Side Elem School (math 24% / reading 34%, grade F, #658 of 2,056 statewide, top 35%, 321 students, 0% FRL); Center Street Elem School (math 20% / reading 29%, grade F, #332 of 665 statewide, top 55%, 293 students, 0% FRL); Fairfield Comm High School (math 12% / reading 22%, grade F, #430 of 693 statewide, top 66%, 449 students, 0% FRL).
- Market conditions: 7 active listings in the ZIP.
Forward outlook
- In year one you build about $576 of equity ($69 loan paydown + $507 appreciation (5.1% local appreciation)).
- Wayne County population projected at -12% by 2050 — secular population decline; favor cash flow + early exit over multi-decade hold.
- At projected returns (5.1% appreciation + 3.0% rent growth), your $3k cash investment doubles in ~1 year — after that, you're playing with house money.
Negotiation context
- It's been on market 60 days — a 3% lower offer ($10k) is reasonable based on typical stale-listing flexibility.
- 2 sale attempts; this cycle's ask has dropped $10k (50%) from the opening price — seller is motivated, your offer sets the floor, not the list.
Risks & watch-outs
- Climate carrying-cost: extreme-heat days projected 7→21/yr by 2055 (HVAC capex compounding) — expect insurance premiums to compound above CPI over the hold.
Questions for the listing agent
- It's been on market 60 days. Have you received any prior offers? Is the seller open to a 3% concession, seller financing, or rate buy-down credit?
- Is there a deadline driving the sale (1031 exchange, divorce, estate, relocation)? That informs how much negotiation room exists.
- Schools are D-rated, which usually means shorter tenancies and higher turnover. Who's the typical renter profile here, and what's been the actual vacancy rate?
- Crime grade is F in this area — have there been break-ins, vandalism, or insurance claims at this property in the last 3 years? What carrier currently insures it and at what premium?
- What's the average days-on-market for RENTAL listings here right now (not sales)? A rising rental-DOM trend means longer vacancies and softer asking-rent achievability than the comps imply.
- What's the recent tenant-quality profile in this submarket — average credit score on applications, eviction rate, late-payment / NSF rate, and stable-employment percentage? A property-management company in the area should have these aggregated.
- How much new for-sale + rental construction is in the pipeline within 1–3 miles? Heavy new supply typically softens prices + rents 12–24 months out; constrained supply supports both.
Investment metrics
- 1% rule
- 13.12% ✓
- Cap rate
- 122.39%
- Cash-on-cash
- 414.64%
- DSCR
- 19.45
- GRM
- 0.6
CMA / ARV
No comps found within radius.
Projected returns pro-forma
5.07% appreciation · 3.0% rent growth · sell at horizon
- IRR
- —
- Equity multiple
- 23.85×
- Total profit
- $63,985
- Equity at exit
- $5,709
- IRR
- —
- Equity multiple
- 51.06×
- Total profit
- $140,173
- Equity at exit
- $9,888
Cash invested: $2,800 (down + closing). Projections, not guarantees.
Landlord ↔ Tenant lean methodology
- Overall (STATE)
- 43 Moderately Tenant-Leaning
- State Illinois
- 43 Moderately Tenant-Leaning · D+7
- County
- — inherits STATE
- City
- — inherits STATE
ZIP-level market 62837
- Home prices YoY
- 4.4%
- Active inventory
- 7
- Price-to-rent
- 0.6×
Monthly cashflow live
- Estimated rent
- $1,312 medium interval (Pro) →
- Mortgage (P&I)
- −$52
- Tax est. 1.5%
- −$12 /mo · $150/yr
- Insurance
- −$4
- HOA
- −$0
- Lot rent
- −$0
- Vacancy / Maint / Mgmt
- −$276
- Net cashflow
- $967
Break-even live
Sensitivity live
| Price | -10% $974 | -5% $971 | +0% $967 | +5% $964 | +10% $961 |
|---|---|---|---|---|---|
| Rent | -10% $864 | -5% $916 | +0% $967 | +5% $1,019 | +10% $1,071 |
| Rate | -1.0pp $973 | -0.5pp $970 | base $967 | +0.5pp $965 | +1.0pp $962 |
UW: 25.0% down · 7.5% · 30yr · 1.5% tax · 5.0% vac · 8.0% maint · 8.0% mgmt
Financing live
Cash to close
- Down payment
- $2,500
- Closing costs
- $300
- Reserves months
- —
- Total cash needed
- —
Loan-product check · same deal, 3 products live
Conventional
25% down · 7.5% · 30yr
- Down + closing
- —
- Monthly P&I
- —
- Monthly cashflow
- —
- DSCR
- —
- Eligible?
- —
Personal DTI + credit; lowest rate.
DSCR
20% down · 8.5% · 30yr
- Down + closing
- —
- Monthly P&I
- —
- Monthly cashflow
- —
- DSCR
- —
- Eligible?
- —
No personal income docs; deal must DSCR.
Hard money
10% down · 12.0% · 12mo
- Down + closing
- —
- Monthly P&I
- —
- Monthly cashflow
- —
- DSCR
- —
- Eligible?
- —
Short-term bridge; refi at stabilization.
Listing history 29 events
-
2026-06-22days on market $10,000 Active 60 DOM
-
2026-06-21days on market $10,000 Active 59 DOM
-
2026-06-21days on market $10,000 Active 58 DOM
-
2026-06-18days on market $10,000 Active 56 DOM
-
2026-06-17days on market $10,000 Active 55 DOM
-
2026-06-16days on market $10,000 Active 54 DOM
-
2026-06-15days on market $10,000 Active 53 DOM
-
2026-06-13days on market $10,000 Active 51 DOM
-
2026-06-12days on market $10,000 Active 50 DOM
-
2026-06-09days on market $10,000 Active 47 DOM
-
2026-06-08days on market $10,000 Active 46 DOM
-
2026-06-07days on market $10,000 Active 45 DOM
-
2026-06-07days on market $10,000 Active 44 DOM
-
2026-06-04days on market $10,000 Active 41 DOM
-
2026-06-02days on market $10,000 Active 40 DOM
-
2026-06-01days on market $10,000 Active 39 DOM
-
2026-05-31days on market $10,000 Active 38 DOM
-
2026-05-31days on market $10,000 Active 37 DOM
-
2026-05-19price $10,000
-
2026-05-01price $15,000
-
2026-04-23$20,000 Active
-
2026-04-17historical
-
2026-03-16price
-
2026-03-12price
-
2026-03-09price
-
2026-03-05price
-
2026-02-26price
-
2026-02-23price
-
2026-02-16Active
ⓘ Source: listings_history table (triggers on properties + properties_extension) + one-shot
backfill from property_details.listing_events for pre-trigger history.
Climate risk First Street
- Flood 3/10 Moderate 10% chance over 30 yrs
- Wildfire 1/10 Low
- Heat 5/10 Major 7 d/yr ≥107°F today · 21 d/yr by 30 yrs out
- Wind 2/10 Low 2% chance of damaging wind over 30 yrs
- Air quality 1/10 Low 0 unhealthy d/yr today · 0 by 30 yrs out
Nearby sold comps map
Loading sold comps map…
Walkable amenities ~0.75 mi
Loading nearby amenities…
Taxation est. · year 1
- Rental income
- $15,746
- − Mortgage interest
- −$560
- − Property taxes
- −$150
- − Insurance
- −$50
- − Repairs & maintenance
- −$1,260
- − Management
- −$1,260
- − Depreciation
- −$291
- Taxable income
- $12,176
- Est. tax owed @ 24.0%
- −$2,922
- After-tax cash flow
- $8,688/yr
For passive investors: Depreciation is non-cash, so a rental often shows a tax loss while cash-flowing — sheltering income. Rental losses are passive: they offset passive income freely, and up to $25,000/yr can offset ordinary (W-2) income if you actively participate and your MAGI is under $100k (phasing out to $0 by $150k); unused losses carry forward. On sale, claimed depreciation is recaptured at up to 25%, and gains may owe capital-gains tax (a 1031 exchange can defer both). Figures are a year-1 estimate at your 24.0% rate — not tax advice; consult a CPA.
Schools (NCES district)
- District
- Fairfield Comm H S District 225
- NCES district ID
- 1726180
- Math proficiency
- 15% ▬ 0.00%
- Reading proficiency
- 25% ▼ -5.00%
- Median HH income
- $36,920
- Composite
- 19.89/100
- National rank
- #13889
- State rank
- #725 of 919 in IL
Livability — Fairfield
- Score
- 69/100
- State rank
- #408
- US rank
- #8419
Category grades
Schools grade is shown separately in the Schools card above.
Census & demographics
- Census place
- Fairfield, IL
- Population (ZIP)
- 7,924
Population outlook (Wayne County) Hauer SSP2
- Today (2025)
- 15,695 people
- By 2030
- 15,277 · -2.7%
- By 2040
- 14,526 · -7.4%
- By 2050
- 13,826 · -11.9%
- By 2075
- 12,049 · -23.2%
- By 2100
- 9,912 · -36.8%
Race, ethnicity, and origin ACS 2023
- Neighborhood character
- Predominantly White (94%)
- Race & ethnicity
- White 94% Two or more races 2% Hispanic / Latino 2%
- Common ancestry
- Serbian 3% Slovak 2% Lithuanian 1%
- Foreign-born
- 3% · Canada
- Languages at home
- 97% English-only · Spanish 2%
Political lean MEDSL · Wayne
- 2024 margin
- Solid R (+70.9) · D 14.0% · R 84.9% · Other 1.1%
- 2008→2024 swing
- -35.7pp toward R · 2008: -35.2pp · 2024: -70.9pp
- All cycles
- 2024: R+70.9 2020: R+70.5 2016: R+71.7 2012: R+58.2 2008: R+35.2
Not yet ingested
- Civics
- —
Market trends
- HPI YoY
- ▲ 5.07%
- Current HPI
- 120.4194
- Rent YoY
- —
- Metro
- —
- State GDP YoY
- ▲ 1.59%
- F500 in state
- 60
Industry mix (Fortune 500 HQ in IL)
| Industry | F500 HQs | Revenue |
|---|---|---|
| Insurance | 4 | $201B |
|
||
| Consumer Goods | 4 | $87B |
|
||
| Industrial Machinery | 3 | $64B |
|
||
| Healthcare | 2 | $55B |
|
||
| Retail / Pharmacy | 1 | $148B |
|
||
| Agriculture / Food | 1 | $86B |
|
||
Price history
-50.0% since first listed11 events — show timeline
- 2026-05-19 Price Changed $10,000 MRED as Distributed by MLS Grid
- 2026-05-01 Price Changed $15,000 MRED as Distributed by MLS Grid
- 2026-04-23 Listed $20,000 MRED as Distributed by MLS Grid
- 2026-04-17 Listing Removed — MRED as Distributed by MLS Grid
- 2026-03-16 Price Changed — MRED as Distributed by MLS Grid
- 2026-03-12 Price Changed — MRED as Distributed by MLS Grid
- 2026-03-09 Price Changed — MRED as Distributed by MLS Grid
- 2026-03-05 Price Changed — MRED as Distributed by MLS Grid
- 2026-02-26 Price Changed — MRED as Distributed by MLS Grid
- 2026-02-23 Price Changed — MRED as Distributed by MLS Grid
- 2026-02-16 Listed — MRED as Distributed by MLS Grid
Property tax history
+7.4%/yrLatest (2024): $2,434 · +2.6% YoY. Source: county tax records.
Cash-flow waterfall
monthlySold comps — $/sqft
last 12 mo · ≤1 miLoading sold comps…