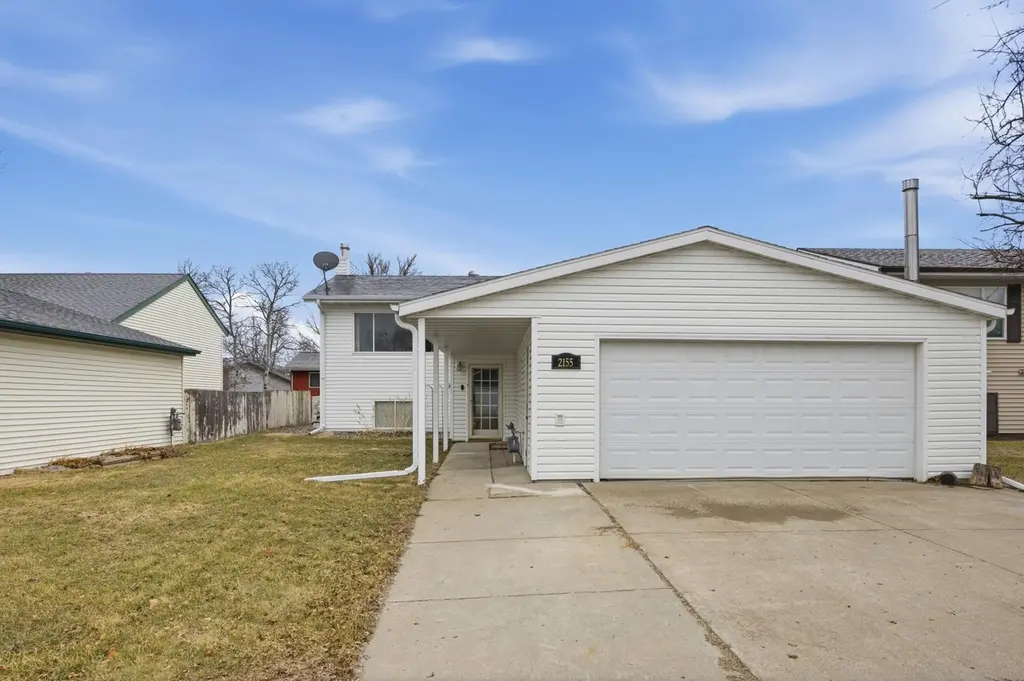
2155 4th Ave E · West Fargo, ND
Flood risk 1/10 · Minimal
- FEMA flood zone
- X
- Chance of flooding over 30 yrs
- 0.0%
- Est. flood insurance / yr
- $473 – $860
Fire risk 1/10 · Minimal
- Est. fire insurance / yr
- $1,289 – $2,393
Heat risk 2/10 · Minimal
- Hot days now (above 98°F)
- 7 days/yr
- Hot days in 30 yrs
- 12 days/yr
Wind risk 2/10 · Minimal
- Chance of severe wind over 30 yrs
- —
Air-quality risk 3/10 · Minor
- Unhealthy air days now
- 3 days/yr
- Unhealthy air days in 30 yrs
- 3 days/yr
Risk factors via First Street. Map © Google.
Why this score? — see what drove the F grade
The composite is a weighted blend of 9 inputs, each scored 0–100. Each bar is that input's sub-score; the figure is the points it added to the 100-point composite (weight × sub-score).
- ARV discount +7.5/15.0
- Cash flow +5.8/30.0
- Livability +3.9/5.0
- Rent growth +3.8/5.0
- Schools +3.7/10.0
- Condition / age +2.5/5.0
- 1% rule +0.4/10.0
- DSCR +0.2/10.0
- Appreciation +0.0/10.0
$282,500
🖨 Deal sheet (PDF) 📄 Offer letter ✓ Due diligence
Key facts
- Large deck
- Backyard
- Built-in workbench
Tags
Property features AI
Exterior
- Parking: Attached garage with 3-car capacity (garage dimensions approx. 24 x 35 x 24 x 36)
- Utilities: City water connected; City sewer connected; 150 amp electric service; Fuel: Electric and Natural Gas
- Home design: Residential split entry (bi-level) home; Main and lower living levels
- Construction: Frame construction; Asphalt roof; Foundation area approximately 1,032 (other foundation type noted)
- Exterior features: Vinyl exterior; Partial wood and chain-link fencing
Interior
- Kitchen: Range; Microwave; Dishwasher; Disposal; Refrigerator; Water filtration system
- Bedrooms: 4 bedrooms (locations: upper and lower levels; multiple bedrooms on both levels)
- Bathrooms: Main floor full bathroom; Basement 3/4 bathroom
- Heating & cooling: Baseboard heating; Ductless mini-split cooling
- Interior features: Wood-burning fireplace (1); Informal dining area; Drain-tiled basement with sump pump
- Laundry & utility: Washer hookup; Electric dryer hookup; Lower-level laundry; Utility room on lower level; Water softener (owned)
Neighborhood map
What this means for you Summary
Snapshot
- This is a 4-bed/2.0-bath single-family listed at $282k.
Deal economics
- At list price, monthly cash flow is $-570 ($-7k/yr) — negative.
- To cash-flow at today's rent, offer at most $182k (35.6% below list).
- To meet the 1% rule (rent ≥ 1% of price), the offer needs to be $152k (46.1% below list).
- Recommended offer: $152k (46.1% below list) — sets the bar for 1% rule.
- Cap rate 3.9% vs local median 3.1% in West Fargo — meaningfully above typical; check what's discounted (condition, days-on-market, listing class) to confirm the premium yield is real.
Location & tenants
- Location reads 77/100 on livability (#10 in ND, #2,868 nationally) — a middle-class / working-renter tenant base. Strengths: employment A+, housing A+, crime A; Watch: health & safety D+, amenities F, commute F.
- West Fargo 6 (suburban): math 41% / reading 42% proficiency, ranked #26 of 53 in ND (top 49%) — families likely to look elsewhere, expect single-tenant / working-renter base with shorter leases.
- Zoned schools: L E Berger Elementary School (math 37% / reading 27%, grade F, #173 of 236 statewide, top 76%, 370 students, 72% FRL); Cheney Middle School (math 40% / reading 45%, grade D-, #18 of 35 statewide, top 50%, 1,012 students, 43% FRL); West Fargo High School (math 32% / reading 42%, grade F, #71 of 144 statewide, top 52%, 1,423 students, 32% FRL) — zoned schools average 49% FRL vs 24% district-wide (24 pts higher); higher-poverty schools than district average — tighter screening recommended.
- Market conditions: Rents rising fast (+5.1%/yr); 262 active listings in the ZIP; 14 comparable units currently listed for rent nearby; rentals at typical pace (median 16d on market — plan ~3-4 weeks tenant-placement turnaround); solid renter incomes; 1,218 units permitted in Cass County in 2024 (410 in 5+ unit buildings).
Forward outlook
- Local home prices are declining (-3.0%/yr); year-one equity from $2k of loan paydown is wiped out by about $8k of value loss. Plan a longer hold.
- Cass County population projected at +69% by 2050 — long-run rental-demand tailwind backs the buy-and-hold thesis.
Negotiation context
- It's been on market 86 days — a 6% lower offer ($266k) is reasonable based on typical stale-listing flexibility.
- Current owner paid $132k; list at $282k implies a 113% gain — meaningful room to come down on a strong offer.
Questions for the listing agent
- What do current leases actually rent for vs. the listed asking? Can we see a recent rent roll and the last 12 months of T-12 income?
- It's been on market 86 days. Have you received any prior offers? Is the seller open to a 46% concession, seller financing, or rate buy-down credit?
- Built in 1979 — when were the roof, HVAC, electrical panel, plumbing, and water heater last replaced?
- Why hasn't it sold? Are there any deal-killer items the seller is aware of (foundation, flood, title, zoning, code violations)?
- Is there a deadline driving the sale (1031 exchange, divorce, estate, relocation)? That informs how much negotiation room exists.
- Schools are B-rated — typically a magnet for longer-tenancy family renters. What's the average tenant stay here, and is there a school-zone premium baked into asking?
- The area grade is low — what's the realistic commute time and amenity access for the typical tenant pool here? Any planned neighborhood developments (good or bad) we should know about?
- What's the average days-on-market for RENTAL listings here right now (not sales)? A rising rental-DOM trend means longer vacancies and softer asking-rent achievability than the comps imply.
- What's the recent tenant-quality profile in this submarket — average credit score on applications, eviction rate, late-payment / NSF rate, and stable-employment percentage? A property-management company in the area should have these aggregated.
- How much new for-sale + rental construction is in the pipeline within 1–3 miles? Heavy new supply typically softens prices + rents 12–24 months out; constrained supply supports both.
Investment metrics
- 1% rule
- 0.54% ✗
- Cap rate
- 3.87%
- Cash-on-cash
- -8.65%
- DSCR
- 0.62
- GRM
- 15.5
CMA / ARV
No comps found within radius.
Projected returns pro-forma
-3.0% appreciation · 5.13% rent growth · sell at horizon
- IRR
- -29.6%
- Equity multiple
- 0.00×
- Total profit
- $-78,826
- Equity at exit
- $42,122
- IRR
- -24.0%
- Equity multiple
- -0.28×
- Total profit
- $-101,441
- Equity at exit
- $24,425
Cash invested: $79,100 (down + closing). Projections, not guarantees.
Landlord ↔ Tenant lean methodology
- Overall (STATE)
- 82 Strongly Landlord-Friendly
- State North Dakota
- 82 Strongly Landlord-Friendly · R+20
- County
- — inherits STATE
- City
- — inherits STATE
ZIP-level market 58078
- Rents YoY
- 5.1%
- Active inventory
- 262
- Price-to-rent
- 15.5×
Monthly cashflow live
- Estimated rent
- $1,523 high interval (Pro) →
- Mortgage (P&I)
- −$1,481
- Tax from tax record
- −$174 /mo · $2,090/yr
- Insurance
- −$118
- HOA
- −$0
- Vacancy / Maint / Mgmt
- −$320
- Net cashflow
- $-570
Break-even live
Sensitivity live
| Price | -10% $-410 | -5% $-490 | +0% $-570 | +5% $-650 | +10% $-730 |
|---|---|---|---|---|---|
| Rent | -10% $-690 | -5% $-630 | +0% $-570 | +5% $-510 | +10% $-450 |
| Rate | -1.0pp $-428 | -0.5pp $-498 | base $-570 | +0.5pp $-643 | +1.0pp $-718 |
UW: 25.0% down · 7.5% · 30yr · 1.5% tax · 5.0% vac · 8.0% maint · 8.0% mgmt
Financing live
Cash to close
- Down payment
- $70,625
- Closing costs
- $8,475
- Reserves months
- —
- Total cash needed
- —
Loan-product check · same deal, 3 products live
Conventional
25% down · 7.5% · 30yr
- Down + closing
- —
- Monthly P&I
- —
- Monthly cashflow
- —
- DSCR
- —
- Eligible?
- —
Personal DTI + credit; lowest rate.
DSCR
20% down · 8.5% · 30yr
- Down + closing
- —
- Monthly P&I
- —
- Monthly cashflow
- —
- DSCR
- —
- Eligible?
- —
No personal income docs; deal must DSCR.
Hard money
10% down · 12.0% · 12mo
- Down + closing
- —
- Monthly P&I
- —
- Monthly cashflow
- —
- DSCR
- —
- Eligible?
- —
Short-term bridge; refi at stabilization.
Rent comps 14 comps
| Address | Beds | Baths | Sqft | Rent | $/sqft | DOM | Units | Dist |
|---|---|---|---|---|---|---|---|---|
| 2131 2nd Ave E West Fargo, ND | 3.0 | 1.0 | 1224 | $1,500 | $1.23 | 23d | 1 | 0.06mi |
| 4452 La Casa Way Fargo, ND | 3.0 | 2.0 | 1185 | $1,450 | $1.22 | 23d | 1 | 0.58mi |
| 4235 9th Avenue Cir S Unit 102 Fargo, ND | 3.0 | 1.0 | 1000 | $1,030 | $1.03 | 15d | 1 | 0.63mi |
| 4214 9th Ave S Fargo, ND | 1.0–3.0 | 1.0 | 854 | $985 | $1.15 | 15d | 8 | 0.74mi |
| 901 42nd St S Fargo, ND | 1.0–3.0 | 1.0 | 900 | $930 | $1.03 | 15d | 9 | 0.80mi |
| 1501 48th St S Fargo, ND | 3.0 | 1.0–2.0 | 800 | $1,320 | $1.65 | 15d | 19 | 0.98mi |
| 1409 14th Ave E West Fargo, ND | 2.0–3.0 | 1.0 | 900 | $1,050 | $1.17 | 23d | 1 | 1.03mi |
| 4949 16th Ave S Fargo, ND | 3.0 | 1.0–2.0 | 938 | $1,585 | $1.69 | 15d | 7 | 1.07mi |
| 4311 15th Ave S Fargo, ND | 3.0 | 1.0–2.0 | 855 | $1,145 | $1.34 | 23d | 4 | 1.09mi |
| 4720 16th Ave S Fargo, ND | 1.0–3.0 | 1.0 | 855 | $1,145 | $1.34 | 15d | 11 | 1.11mi |
| 424 6th St E West Fargo, ND | 2.0–3.0 | 1.0–2.0 | 980 | $880 | $0.90 | 23d | 7 | 1.21mi |
| 1632 51st St S Fargo, ND | 3.0 | 1.0–2.5 | 1352 | $2,295 | $1.70 | 23d | 22 | 1.24mi |
| 4220 17th Ave SW Fargo, ND | 1.0–3.0 | 1.0 | 1150 | $1,295 | $1.13 | 15d | 3 | 1.40mi |
| 1727 42nd St S Fargo, ND | 1.0–3.0 | 1.0 | 1015 | $970 | $0.96 | 15d | 3 | 1.43mi |
Listing history 21 events
-
2026-06-21days on market $282,500 Active 86 DOM
-
2026-06-18days on market $282,500 Active 83 DOM
-
2026-06-17days on market $282,500 Active 82 DOM
-
2026-06-16days on market $282,500 Active 81 DOM
-
2026-06-15days on market $282,500 Active 80 DOM
-
2026-06-14days on market $282,500 Active 78 DOM
-
2026-06-13days on market $282,500 Active 77 DOM
-
2026-06-10days on market $282,500 Active 75 DOM
-
2026-06-09days on market $282,500 Active 74 DOM
-
2026-06-08days on market $282,500 Active 73 DOM
-
2026-06-07days on market $282,500 Active 72 DOM
-
2026-06-05days on market $282,500 Active 69 DOM
-
2026-06-03days on market $282,500 Active 68 DOM
-
2026-06-02days on market $282,500 Active 67 DOM
-
2026-06-01days on market $282,500 Active 66 DOM
-
2026-05-31days on market $282,500 Active 65 DOM
-
2026-05-30days on market $282,500 Active 64 DOM
-
2026-04-27price $282,500
-
2026-03-27$285,000 Active
-
2007-02-12soldstatus $132,500
-
2006-09-26soldstatus $126,100
ⓘ Source: listings_history table (triggers on properties + properties_extension) + one-shot
backfill from property_details.listing_events for pre-trigger history.
Tax reassessment forecast ND · Resets to sale price
- Current annual tax
- $2,090 · $174/mo
- Projected year-2 tax
- $2,768 · $231/mo
- Expected delta
- +$679/yr (+$57/mo · 32.5%)
ⓘ Screening estimate from a state-policy table — verify with the county assessor before closing.
Climate risk First Street
- Flood 1/10 Low FEMA zone X · 0% chance over 30 yrs
- Wildfire 1/10 Low
- Heat 2/10 Low 7 d/yr ≥98°F today · 12 d/yr by 30 yrs out
- Wind 2/10 Low
- Air quality 3/10 Moderate 3 unhealthy d/yr today · 3 by 30 yrs out
Nearby sold comps map
Loading sold comps map…
Walkable amenities ~0.75 mi
Loading nearby amenities…
Taxation est. · year 1
- Rental income
- $18,280
- − Mortgage interest
- −$15,824
- − Property taxes
- −$2,090
- − Insurance
- −$1,412
- − Repairs & maintenance
- −$1,462
- − Management
- −$1,462
- − Depreciation
- −$8,218
- Taxable loss
- −$12,190
- Est. tax savings @ 24.0%
- +$2,926
- After-tax cash flow
- $-3,913/yr
For passive investors: Depreciation is non-cash, so a rental often shows a tax loss while cash-flowing — sheltering income. Rental losses are passive: they offset passive income freely, and up to $25,000/yr can offset ordinary (W-2) income if you actively participate and your MAGI is under $100k (phasing out to $0 by $150k); unused losses carry forward. On sale, claimed depreciation is recaptured at up to 25%, and gains may owe capital-gains tax (a 1031 exchange can defer both). Figures are a year-1 estimate at your 24.0% rate — not tax advice; consult a CPA.
Schools (NCES district)
- District
- West Fargo 6
- NCES district ID
- 3819410
- Math proficiency
- 41% ▼ -10.00%
- Reading proficiency
- 42% ▼ -10.00%
- Median HH income
- $58,914
- Composite
- 36.6/100
- National rank
- #4628
- State rank
- #26 of 53 in ND
Livability — West Fargo
- Score
- 77/100
- State rank
- #10
- US rank
- #2868
Category grades
Schools grade is shown separately in the Schools card above.
Census & demographics
- Census place
- West Fargo, ND
- County
- Cass County · 177,143 people
- City population
- 40,631
- Metro
- Fargo, ND-MN
- Population (ZIP)
- 40,631
- Household income
- $91,040
- Rent vs Own
- Severe rent burden
- 1154.0
Population outlook (Cass County) Hauer SSP2
- Today (2025)
- 223,771 people
- By 2030
- 251,835 · +12.5%
- By 2040
- 311,816 · +39.3%
- By 2050
- 378,694 · +69.2%
- By 2075
- 571,386 · +155.3%
- By 2100
- 769,727 · +244.0%
Race, ethnicity, and origin ACS 2023
- Neighborhood character
- Predominantly White (86%)
- Race & ethnicity
- White 86% Two or more races 6% Black 4% Hispanic / Latino 3% Asian 2%
- Common ancestry
- Portuguese 28% Lithuanian 3% Scottish 3%
- Foreign-born
- 5% · Canada, Vietnam
- Languages at home
- 96% English-only · Other Indo-European 1% French/Haitian/Cajun 1% Other Asian/Pacific 1%
Political lean MEDSL · Cass
- 2024 margin
- Lean R (+8.4) · D 44.9% · R 53.3% · Other 1.9%
- 2008→2024 swing
- -15.5pp toward R · 2008: 7.1pp · 2024: -8.4pp
- All cycles
- 2024: R+8.4 2020: R+2.7 2016: R+10.7 2012: R+3.0 2008: D+7.1
Not yet ingested
- Civics
- —
Market trends
- HPI YoY
- ▼ -99.47%
- Current HPI
- 181.6497
- Rent YoY
- ▲ 5.13%
- Metro
- Fargo, ND-MN
- State GDP YoY
- ▲ 2.09%
- F500 in state
- 2
Industry mix (Fortune 500 HQ in ND)
| Industry | F500 HQs | Revenue |
|---|---|---|
| Utilities / Construction | 1 | $6B |
|
||
Price history
+124.0% since first listed4 events — show timeline
- 2026-04-27 Price Changed $282,500 NORTHSTARMLS as Distributed by MLS Grid
- 2026-03-27 Listed $285,000 NORTHSTARMLS as Distributed by MLS Grid
- 2007-02-12 Sold (Public Records) $132,500 Public Records
- 2006-09-26 Sold (Public Records) $126,100 Public Records
Property tax history
+0.1%/yrLatest (2025): $2,090 · -28.0% YoY. Source: county tax records.
Cash-flow waterfall
monthlySold comps — $/sqft
last 12 mo · ≤1 miLoading sold comps…