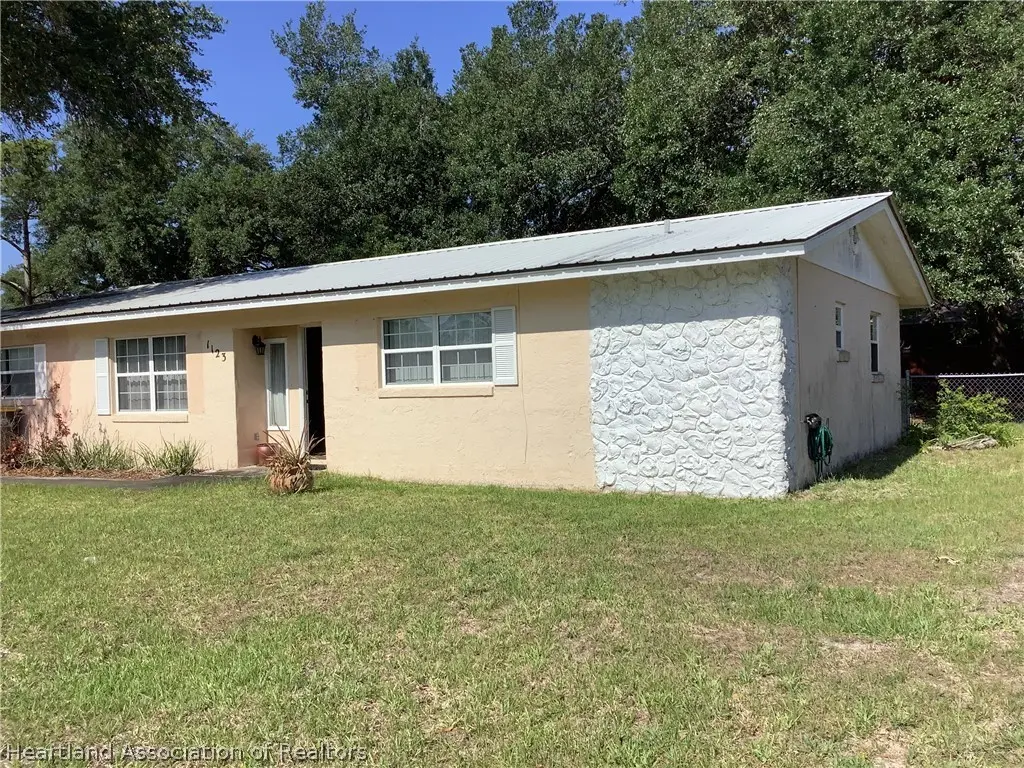
1123 Forest Rd · Sebring, FL
Flood risk 1/10 · Minimal
- FEMA flood zone
- X (unshaded)
- Chance of flooding over 30 yrs
- 0.0%
- Est. flood insurance / yr
- $507 – $1,088
Fire risk 2/10 · Minimal
- Est. fire insurance / yr
- $947 – $1,759
Heat risk 8/10 · Major
- Hot days now (above 108°F)
- 4 days/yr
- Hot days in 30 yrs
- 13 days/yr
Wind risk 9/10 · Severe
- Chance of severe wind over 30 yrs
- 99.0%
Air-quality risk 2/10 · Minimal
- Unhealthy air days now
- 2 days/yr
- Unhealthy air days in 30 yrs
- 2 days/yr
Risk factors via First Street. Map © Google.
Why this score? — see what drove the C+ grade
The composite is a weighted blend of 9 inputs, each scored 0–100. Each bar is that input's sub-score; the figure is the points it added to the 100-point composite (weight × sub-score).
- Cash flow +21.7/30.0
- ARV discount +15.0/15.0
- DSCR +6.9/10.0
- 1% rule +5.2/10.0
- Schools +3.6/10.0
- Livability +3.3/5.0
- Rent growth +2.9/5.0
- Condition / age +2.5/5.0
- Appreciation +0.0/10.0
$175,000
🖨 Deal sheet (PDF) 📄 Offer letter ✓ Due diligence
Listing remarks
Good location home with 2 bedrooms, 2 baths, plus a studio accessory dwelling unit (ADU). Good floorplan with double screened porches in rear and fenced yard with beautiful mature trees. Low traffic street. Tile floors, metal roof. Convenient location. This will need a lot of cleaning and cosmetic updates and will make a good family home. As Is sale. Seller requests that home be active on the market through Friday, May 18, 2026. All offers submitted will be reviewed on Saturday, May 19, 2026.
Key facts
- 9,583 sq ft lot
- Built 1973
- Listed 9 days
Property features AI
Exterior
- Parking: Driveway; On-street parking
- Utilities: Public water; Septic tank sewer
- Home design: Single-family residence; One level
- Construction: Block and concrete construction
- Exterior features: Rear screened porch; Shingle roof; Paved road access; Frontage approximately 80 feet; Lot approximately 0.22 acres; Zoned R1A
Interior
- Kitchen: Dishwasher, Microwave, Oven, Range, Refrigerator
- Flooring: Tile
- Bathrooms: 3 full bathrooms
- Heating & cooling: Central heating (electric); Central air conditioning (electric)
- Interior features: Dryer, Dishwasher, Electric Water Heater, Microwave, Oven, Range, Refrigerator, Washer; Tile flooring
- Laundry & utility: Washer and Dryer; Electric water heater
Neighborhood map
What this means for you Summary
Snapshot
- This is a 3-bed/2.0-bath single-family listed at $175k.
Deal economics
- At list price, monthly cash flow is $269 ($3k/yr) — positive.
- The deal already cash-flows at list — no discount required.
- Meets the 1% rule at list price ($2k rent vs $175k).
- Cap rate 8.1% vs local median 4.3% in Sebring — top-decile yield for the area; either an underpriced asset or a hidden risk that comps aren't pricing in. Stress-test before assuming the spread holds.
Location & tenants
- Location reads 66/100 on livability (#618 in FL) — a middle-class / working-renter tenant base. Strengths: cost of living A+, housing A+, health & safety A; Watch: amenities F, commute F, employment F.
- Highlands (other): math 45% / reading 43% proficiency, ranked #54 of 73 in FL (top 74%) — families likely to look elsewhere, expect single-tenant / working-renter base with shorter leases; 68% free/reduced lunch — lower-income household profile, screen leases tightly.
- Zoned schools: Memorial Elementary School (math 43% / reading 40%, grade F, #1,437 of 2,144 statewide, top 68%, 532 students, 78% FRL); Hill-Gustat Middle School (math 53% / reading 50%, grade C, #232 of 571 statewide, top 41%, 705 students, 63% FRL); Sebring High School (math 32% / reading 48%, grade F, #296 of 667 statewide, top 45%, 1,809 students, 56% FRL) — zoned schools at 66% FRL track the district average.
- Market conditions: Rents rising (+1.6%/yr); 705 active listings in the ZIP; 980 units permitted in Highlands County in 2024 (80 in 5+ unit buildings).
- This rent runs 31% of the median local income ($70k/yr) — at the standard rent-burdened threshold; future hikes will face affordability resistance.
Forward outlook
- Local home prices are declining (-3.0%/yr); year-one equity from $1k of loan paydown is wiped out by about $5k of value loss. Plan a longer hold.
Negotiation context
- Only 9 days on market — expect competitive offers; lowballing is unlikely to land.
- Current owner paid $47k; list at $175k implies a 272% gain — meaningful room to come down on a strong offer.
Risks & watch-outs
- Climate carrying-cost: severe wind risk, 99% chance of damaging wind over 30y; extreme-heat days projected 4→13/yr by 2055 (HVAC capex compounding) — expect insurance premiums to compound above CPI over the hold.
Questions for the listing agent
- Built in 1973 — when were the roof, HVAC, electrical panel, plumbing, and water heater last replaced?
- Is there a deadline driving the sale (1031 exchange, divorce, estate, relocation)? That informs how much negotiation room exists.
- Schools are D-rated, which usually means shorter tenancies and higher turnover. Who's the typical renter profile here, and what's been the actual vacancy rate?
- What's the average days-on-market for RENTAL listings here right now (not sales)? A rising rental-DOM trend means longer vacancies and softer asking-rent achievability than the comps imply.
- What's the recent tenant-quality profile in this submarket — average credit score on applications, eviction rate, late-payment / NSF rate, and stable-employment percentage? A property-management company in the area should have these aggregated.
- How much new for-sale + rental construction is in the pipeline within 1–3 miles? Heavy new supply typically softens prices + rents 12–24 months out; constrained supply supports both.
Investment metrics
- 1% rule
- 1.02% ✓
- Cap rate
- 8.13%
- Cash-on-cash
- 6.58%
- DSCR
- 1.29
- GRM
- 8.2
CMA / ARV
- ARV (on-the-fly)
- $320,656
- Comps found
- 12
Show comp detail 12 sales within ~0.75 mi
| Address | Dist | Beds/Ba | Sqft | Sold | Price | $/sf | Match |
|---|---|---|---|---|---|---|---|
| 1123 Forest Rd | 0.00mi | 3/2.5 | 1,636 (0%) | 1mo | $280,000 | $171 | 97 |
| 1123 Forest Rd | 0.00mi | 3/3.0 | 1,636 (0%) | 1mo | $180,000 | $110 | 95 |
| 1961 Pine Key Blvd | 0.43mi | 3/2.0 | 1,634 (-0%) | 2mo | $215,000 | $132 | 78 |
| 3323 Romeo St | 0.18mi | 2/2.0 (-1) | 1,422 (-13%) | 1mo | $245,000 | $172 | 64 |
| 3849 Citroen Dr | 0.41mi | 3/2.0 | 1,488 (-9%) | 3mo | $310,000 | $208 | 63 |
| 421 Fiat | 0.49mi | 2/2.0 (-1) | 1,526 (-7%) | 2mo | $300,000 | $197 | 60 |
| 509 Lemans Dr | 0.70mi | 3/2.0 | 1,529 (-6%) | 0mo | $295,000 | $193 | 56 |
| 419 Volvo Ave | 0.50mi | 4/3.0 (+1) | 1,735 (+6%) | 2mo | $365,000 | $210 | 56 |
| 505 Lemans Dr | 0.71mi | 3/2.0 | 1,529 (-6%) | 0mo | $299,900 | $196 | 55 |
| 406 Aston Martin Dr | 0.68mi | 3/2.0 | 1,468 (-10%) | 0mo | $297,000 | $202 | 51 |
| 619 Aston-martin Dr | 0.53mi | 3/2.0 | 1,420 (-13%) | 3mo | $299,500 | $211 | 51 |
| 217 Eagle Ave | 0.73mi | 2/2.0 (-1) | 1,480 (-10%) | 2mo | $175,000 | $118 | 44 |
Match score weights: distance 35% · size 25% · config 20% · recency 20%. Top-matched comps best support the ARV.
Projected returns pro-forma
-3.0% appreciation · 1.65% rent growth · sell at horizon
- IRR
- -7.7%
- Equity multiple
- 0.72×
- Total profit
- $-13,657
- Equity at exit
- $26,093
- IRR
- 0.2%
- Equity multiple
- 1.01×
- Total profit
- $529
- Equity at exit
- $15,131
Cash invested: $49,000 (down + closing). Projections, not guarantees.
Landlord ↔ Tenant lean methodology
- Overall (STATE)
- 87 Strongly Landlord-Friendly
- State Florida
- 87 Strongly Landlord-Friendly · R+3
- County
- — inherits STATE
- City
- — inherits STATE
ZIP-level market 33872
- Home prices YoY
- -25.8%
- Rents YoY
- 1.6%
- Active inventory
- 705
- Price-to-rent
- 8.2×
Monthly cashflow live
- Estimated rent
- $1,782 medium interval (Pro) →
- Mortgage (P&I)
- −$918
- Tax from tax record
- −$149 /mo · $1,787/yr
- Insurance
- −$73
- HOA
- −$0
- Lot rent
- −$0
- Vacancy / Maint / Mgmt
- −$374
- Net cashflow
- $269
Break-even live
Sensitivity live
| Price | -10% $368 | -5% $318 | +0% $269 | +5% $219 | +10% $170 |
|---|---|---|---|---|---|
| Rent | -10% $128 | -5% $198 | +0% $269 | +5% $339 | +10% $409 |
| Rate | -1.0pp $357 | -0.5pp $313 | base $269 | +0.5pp $223 | +1.0pp $177 |
UW: 25.0% down · 7.5% · 30yr · 1.5% tax · 5.0% vac · 8.0% maint · 8.0% mgmt
Financing live
Cash to close
- Down payment
- $43,750
- Closing costs
- $5,250
- Reserves months
- —
- Total cash needed
- —
Loan-product check · same deal, 3 products live
Conventional
25% down · 7.5% · 30yr
- Down + closing
- —
- Monthly P&I
- —
- Monthly cashflow
- —
- DSCR
- —
- Eligible?
- —
Personal DTI + credit; lowest rate.
DSCR
20% down · 8.5% · 30yr
- Down + closing
- —
- Monthly P&I
- —
- Monthly cashflow
- —
- DSCR
- —
- Eligible?
- —
No personal income docs; deal must DSCR.
Hard money
10% down · 12.0% · 12mo
- Down + closing
- —
- Monthly P&I
- —
- Monthly cashflow
- —
- DSCR
- —
- Eligible?
- —
Short-term bridge; refi at stabilization.
Listing history 3 events
-
2026-05-17status Pending
-
2026-05-07$175,000 Active
-
1994-12-01soldstatus $47,000
ⓘ Source: listings_history table (triggers on properties + properties_extension) + one-shot
backfill from property_details.listing_events for pre-trigger history.
Tax reassessment forecast FL · Resets to sale price
- Current annual tax
- $1,787 · $149/mo
- Projected year-2 tax
- $1,787 · $149/mo
- Expected delta
- $0/yr ($0/mo · 0.0%)
ⓘ Screening estimate from a state-policy table — verify with the county assessor before closing.
Climate risk First Street
- Flood 1/10 Low FEMA zone X (unshaded) · 0% chance over 30 yrs
- Wildfire 2/10 Low
- Heat 8/10 Severe 4 d/yr ≥108°F today · 13 d/yr by 30 yrs out
- Wind 9/10 Extreme 99% chance of damaging wind over 30 yrs
- Air quality 2/10 Low 2 unhealthy d/yr today · 2 by 30 yrs out
Nearby sold comps map
Loading sold comps map…
Walkable amenities ~0.75 mi
Loading nearby amenities…
Taxation est. · year 1
- Rental income
- $21,390
- − Mortgage interest
- −$9,803
- − Property taxes
- −$1,787
- − Insurance
- −$875
- − Repairs & maintenance
- −$1,711
- − Management
- −$1,711
- − Depreciation
- −$5,091
- Taxable income
- $411
- Est. tax owed @ 24.0%
- −$99
- After-tax cash flow
- $3,124/yr
For passive investors: Depreciation is non-cash, so a rental often shows a tax loss while cash-flowing — sheltering income. Rental losses are passive: they offset passive income freely, and up to $25,000/yr can offset ordinary (W-2) income if you actively participate and your MAGI is under $100k (phasing out to $0 by $150k); unused losses carry forward. On sale, claimed depreciation is recaptured at up to 25%, and gains may owe capital-gains tax (a 1031 exchange can defer both). Figures are a year-1 estimate at your 24.0% rate — not tax advice; consult a CPA.
Schools (NCES district)
- District
- Highlands
- NCES district ID
- 1200840
- Math proficiency
- 45% ▼ -7.00%
- Reading proficiency
- 43% ▼ -3.00%
- Median HH income
- $35,276
- Composite
- 36.42/100
- National rank
- #4672
- State rank
- #54 of 73 in FL
Livability — Sebring
- Score
- 66/100
- State rank
- #618
- US rank
- #11992
Category grades
Schools grade is shown separately in the Schools card above.
Census & demographics
- County
- Highlands County · 98,898 people
- City population
- 50,797
- Metro
- Sebring-Avon Park, FL
- Population (ZIP)
- 13,746
- Household income
- $69,578
- Rent vs Own
- Severe rent burden
- 222.0
Population outlook (Highlands County) Hauer SSP2
- Today (2025)
- 99,674 people
- By 2030
- 99,615 · -0.1%
- By 2040
- 99,342 · -0.3%
- By 2050
- 98,242 · -1.4%
- By 2075
- 93,291 · -6.4%
- By 2100
- 79,894 · -19.8%
Race, ethnicity, and origin ACS 2023
- Neighborhood character
- Majority White (65%)
- Race & ethnicity
- White 65% Hispanic / Latino 22% Two or more races 11% Black 5% Asian 4% Native American 1%
- Hispanic origin (detail)
- Mexican 5% Puerto Rican 9% Cuban 3%
- Common ancestry
- Romanian 2% Russian 2% Slovak 2%
- Foreign-born
- 12% · Canada, Jamaica
- Languages at home
- 79% English-only · Spanish 16% Other Asian/Pacific 2% Other Indo-European 1%
Political lean MEDSL · Highlands
- 2024 margin
- Solid R (+40.8) · D 29.3% · R 70.1%
- 2008→2024 swing
- -22.7pp toward R · 2008: -18.1pp · 2024: -40.8pp
- All cycles
- 2024: R+40.8 2020: R+34.4 2016: R+32.0 2012: R+23.0 2008: R+18.1
Not yet ingested
- Civics
- —
Market trends
- HPI YoY
- ▼ -78.20%
- Current HPI
- 225.3761
- Rent YoY
- ▲ 1.65%
- Metro
- Sebring-Avon Park, FL
- State GDP YoY
- ▲ 3.28%
- F500 in state
- 36
Industry mix (Fortune 500 HQ in FL)
| Industry | F500 HQs | Revenue |
|---|---|---|
| Industrial Technology | 2 | $29B |
|
||
| Insurance | 2 | $17B |
|
||
| Retail | 1 | $60B |
|
||
| Technology Distribution | 1 | $58B |
|
||
| Homebuilding | 1 | $35B |
|
||
| Technology Manufacturing | 1 | $35B |
|
||
Price history
+272.3% since first listed3 events — show timeline
- 2026-05-17 Pending — HAOR as distributed by MLS GRID
- 2026-05-07 Listed $175,000 HAOR as distributed by MLS GRID
- 1994-12-01 Sold (Public Records) $47,000 Public Records
Property tax history
+12.6%/yrLatest (2025): $1,787 · +3.2% YoY. Source: county tax records.
Cash-flow waterfall
monthlySold comps — $/sqft
last 12 mo · ≤1 miLoading sold comps…