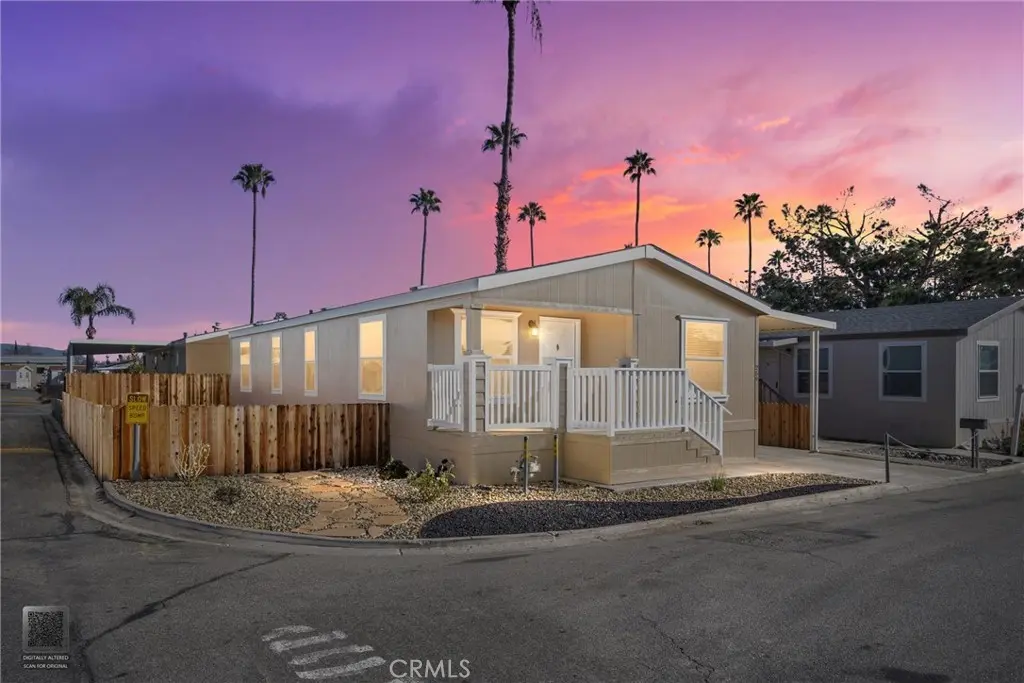
259 Mary Kay Ln · Oildale, CA
Flood risk 1/10 · Minimal
- FEMA flood zone
- X (unshaded)
- Chance of flooding over 30 yrs
- 0.0%
- Est. flood insurance / yr
- $507 – $1,088
Fire risk 2/10 · Minimal
- Est. fire insurance / yr
- $659 – $1,223
Heat risk 8/10 · Major
- Hot days now (above 105°F)
- 6 days/yr
- Hot days in 30 yrs
- 16 days/yr
Wind risk 1/10 · Minimal
- Chance of severe wind over 30 yrs
- —
Air-quality risk 10/10 · Severe
- Unhealthy air days now
- 39 days/yr
- Unhealthy air days in 30 yrs
- 45 days/yr
Risk factors via First Street. Map © Google.
Why this score? — see what drove the D- grade
The composite is a weighted blend of 9 inputs, each scored 0–100. Each bar is that input's sub-score; the figure is the points it added to the 100-point composite (weight × sub-score).
- Cash flow +15.1/30.0
- DSCR +4.6/10.0
- 1% rule +4.2/10.0
- Condition / age +4.0/5.0
- Rent growth +3.1/5.0
- Livability +2.9/5.0
- Appreciation +2.7/10.0
- Schools +1.0/10.0
- ARV discount +0.0/15.0
$129,900
🖨 Deal sheet (PDF) 📄 Offer letter ✓ Due diligence
Listing remarks MLS
Welcome to this beautifully renovated 2017-built home offering 3 bedrooms, 2 bathrooms, and 1,248 square feet of thoughtfully updated living space in the peaceful Riverdale Village community. A charming front patio deck welcomes you inside, where natural light and fresh interior and exterior paint create a warm, inviting atmosphere. The home features stylish wood-like flooring paired with newer carpet, stainless steel appliances, granite countertops throughout, and updated kitchen cabinetry with a convenient kitchen island, ideal for entertaining. Enjoy the comfort of a newer HVAC system and roof, along with the ease of a dedicated indoor laundry room. The bathrooms are shining with updates and elegance as well. Residents enjoy access to resort-style community amenities including a sparkling pool, fitness center, beautifully maintained parks, dog stations, and a recreation room perfect for gatherings. This move-in-ready home truly checks all of the boxes!
Key facts
- Front patio deck
- Renovated home
- Kitchen island
Tags
Neighborhood map
What this means for you Summary
Snapshot
- This is a 3-bed/2.0-bath manufactured listed at $130k. Condition is rated good.
Deal economics
- At list price, monthly cash flow is $43 ($511/yr) — positive.
- The deal already cash-flows at list — no discount required.
- To meet the 1% rule (rent ≥ 1% of price), the offer needs to be $119k (8.4% below list).
- Recommended offer: $114k (12.0% below list) — sets the bar for market timing.
- Cap rate 6.7% vs local median 3.9% in Oildale — top-decile yield for the area; either an underpriced asset or a hidden risk that comps aren't pricing in. Stress-test before assuming the spread holds.
Location & tenants
- Location reads 58/100 on livability (#680 in CA) — a working-class tenant base; expect higher turnover. Strengths: housing A+; Watch: crime F, amenities F, commute F.
- Beardsley Elementary (suburban): math 7% / reading 18% proficiency, ranked #501 of 517 in CA (top 97%) — low school quality limits family demand, transient renter base, plan for 1-2y turnover; 76% free/reduced lunch — lower-income household profile, screen leases tightly.
- Zoned schools: Beardsley Elementary (math 2% / reading 8%, grade F, #1,564 of 1,571 statewide, top 100%, 421 students, 98% FRL); Beardsley Junior High (math 8% / reading 22%, grade F, #461 of 498 statewide, top 93%, 400 students, 94% FRL); North High (reading 75%, 2,214 students, 87% FRL) — zoned schools average 93% FRL vs 76% district-wide (17 pts higher); higher-poverty schools than district average — tighter screening recommended.
- Market conditions: Rents rising (+2.2%/yr); 314 active listings in the ZIP; 27 comparable units currently listed for rent nearby; rentals leasing fast (median 5d on market — plan ~1-2 weeks tenant-placement turnaround); 3,244 units permitted in Kern County in 2024 (73 in 5+ unit buildings).
Forward outlook
- Local home prices are declining (-3.0%/yr); year-one equity from $898 of loan paydown is wiped out by about $4k of value loss. Plan a longer hold.
- Kern County population projected at +17% by 2050 — long-run rental-demand tailwind backs the buy-and-hold thesis.
Negotiation context
- It's been on market 140 days — a 12% lower offer ($114k) is reasonable based on typical stale-listing flexibility.
- 2 sale attempts with the ask held roughly flat each time — persistent listings suggest the price (not the market) is what's stuck; bring a comps-based counter.
Risks & watch-outs
- Climate carrying-cost: extreme-heat days projected 6→16/yr by 2055 (HVAC capex compounding) — expect insurance premiums to compound above CPI over the hold.
Questions for the listing agent
- It's been on market 140 days. Have you received any prior offers? Is the seller open to a 12% concession, seller financing, or rate buy-down credit?
- Why hasn't it sold? Are there any deal-killer items the seller is aware of (foundation, flood, title, zoning, code violations)?
- Is there a deadline driving the sale (1031 exchange, divorce, estate, relocation)? That informs how much negotiation room exists.
- Schools are B-rated — typically a magnet for longer-tenancy family renters. What's the average tenant stay here, and is there a school-zone premium baked into asking?
- Crime grade is F in this area — have there been break-ins, vandalism, or insurance claims at this property in the last 3 years? What carrier currently insures it and at what premium?
- The area grade is low — what's the realistic commute time and amenity access for the typical tenant pool here? Any planned neighborhood developments (good or bad) we should know about?
- What's the average days-on-market for RENTAL listings here right now (not sales)? A rising rental-DOM trend means longer vacancies and softer asking-rent achievability than the comps imply.
- What's the recent tenant-quality profile in this submarket — average credit score on applications, eviction rate, late-payment / NSF rate, and stable-employment percentage? A property-management company in the area should have these aggregated.
- How much new for-sale + rental construction is in the pipeline within 1–3 miles? Heavy new supply typically softens prices + rents 12–24 months out; constrained supply supports both.
Investment metrics
- 1% rule
- 0.92% ✗
- Cap rate
- 6.69%
- Cash-on-cash
- 1.40%
- DSCR
- 1.06
- GRM
- 9.1
CMA / ARV
- ARV (median comp)
- $99,000
- List price
- $129,900
- Delta
- 31.21%
- Verdict
- OVERPRICED
- Comps
- 11 within 1.0 mi
Show comp detail 12 sales within ~0.75 mi
| Address | Dist | Beds/Ba | Sqft | Sold | Price | $/sf | Match |
|---|---|---|---|---|---|---|---|
| 256 Mary Kay Ln | 0.04mi | 3/2.0 | 1,248 (0%) | 3mo | $130,000 | $104 | 96 |
| 48 Cedarwood Ln | 0.18mi | 3/2.0 | 1,248 (0%) | 1mo | $70,000 | $56 | 91 |
| 131 Fernwood Ln | 0.17mi | 3/2.0 | 1,248 (0%) | 15mo | $120,000 | $96 | 79 |
| 300 Florence Ln | 0.08mi | 3/2.0 | 1,296 (+4%) | 20mo | $99,500 | $77 | 73 |
| 4 Dogwood Ln | 0.18mi | 3/2.0 | 1,152 (-8%) | 8mo | $65,000 | $56 | 72 |
| 282 Florence Ln | 0.05mi | 3/2.0 | 1,152 (-8%) | 16mo | $111,000 | $96 | 72 |
| 305 Kings Ln | 0.07mi | 3/2.0 | 1,140 (-9%) | 13mo | $99,900 | $88 | 71 |
| 316 Nita | 0.12mi | 4/2.0 (+1) | 1,344 (+8%) | 7mo | $82,500 | $61 | 70 |
| 159 Hickorywood Ln | 0.22mi | 4/2.0 (+1) | 1,344 (+8%) | 3mo | $99,000 | $74 | 70 |
| 278 Teakwood Ln | 0.04mi | 3/2.0 | 1,344 (+8%) | 21mo | $104,900 | $78 | 68 |
| 170 Hickorywood Ln | 0.14mi | 2/2.0 (-1) | 1,320 (+6%) | 19mo | $95,000 | $72 | 63 |
| 153 Hickorywood Ln | 0.17mi | 2/2.0 (-1) | 1,375 (+10%) | 15mo | $38,000 | $28 | 57 |
Match score weights: distance 35% · size 25% · config 20% · recency 20%. Top-matched comps best support the ARV.
Projected returns pro-forma
-3.0% appreciation · 2.22% rent growth · sell at horizon
- IRR
- -14.9%
- Equity multiple
- 0.47×
- Total profit
- $-19,248
- Equity at exit
- $19,369
- IRR
- -7.6%
- Equity multiple
- 0.53×
- Total profit
- $-16,942
- Equity at exit
- $11,231
Cash invested: $36,372 (down + closing). Projections, not guarantees.
Landlord ↔ Tenant lean methodology
- Overall (STATE)
- 18 Strongly Tenant-Friendly
- State California
- 18 Strongly Tenant-Friendly · D+13
- County
- — inherits STATE
- City
- — inherits STATE
ZIP-level market 93308
- Home prices YoY
- -0.5%
- Rents YoY
- 2.2%
- Active inventory
- 314
- Price-to-rent
- 9.1×
Monthly cashflow live
- Estimated rent
- $1,190 high interval (Pro) →
- Mortgage (P&I)
- −$681
- Tax est. 1.5%
- −$162 /mo · $1,948/yr
- Insurance
- −$54
- HOA
- −$0
- Lot rent leased land?
- −$0
- Vacancy / Maint / Mgmt
- −$250
- Net cashflow
- $43
Break-even live
Sensitivity live
| Price | -10% $132 | -5% $87 | +0% $43 | +5% $-2 | +10% $-47 |
|---|---|---|---|---|---|
| Rent | -10% $-51 | -5% $-4 | +0% $43 | +5% $90 | +10% $137 |
| Rate | -1.0pp $108 | -0.5pp $76 | base $43 | +0.5pp $9 | +1.0pp $-25 |
UW: 25.0% down · 7.5% · 30yr · 1.5% tax · 5.0% vac · 8.0% maint · 8.0% mgmt
Financing live
Cash to close
- Down payment
- $32,475
- Closing costs
- $3,897
- Reserves months
- —
- Total cash needed
- —
Loan-product check · same deal, 3 products live
Conventional
25% down · 7.5% · 30yr
- Down + closing
- —
- Monthly P&I
- —
- Monthly cashflow
- —
- DSCR
- —
- Eligible?
- —
Personal DTI + credit; lowest rate.
DSCR
20% down · 8.5% · 30yr
- Down + closing
- —
- Monthly P&I
- —
- Monthly cashflow
- —
- DSCR
- —
- Eligible?
- —
No personal income docs; deal must DSCR.
Hard money
10% down · 12.0% · 12mo
- Down + closing
- —
- Monthly P&I
- —
- Monthly cashflow
- —
- DSCR
- —
- Eligible?
- —
Short-term bridge; refi at stabilization.
Rent comps 27 comps
| Address | Beds | Baths | Sqft | Rent | $/sqft | DOM | Units | Dist |
|---|---|---|---|---|---|---|---|---|
| 811 Beardsley Ave Bakersfield, CA | 2.0 | 1.0 | 800 | $1,295 | $1.62 | 5d | 1 | 0.26mi |
| 627 Beardsley Ave Bakersfield, CA | 3.0 | 1.0 | 967 | $1,575 | $1.63 | 46d | 1 | 0.29mi |
| 706 Huskey Dr Bakersfield, CA | 2.0 | 1.0 | 832 | $1,450 | $1.74 | 46d | 1 | 0.32mi |
| 213 Oildale Dr Unit A Bakersfield, CA | 2.0 | 2.0 | 928 | $1,195 | $1.29 | 5d | 1 | 0.37mi |
| 627 Hood Dr Bakersfield, CA | 3.0 | 1.0 | 1140 | $1,795 | $1.57 | 5d | 1 | 0.41mi |
| 819 Washington Ave Bakersfield, CA | 2.0 | 1.0 | 767 | $1,295 | $1.69 | 5d | 1 | 0.50mi |
| 327 McCord Ave Unit 6 Bakersfield, CA | 3.0 | 1.0 | 1000 | $1,500 | $1.50 | 5d | 1 | 0.53mi |
| 448 S Oildale Dr Bakersfield, CA | 3.0 | 2.0 | 1080 | $1,500 | $1.39 | 5d | 1 | 0.57mi |
| 611 Wilson Ave Unit B Bakersfield, CA | 2.0 | 1.0 | 750 | $1,195 | $1.59 | 46d | 1 | 0.66mi |
| 222 Moneta Ave Unit 222 Bakersfield, CA | 3.0 | 2.0 | 1040 | $1,700 | $1.63 | 5d | 1 | 0.67mi |
| 419 Washington Ave Unit 417 Bakersfield, CA | 3.0 | 2.0 | 975 | $1,500 | $1.54 | 5d | 1 | 0.67mi |
| 222 Harding Ave Unit B Bakersfield, CA | 3.0 | 2.0 | 1100 | $1,750 | $1.59 | 5d | 1 | 0.70mi |
| 901 Castaic Ave Bakersfield, CA | 2.0 | 1.0 | 1076 | $1,700 | $1.58 | 5d | 1 | 0.75mi |
| 1405 Yosemite Dr Unit 1405 Bakersfield, CA | 2.0 | 1.0 | 712 | $1,100 | $1.54 | 46d | 1 | 0.82mi |
| 1207 El Tejon Ave Unit 1 Bakersfield, CA | 3.0 | 1.0 | 1212 | $1,950 | $1.61 | 5d | 1 | 0.86mi |
| 709 Francis St Bakersfield, CA | 3.0 | 1.0 | 1300 | $1,400 | $1.08 | 46d | 1 | 0.93mi |
| 106 E Warren Ave Bakersfield, CA | 3.0 | 2.0 | 1169 | $1,400 | $1.20 | 13d | 1 | 0.99mi |
| 3333 El Encanto Ct Bakersfield, CA | 2.0 | 1.5 | 990 | $1,495 | $1.51 | 5d | 1 | 1.11mi |
| 3333 El Encanto Ct Bakersfield, CA | 2.0 | 2.0 | 990 | $1,595 | $1.61 | 17d | 1 | 1.11mi |
| 1905 McCray St Bakersfield, CA | 2.0 | 1.0 | 736 | $1,450 | $1.97 | 5d | 1 | 1.14mi |
| 1951 Golden State Ave Bakersfield, CA | 1.0–3.0 | 1.0–2.5 | 1017 | $1,695 | $1.67 | 5d | 2 | 1.23mi |
| 411 Highland Dr Bakersfield, CA | 2.0 | 1.0 | 1051 | $1,650 | $1.57 | 5d | 1 | 1.27mi |
| 615 W China Grade Loop Bakersfield, CA | 1.0–2.0 | 1.0–2.0 | 875 | $1,850 | $2.11 | 5d | 6 | 1.30mi |
| 3817 K St Unit A Bakersfield, CA | 2.0 | 1.0 | 763 | $1,285 | $1.68 | 5d | 1 | 1.40mi |
| 1201 40th St Bakersfield, CA | 2.0–3.0 | 1.0–2.0 | 870 | $1,219 | $1.40 | 5d | 1 | 1.46mi |
| 210 Douglas St Unit B Bakersfield, CA | 2.0 | 1.5 | 1274 | $1,400 | $1.10 | 5d | 1 | 1.46mi |
| 2600 Park Meadows Dr Bakersfield, CA | 1.0–2.0 | 1.0–2.0 | 864 | $1,495 | $1.73 | 5d | 2 | 1.48mi |
Listing history 18 events
-
2026-06-23days on market $129,900 Active 140 DOM
-
2026-06-22days on market $129,900 Active 139 DOM
-
2026-06-18days on market $129,900 Active 136 DOM
-
2026-06-17days on market $129,900 Active 135 DOM
-
2026-06-16days on market $129,900 Active 134 DOM
-
2026-06-15days on market $129,900 Active 133 DOM
-
2026-06-14days on market $129,900 Active 131 DOM
-
2026-06-10days on market $129,900 Active 128 DOM
-
2026-06-09days on market $129,900 Active 127 DOM
-
2026-06-08days on market $129,900 Active 126 DOM
-
2026-06-07days on market $129,900 Active 125 DOM
-
2026-06-05days on market $129,900 Active 122 DOM
-
2026-06-03days on market $129,900 Active 121 DOM
-
2026-06-03days on market $129,900 Active 120 DOM
-
2026-06-01days on market $129,900 Active 119 DOM
-
2026-05-31days on market $129,900 Active 118 DOM
-
2026-02-02$129,900 Active 969-char remark
Show marketing remark (969 chars)
Welcome to this beautifully renovated 2017-built home offering 3 bedrooms, 2 bathrooms, and 1,248 square feet of thoughtfully updated living space in the peaceful Riverdale Village community. A charming front patio deck welcomes you inside, where natural light and fresh interior and exterior paint create a warm, inviting atmosphere. The home features stylish wood-like flooring paired with newer carpet, stainless steel appliances, granite countertops throughout, and updated kitchen cabinetry with a convenient kitchen island, ideal for entertaining. Enjoy the comfort of a newer HVAC system and roof, along with the ease of a dedicated indoor laundry room. The bathrooms are shining with updates and elegance as well. Residents enjoy access to resort-style community amenities including a sparkling pool, fitness center, beautifully maintained parks, dog stations, and a recreation room perfect for gatherings. This move-in-ready home truly checks all of the boxes!
ⓘ Source: listings_history table (triggers on properties + properties_extension) + one-shot
backfill from property_details.listing_events for pre-trigger history.
Climate risk First Street
- Flood 1/10 Low FEMA zone X (unshaded) · 0% chance over 30 yrs
- Wildfire 2/10 Low
- Heat 8/10 Severe 6 d/yr ≥105°F today · 16 d/yr by 30 yrs out
- Wind 1/10 Low
- Air quality 10/10 Extreme 39 unhealthy d/yr today · 45 by 30 yrs out
Nearby sold comps map
Loading sold comps map…
Walkable amenities ~0.75 mi
Loading nearby amenities…
Taxation est. · year 1
- Rental income
- $14,283
- − Mortgage interest
- −$7,276
- − Property taxes
- −$1,948
- − Insurance
- −$650
- − Repairs & maintenance
- −$1,143
- − Management
- −$1,143
- − Depreciation
- −$3,779
- Taxable loss
- −$1,656
- Est. tax savings @ 24.0%
- +$397
- After-tax cash flow
- $908/yr
For passive investors: Depreciation is non-cash, so a rental often shows a tax loss while cash-flowing — sheltering income. Rental losses are passive: they offset passive income freely, and up to $25,000/yr can offset ordinary (W-2) income if you actively participate and your MAGI is under $100k (phasing out to $0 by $150k); unused losses carry forward. On sale, claimed depreciation is recaptured at up to 25%, and gains may owe capital-gains tax (a 1031 exchange can defer both). Figures are a year-1 estimate at your 24.0% rate — not tax advice; consult a CPA.
Condition & rehab AI · 12 photos
This 2017-built home in Riverdale Village is beautifully renovated with updated kitchen, bathrooms, and HVAC system. It offers a good condition with fresh paint and landscaping, making it move-in ready.
Value-add opportunities
- Both Painting exterior and interior walls — Fresh paint enhances curb appeal and interior aesthetics
- Both Landscaping improvements — Enhances curb appeal and adds value
- Both New flooring in bathrooms — Freshens up the bathrooms and adds value
Renovation cost estimate screening
Value-add ROI direction
- Both Painting exterior and interior walls — Fresh paint enhances curb appeal and interior aesthetics ↑
- Both Landscaping improvements — Enhances curb appeal and adds value ↑
- Both New flooring in bathrooms — Freshens up the bathrooms and adds value ↑
ⓘ Cost ranges are severity-bucket heuristics (US national rule-of-thumb). Get contractor quotes + a written scope before underwriting a rehab budget.
Schools (NCES district)
- District
- Beardsley Elementary
- NCES district ID
- 0604260
- Math proficiency
- 7% ▼ -12.00%
- Reading proficiency
- 18% ▼ -16.00%
- Median HH income
- $28,808
- Composite
- 9.63/100
- National rank
- #9841
- State rank
- #501 of 517 in CA
Livability — Oildale
- Score
- 58/100
- State rank
- #680
- US rank
- #20848
Category grades
Schools grade is shown separately in the Schools card above.
Census & demographics
- Census place
- Oildale, CA
- County
- Kern County · 710,371 people
- Metro
- Bakersfield, CA
- Population (ZIP)
- 55,078
- Household income
- $62,445
- Rent vs Own
- Severe rent burden
- 2931.0
Population outlook (Kern County) Hauer SSP2
- Today (2025)
- 947,286 people
- By 2030
- 978,984 · +3.3%
- By 2040
- 1,045,018 · +10.3%
- By 2050
- 1,105,232 · +16.7%
- By 2075
- 1,229,538 · +29.8%
- By 2100
- 1,238,059 · +30.7%
Race, ethnicity, and origin ACS 2023
- Neighborhood character
- Diverse neighborhood (Simpson 0.57)
- Race & ethnicity
- White 57% Hispanic / Latino 32% Two or more races 15% Black 3% Asian 3% Native American 1%
- Hispanic origin (detail)
- Mexican 26%
- Common ancestry
- Slovak 3% Italian 1% Romanian 1%
- Foreign-born
- 8% · Canada, Vietnam
- Languages at home
- 80% English-only · Spanish 17%
Political lean MEDSL · Kern
- 2024 margin
- Strong R (+21.1) · D 38.2% · R 59.3% · Other 2.5%
- 2008→2024 swing
- -3.3pp toward R · 2008: -17.8pp · 2024: -21.1pp
- All cycles
- 2024: R+21.1 2020: R+10.2 2016: R+15.0 2012: R+20.9 2008: R+17.8
Not yet ingested
- Civics
- —
Market trends
- HPI YoY
- ▼ -4.52%
- Current HPI
- 825.65
- Rent YoY
- ▲ 2.22%
- Metro
- Bakersfield, CA
- State GDP YoY
- ▲ 3.21%
- F500 in state
- 116
Industry mix (Fortune 500 HQ in CA)
| Industry | F500 HQs | Revenue |
|---|---|---|
| Technology | 27 | $1,492B |
|
||
| Financial Services | 3 | $174B |
|
||
| Retail | 3 | $44B |
|
||
| Insurance | 3 | $26B |
|
||
| Media / Entertainment | 2 | $115B |
|
||
| Pharmaceuticals / Biotech | 2 | $62B |
|
||
Price history
+0.0% since first listed2 events — show timeline
- 2026-02-02 Listed $129,900 CRMLS
- 2026-02-02 Listed $129,900 GEMLS
Cash-flow waterfall
monthlySold comps — $/sqft
last 12 mo · ≤1 miLoading sold comps…