 🔨 Auction
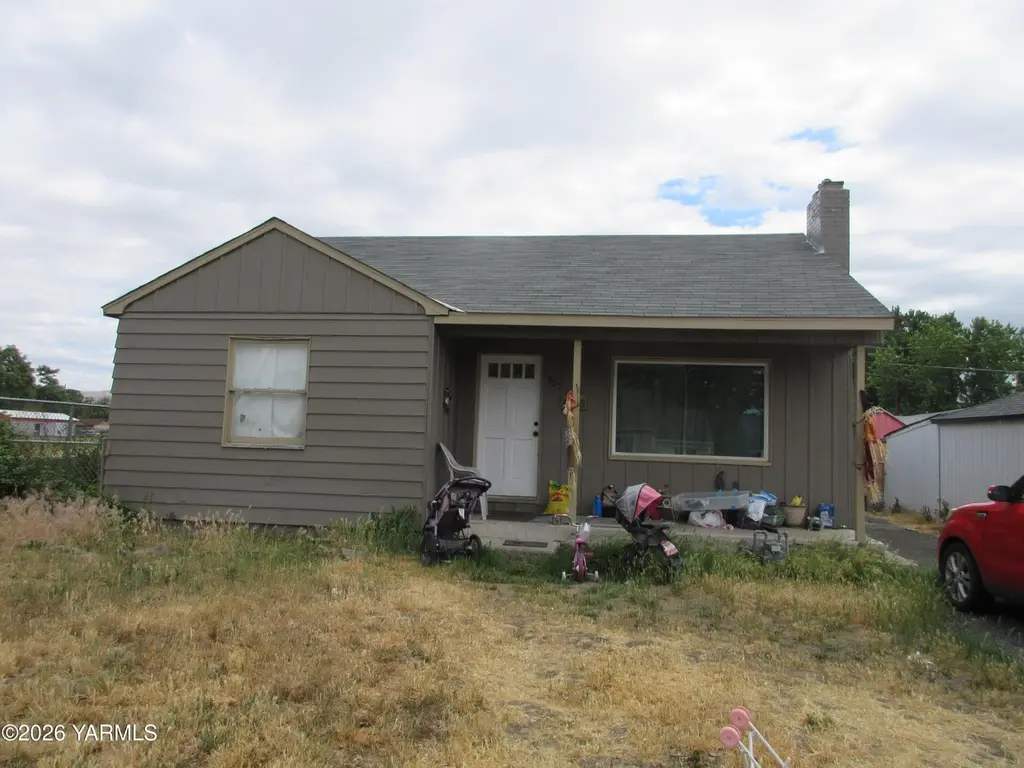
907 S 8th Ave · Yakima, WA
Flood risk 1/10 · Minimal
- FEMA flood zone
- X (unshaded)
- Chance of flooding over 30 yrs
- 0.0%
- Est. flood insurance / yr
- $473 – $860
Fire risk 1/10 · Minimal
- Est. fire insurance / yr
- $604 – $1,122
Heat risk 4/10 · Minor
- Hot days now (above 98°F)
- 7 days/yr
- Hot days in 30 yrs
- 14 days/yr
Wind risk 1/10 · Minimal
- Chance of severe wind over 30 yrs
- —
Air-quality risk 9/10 · Severe
- Unhealthy air days now
- 16 days/yr
- Unhealthy air days in 30 yrs
- 19 days/yr
Risk factors via First Street. Map © Google.
Why this score? — see what drove the F grade
The composite is a weighted blend of 9 inputs, each scored 0–100. Each bar is that input's sub-score; the figure is the points it added to the 100-point composite (weight × sub-score).
- ARV discount +7.5/15.0
- Cash flow +5.9/30.0
- Livability +4.0/5.0
- Schools +3.4/10.0
- Rent growth +2.5/5.0
- Condition / age +2.5/5.0
- 1% rule +0.6/10.0
- DSCR +0.3/10.0
- Appreciation +0.0/10.0
$75,000
🖨 Deal sheet (PDF) 📄 Offer letter ✓ Due diligence
Listing remarks
Information provided in the listing is from county records. Listing agent has not had any access to the property . ''The list price is not indicative of seller's final reserve amount. This property is part of an online bidding event; please visit AUCTION COM LLC to place bids. Inspections of this property and contact with occupants are strictly prohibited. Property is sold ''as is'' and no for sale sign allowed. This asset is being marketed online now at www. auction.com. All offers from interested buyers must be entered online at www. auction.com for the duration of the time that this property is in auction. Registration to bid is now available on the property's listing page on www. auctio
Key facts
- 5,227 sq ft lot
- Garage
- Built 1972
Property features AI
Exterior
- Parking: Detached 1-car garage
- Utilities: Public water; Sewer connected
- Home design: Single-story single family residence; Site-built construction; R1 (single family residential) zoning
- Construction: Frame construction with metal siding; 1 total story
- Exterior features: Composition roof
Interior
- Bathrooms: 1 full bathroom
- Heating & cooling: Central air conditioning; Natural gas heating
- Interior features: Finished basement
Neighborhood map
What this means for you Summary
Snapshot
- This is a 3-bed/1.0-bath single-family listed at $75k.
Deal economics
- At list price, monthly cash flow is $-578 ($-7k/yr) — negative.
- The deal already cash-flows at list — no discount required.
- Meets the 1% rule at list price ($2k rent vs $75k).
- Recommended offer: $74k (1.5% below list) — sets the bar for market timing.
Location & tenants
- Location reads 80/100 on livability (#98 in WA, #1,912 nationally) — a professional / high-income tenant draw. Strengths: amenities A+, commute A+, housing A+; Watch: employment D, crime F.
- Yakima School District (urban): math 34% / reading 42% proficiency, ranked #238 of 291 in WA (top 82%) — families likely to look elsewhere, expect single-tenant / working-renter base with shorter leases; 76% free/reduced lunch — lower-income household profile, screen leases tightly.
- Market conditions: 172 active listings in the ZIP; 12 comparable units currently listed for rent nearby; rentals at typical pace (median 22d on market — plan ~3-4 weeks tenant-placement turnaround); 468 units permitted in Yakima County in 2024 (23 in 5+ unit buildings).
Forward outlook
- Local home prices are declining (-3.0%/yr); year-one equity from $2k of loan paydown is wiped out by about $9k of value loss. Plan a longer hold.
- Yakima County population projected at +6% by 2050 — modest demand growth; plan on rents tracking national, not racing it.
Negotiation context
- It's been on market 22 days — a 2% lower offer ($74k) is reasonable based on typical stale-listing flexibility.
Risks & watch-outs
- Watch-outs: property tax is 3.3% of price.
Questions for the listing agent
- What do current leases actually rent for vs. the listed asking? Can we see a recent rent roll and the last 12 months of T-12 income?
- Built in 1972 — when were the roof, HVAC, electrical panel, plumbing, and water heater last replaced?
- Property tax is high relative to price — has the assessment been appealed recently, and will the sale trigger a re-assessment?
- Is there a deadline driving the sale (1031 exchange, divorce, estate, relocation)? That informs how much negotiation room exists.
- Crime grade is F in this area — have there been break-ins, vandalism, or insurance claims at this property in the last 3 years? What carrier currently insures it and at what premium?
- The area grade is low — what's the realistic commute time and amenity access for the typical tenant pool here? Any planned neighborhood developments (good or bad) we should know about?
- What's the average days-on-market for RENTAL listings here right now (not sales)? A rising rental-DOM trend means longer vacancies and softer asking-rent achievability than the comps imply.
- What's the recent tenant-quality profile in this submarket — average credit score on applications, eviction rate, late-payment / NSF rate, and stable-employment percentage? A property-management company in the area should have these aggregated.
- How much new for-sale + rental construction is in the pipeline within 1–3 miles? Heavy new supply typically softens prices + rents 12–24 months out; constrained supply supports both.
Investment metrics
- 1% rule
- 0.56% ✗
- Cap rate
- 3.94%
- Cash-on-cash
- -8.39%
- DSCR
- 0.63
- GRM
- 14.9
CMA / ARV
- ARV (on-the-fly)
- $295,176
- Comps found
- 12
Show comp detail 12 sales within ~0.75 mi
| Address | Dist | Beds/Ba | Sqft | Sold | Price | $/sf | Match |
|---|---|---|---|---|---|---|---|
| 720 S 8th Ave | 0.15mi | 3/2.0 | 1,558 (+4%) | 7mo | $305,000 | $196 | 77 |
| 607 W Viola Ave | 0.43mi | 3/1.0 | 1,464 (-3%) | 2mo | $311,000 | $212 | 74 |
| 612 Pleasant Ave | 0.40mi | 2/1.0 (-1) | 1,512 (+0%) | 4mo | $190,000 | $126 | 72 |
| 1218 S 8th Ave Ave | 0.40mi | 3/1.5 | 1,584 (+5%) | 2mo | $320,000 | $202 | 70 |
| 1017 W Viola Ave | 0.49mi | 3/1.0 | 1,528 (+2%) | 8mo | $299,000 | $196 | 68 |
| 922 S 9th Ave | 0.12mi | 2/1.0 (-1) | 1,283 (-15%) | 0mo | $272,000 | $212 | 64 |
| 1309 W Spruce St | 0.67mi | 3/1.0 | 1,528 (+2%) | 3mo | $262,000 | $171 | 64 |
| 1406 S 3rd Ave | 0.66mi | 2/1.5 (-1) | 1,435 (-5%) | 7mo | $303,000 | $211 | 49 |
| 1302 S 3rd Ave | 0.55mi | 4/2.0 (+1) | 1,620 (+8%) | 7mo | $360,000 | $222 | 47 |
| 310 S 13th Ave | 0.68mi | 2/1.0 (-1) | 1,313 (-13%) | 0mo | $195,000 | $149 | 42 |
| 619 S 15th Ave | 0.64mi | 4/2.0 (+1) | 1,656 (+10%) | 6mo | $293,335 | $177 | 40 |
| 605 S 16th Ave | 0.72mi | 2/1.0 (-1) | 1,292 (-14%) | 2mo | $235,000 | $182 | 36 |
Match score weights: distance 35% · size 25% · config 20% · recency 20%. Top-matched comps best support the ARV.
Projected returns pro-forma
-3.0% appreciation · 3.0% rent growth · sell at horizon
- IRR
- -31.1%
- Equity multiple
- -0.02×
- Total profit
- $-84,692
- Equity at exit
- $44,012
- IRR
- -34.5%
- Equity multiple
- -0.47×
- Total profit
- $-121,420
- Equity at exit
- $25,521
Cash invested: $82,649 (down + closing). Projections, not guarantees.
Landlord ↔ Tenant lean methodology
- Overall (STATE)
- 28 Tenant-Leaning
- State Washington
- 28 Tenant-Leaning · D+8
- County
- — inherits STATE
- City
- — inherits STATE
ZIP-level market 98903
- Home prices YoY
- -21.8%
- Active inventory
- 172
- Price-to-rent
- 3.8×
Monthly cashflow live
- Estimated rent
- $1,646 high interval (Pro) →
- Mortgage (P&I)
- −$1,548
- Tax from tax record
- −$207 /mo · $2,483/yr
- Insurance
- −$123
- HOA
- −$0
- Vacancy / Maint / Mgmt
- −$346
- Net cashflow
- $-578
Break-even live
Sensitivity live
| Price | -10% $-410 | -5% $-494 | +0% $-578 | +5% $-661 | +10% $-745 |
|---|---|---|---|---|---|
| Rent | -10% $-708 | -5% $-643 | +0% $-578 | +5% $-513 | +10% $-448 |
| Rate | -1.0pp $-429 | -0.5pp $-502 | base $-578 | +0.5pp $-654 | +1.0pp $-732 |
UW: 25.0% down · 7.5% · 30yr · 1.5% tax · 5.0% vac · 8.0% maint · 8.0% mgmt
Financing live
Cash to close
- Down payment
- $73,794
- Closing costs
- $8,855
- Reserves months
- —
- Total cash needed
- —
Loan-product check · same deal, 3 products live
Conventional
25% down · 7.5% · 30yr
- Down + closing
- —
- Monthly P&I
- —
- Monthly cashflow
- —
- DSCR
- —
- Eligible?
- —
Personal DTI + credit; lowest rate.
DSCR
20% down · 8.5% · 30yr
- Down + closing
- —
- Monthly P&I
- —
- Monthly cashflow
- —
- DSCR
- —
- Eligible?
- —
No personal income docs; deal must DSCR.
Hard money
10% down · 12.0% · 12mo
- Down + closing
- —
- Monthly P&I
- —
- Monthly cashflow
- —
- DSCR
- —
- Eligible?
- —
Short-term bridge; refi at stabilization.
Rent comps 12 comps
| Address | Beds | Baths | Sqft | Rent | $/sqft | DOM | Units | Dist |
|---|---|---|---|---|---|---|---|---|
| 808 S 2nd Ave Unit A Yakima, WA | 3.0 | 2.0 | 1133 | $1,495 | $1.32 | 44d | 1 | 0.37mi |
| 1401 S 4th Ave Unit 1 Yakima, WA | 3.0 | 2.0 | 1320 | $1,495 | $1.13 | 22d | 1 | 0.63mi |
| 1415 W Yakima Ave Unit O Yakima, WA | 2.0 | 1.5 | 1080 | $1,250 | $1.16 | 44d | 1 | 0.88mi |
| 1512 Landon Ave Unit 1 Yakima, WA | 3.0 | 1.0 | 1200 | $1,500 | $1.25 | 22d | 1 | 0.89mi |
| 5200 Jazz ST Yakima, WA | 2.0–3.0 | 2.5 | 1484 | $1,900 | $1.28 | 14d | 2 | 1.09mi |
| 1106 Spokane St Yakima, WA | 3.0 | 1.0 | 1400 | $1,795 | $1.28 | 22d | 1 | 1.11mi |
| 1900 W Mead Ave #1 Yakima, WA | 3.0 | 2.0 | 1350 | $2,050 | $1.52 | 22d | 1 | 1.14mi |
| 1912 W Mead Ave #1 Yakima, WA | 3.0 | 2.0 | 1204 | $1,795 | $1.49 | 22d | 1 | 1.16mi |
| 809 W Washington Ave Yakima, WA | 2.0 | 2.0 | 1264 | $1,595 | $1.26 | 14d | 1 | 1.17mi |
| 1917 Landon Ave Union Gap, WA | 3.0 | 2.0 | 1400 | $2,100 | $1.50 | 44d | 1 | 1.40mi |
| 1518 S 24th Ave Yakima, WA | 4.0 | 2.5 | 2250 | $2,000 | $0.89 | 22d | 1 | 1.43mi |
| 1121 E Viola Ave Yakima, WA | 3.0–4.0 | 2.0 | 1168 | $1,200 | $1.03 | 14d | 1 | 1.47mi |
Listing history 18 events
-
2026-06-19days on market $75,000 Active 22 DOM
-
2026-06-18days on market $75,000 Active 21 DOM
-
2026-06-17days on market $75,000 Active 20 DOM
-
2026-06-16days on market $75,000 Active 19 DOM
-
2026-06-15days on market $75,000 Active 18 DOM
-
2026-06-14days on market $75,000 Active 16 DOM
-
2026-06-13days on market $75,000 Active 15 DOM
-
2026-06-10days on market $75,000 Active 13 DOM
-
2026-06-09days on market $75,000 Active 12 DOM
-
2026-06-08days on market $75,000 Active 11 DOM
-
2026-06-07days on market $75,000 Active 10 DOM
-
2026-06-05days on market $75,000 Active 7 DOM
-
2026-06-03days on market $75,000 Active 6 DOM
-
2026-06-02days on market $75,000 Active 5 DOM
-
2026-06-01days on market $75,000 Active 4 DOM
-
2026-05-31days on market $75,000 Active 3 DOM
-
2026-05-30days on market $75,000 Active 2 DOM
-
2026-05-28$75,000 Active
ⓘ Source: listings_history table (triggers on properties + properties_extension) + one-shot
backfill from property_details.listing_events for pre-trigger history.
Tax reassessment forecast WA · Resets to sale price
- Current annual tax
- $2,483 · $207/mo
- Projected year-2 tax
- $2,483 · $207/mo
- Expected delta
- $0/yr ($0/mo · 0.0%)
ⓘ Screening estimate from a state-policy table — verify with the county assessor before closing.
Climate risk First Street
- Flood 1/10 Low FEMA zone X (unshaded) · 0% chance over 30 yrs
- Wildfire 1/10 Low
- Heat 4/10 Moderate 7 d/yr ≥98°F today · 14 d/yr by 30 yrs out
- Wind 1/10 Low
- Air quality 9/10 Extreme 16 unhealthy d/yr today · 19 by 30 yrs out
Nearby sold comps map
Loading sold comps map…
Walkable amenities ~0.75 mi
Loading nearby amenities…
Taxation est. · year 1
- Rental income
- $19,751
- − Mortgage interest
- −$16,534
- − Property taxes
- −$2,483
- − Insurance
- −$1,476
- − Repairs & maintenance
- −$1,580
- − Management
- −$1,580
- − Depreciation
- −$8,587
- Taxable loss
- −$12,489
- Est. tax savings @ 24.0%
- +$2,997
- After-tax cash flow
- $-3,933/yr
For passive investors: Depreciation is non-cash, so a rental often shows a tax loss while cash-flowing — sheltering income. Rental losses are passive: they offset passive income freely, and up to $25,000/yr can offset ordinary (W-2) income if you actively participate and your MAGI is under $100k (phasing out to $0 by $150k); unused losses carry forward. On sale, claimed depreciation is recaptured at up to 25%, and gains may owe capital-gains tax (a 1031 exchange can defer both). Figures are a year-1 estimate at your 24.0% rate — not tax advice; consult a CPA.
Schools (NCES district)
- District
- Yakima School District
- NCES district ID
- 5310110
- Math proficiency
- 34% ▼ -1.00%
- Reading proficiency
- 42% ▬ 0.00%
- Median HH income
- $36,538
- Composite
- 34.04/100
- National rank
- #10305
- State rank
- #238 of 291 in WA
Livability — Yakima
- Score
- 80/100
- State rank
- #98
- US rank
- #1912
Category grades
Schools grade is shown separately in the Schools card above.
Census & demographics
- Census place
- Yakima, WA
- City population
- 115,918
- Population (ZIP)
- 19,010
Population outlook (Yakima County) Hauer SSP2
- Today (2025)
- 256,514 people
- By 2030
- 259,403 · +1.1%
- By 2040
- 265,677 · +3.6%
- By 2050
- 273,061 · +6.5%
- By 2075
- 296,991 · +15.8%
- By 2100
- 315,291 · +22.9%
Race, ethnicity, and origin ACS 2023
- Neighborhood character
- Diverse neighborhood (Simpson 0.58)
- Race & ethnicity
- White 49% Hispanic / Latino 42% Two or more races 19% Asian 3% Native American 3%
- Hispanic origin (detail)
- Mexican 38%
- Common ancestry
- Italian 3% Portuguese 2% Lithuanian 1%
- Foreign-born
- 15% · Canada, Vietnam
- Languages at home
- 63% English-only · Spanish 33% Other Asian/Pacific 1% Other Indo-European 1%
Political lean MEDSL · Yakima
- 2024 margin
- R (+14.3) · D 41.6% · R 55.9% · Other 2.5%
- 2008→2024 swing
- -3.8pp toward R · 2008: -10.6pp · 2024: -14.3pp
- All cycles
- 2024: R+14.3 2020: R+7.7 2016: R+15.4 2012: R+15.1 2008: R+10.6
Not yet ingested
- Civics
- —
Market trends
- HPI YoY
- ▼ -83.90%
- Current HPI
- 300.5753
- Rent YoY
- —
- Metro
- —
- State GDP YoY
- ▲ 4.65%
- F500 in state
- 22
Industry mix (Fortune 500 HQ in WA)
| Industry | F500 HQs | Revenue |
|---|---|---|
| Retail | 2 | $269B |
|
||
| Technology / Retail | 1 | $638B |
|
||
| Technology | 1 | $245B |
|
||
| Telecommunications | 1 | $38B |
|
||
| Food / Beverage | 1 | $36B |
|
||
| Automotive / Trucks | 1 | $34B |
|
||
Price history
1 event — show timeline
- 2026-05-28 Listed $75,000 YAMLS
Property tax history
+6.2%/yrLatest (2026): $2,483 · -0.0% YoY. Source: county tax records.
Cash-flow waterfall
monthlySold comps — $/sqft
last 12 mo · ≤1 miLoading sold comps…