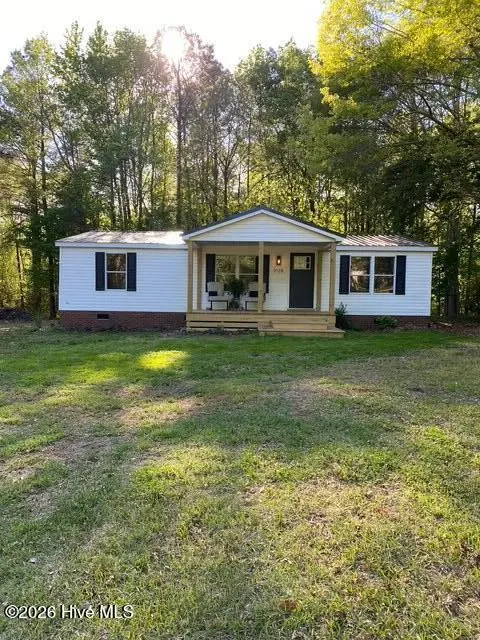
3128 Prophecy Rd · Middlesex, NC
Flood risk 1/10 · Minimal
- FEMA flood zone
- X (unshaded)
- Chance of flooding over 30 yrs
- 0.0%
- Est. flood insurance / yr
- $507 – $1,088
Fire risk 2/10 · Minimal
- Est. fire insurance / yr
- $906 – $1,684
Heat risk 6/10 · Moderate
- Hot days now (above 106°F)
- 7 days/yr
- Hot days in 30 yrs
- 16 days/yr
Wind risk 6/10 · Moderate
- Chance of severe wind over 30 yrs
- 63.0%
Air-quality risk 2/10 · Minimal
- Unhealthy air days now
- 1 days/yr
- Unhealthy air days in 30 yrs
- 1 days/yr
Risk factors via First Street. Map © Google.
Why this score? — see what drove the F grade
The composite is a weighted blend of 9 inputs, each scored 0–100. Each bar is that input's sub-score; the figure is the points it added to the 100-point composite (weight × sub-score).
- Appreciation +8.9/10.0
- ARV discount +7.5/15.0
- Cash flow +6.3/30.0
- Livability +3.0/5.0
- Rent growth +2.5/5.0
- Condition / age +2.5/5.0
- Schools +2.2/10.0
- DSCR +0.6/10.0
- 1% rule +0.2/10.0
$275,000
🖨 Deal sheet (PDF) 📄 Offer letter ✓ Due diligence
Listing remarks MLS
SELLER WILL PAY 3% OF SELL PRICE TOWARDS BUYERS CLOSING COSTS. OFFERED AS IS- BRING ALL OFFERS- NICE COVERED DECK- BIG ATTACHED STORAGE OR WORKSHOP.
Key facts
- New metal roof
- New front porch
- New large back deck
Tags
Property features AI
Finance
- Other: Lot size: 1.13 acres; Zoned Ag
Exterior
- Parking: On-site unpaved parking
- Utilities: Well water; Septic tank; Utilities: see remarks
- Home design: Manufactured home (residential); One-story; Entry level: 1
- Construction: Vinyl siding; Brick/mortar foundation; Metal roof; Construction details: see remarks
- Exterior features: Deck; Porch; Property has a view; No fencing
Interior
- Kitchen: Electric water heater
- Bedrooms: Total of 8 rooms (bedroom count not separately provided)
- Bathrooms: 2 full bathrooms
- Heating & cooling: Heat pump heating; Electric heating; Central air conditioning; Heat pump cooling
- Interior features: Walk-in closet(s); Accessible full bathroom
- Laundry & utility: Washer hookup; Dedicated laundry room
Neighborhood map
What this means for you Summary
Snapshot
- This is a 3-bed/2.0-bath manufactured listed at $275k.
Deal economics
- At list price, monthly cash flow is $-494 ($-6k/yr) — negative.
- To cash-flow at today's rent, offer at most $188k (31.7% below list).
- To meet the 1% rule (rent ≥ 1% of price), the offer needs to be $142k (48.3% below list).
- Recommended offer: $142k (48.3% below list) — sets the bar for 1% rule.
- Cap rate 4.1% vs local median 3.2% in Middlesex — meaningfully above typical; check what's discounted (condition, days-on-market, listing class) to confirm the premium yield is real.
Location & tenants
- Location reads 59/100 on livability (#551 in NC) — a working-class tenant base; expect higher turnover. Strengths: crime A+, cost of living A+, housing A; Watch: amenities F, commute F, employment F.
- Nash-Rocky Mount Schools (rural): math 20% / reading 32% proficiency, ranked #155 of 178 in NC (top 87%) — low school quality limits family demand, transient renter base, plan for 1-2y turnover.
- Zoned schools: Spring Hope Elementary (math 15% / reading 28%, grade F, #1,218 of 1,410 statewide, top 87%, 363 students, 88% FRL); Southern Nash Middle (math 20% / reading 35%, grade F, #368 of 475 statewide, top 78%, 798 students, 69% FRL); Southern Nash High (math 32% / reading 44%, grade F, #409 of 535 statewide, top 77%, 1,070 students, 56% FRL).
- Market conditions: 178 active listings in the ZIP; 500 units permitted in Nash County in 2024 (0 in 5+ unit buildings).
Forward outlook
- In year one you build about $23k of equity ($2k loan paydown + $21k appreciation (7.7% local appreciation)).
- Nash County population projected at -12% by 2050 — secular population decline; favor cash flow + early exit over multi-decade hold.
- By year 2, paydown + projected appreciation supports a ~$37k cash-out refi (75% LTV) — recoverable capital for the next deal without selling this one.
Negotiation context
- It's been on market 48 days — a 3% lower offer ($267k) is reasonable based on typical stale-listing flexibility.
- 5 sale attempts since 23y ago with the ask held roughly flat each time — persistent listings suggest the price (not the market) is what's stuck; bring a comps-based counter.
- Current owner paid $74k; list at $275k implies a 272% gain — meaningful room to come down on a strong offer.
Risks & watch-outs
- Climate carrying-cost: major wind risk, 63% chance of damaging wind over 30y; extreme-heat days projected 7→16/yr by 2055 (HVAC capex compounding) — expect insurance premiums to compound above CPI over the hold.
Questions for the listing agent
- What do current leases actually rent for vs. the listed asking? Can we see a recent rent roll and the last 12 months of T-12 income?
- It's been on market 48 days. Have you received any prior offers? Is the seller open to a 48% concession, seller financing, or rate buy-down credit?
- Is there a deadline driving the sale (1031 exchange, divorce, estate, relocation)? That informs how much negotiation room exists.
- Schools are F-rated, which usually means shorter tenancies and higher turnover. Who's the typical renter profile here, and what's been the actual vacancy rate?
- The area grade is low — what's the realistic commute time and amenity access for the typical tenant pool here? Any planned neighborhood developments (good or bad) we should know about?
- What's the average days-on-market for RENTAL listings here right now (not sales)? A rising rental-DOM trend means longer vacancies and softer asking-rent achievability than the comps imply.
- What's the recent tenant-quality profile in this submarket — average credit score on applications, eviction rate, late-payment / NSF rate, and stable-employment percentage? A property-management company in the area should have these aggregated.
- How much new for-sale + rental construction is in the pipeline within 1–3 miles? Heavy new supply typically softens prices + rents 12–24 months out; constrained supply supports both.
Investment metrics
- 1% rule
- 0.52% ✗
- Cap rate
- 4.14%
- Cash-on-cash
- -7.69%
- DSCR
- 0.66
- GRM
- 16.1
CMA / ARV
No comps found within radius.
Projected returns pro-forma
7.73% appreciation · 3.0% rent growth · sell at horizon
- IRR
- 13.5%
- Equity multiple
- 2.00×
- Total profit
- $76,992
- Equity at exit
- $203,932
- IRR
- 13.7%
- Equity multiple
- 4.20×
- Total profit
- $246,339
- Equity at exit
- $400,131
Cash invested: $77,000 (down + closing). Projections, not guarantees.
Landlord ↔ Tenant lean methodology
- Overall (STATE)
- 85 Strongly Landlord-Friendly
- State North Carolina
- 85 Strongly Landlord-Friendly · R+3
- County
- — inherits STATE
- City
- — inherits STATE
ZIP-level market 27557
- Home prices YoY
- 2.5%
- Active inventory
- 178
- Price-to-rent
- 16.1×
Monthly cashflow live
- Estimated rent
- $1,421 medium interval (Pro) →
- Mortgage (P&I)
- −$1,442
- Tax from tax record
- −$60 /mo · $716/yr
- Insurance
- −$115
- HOA
- −$0
- Lot rent leased land?
- −$0
- Vacancy / Maint / Mgmt
- −$298
- Net cashflow
- $-494
Break-even live
Sensitivity live
| Price | -10% $-338 | -5% $-416 | +0% $-494 | +5% $-572 | +10% $-649 |
|---|---|---|---|---|---|
| Rent | -10% $-606 | -5% $-550 | +0% $-494 | +5% $-438 | +10% $-381 |
| Rate | -1.0pp $-355 | -0.5pp $-424 | base $-494 | +0.5pp $-565 | +1.0pp $-637 |
UW: 25.0% down · 7.5% · 30yr · 1.5% tax · 5.0% vac · 8.0% maint · 8.0% mgmt
Financing live
Cash to close
- Down payment
- $68,750
- Closing costs
- $8,250
- Reserves months
- —
- Total cash needed
- —
Loan-product check · same deal, 3 products live
Conventional
25% down · 7.5% · 30yr
- Down + closing
- —
- Monthly P&I
- —
- Monthly cashflow
- —
- DSCR
- —
- Eligible?
- —
Personal DTI + credit; lowest rate.
DSCR
20% down · 8.5% · 30yr
- Down + closing
- —
- Monthly P&I
- —
- Monthly cashflow
- —
- DSCR
- —
- Eligible?
- —
No personal income docs; deal must DSCR.
Hard money
10% down · 12.0% · 12mo
- Down + closing
- —
- Monthly P&I
- —
- Monthly cashflow
- —
- DSCR
- —
- Eligible?
- —
Short-term bridge; refi at stabilization.
Listing history 30 events
-
2026-06-21pricedays on market $275,000 Active 48 DOM
-
2026-06-19days on market $285,000 Active 46 DOM
-
2026-06-18days on market $285,000 Active 45 DOM
-
2026-06-17days on market $285,000 Active 44 DOM
-
2026-06-16days on market $285,000 Active 43 DOM
-
2026-06-15days on market $285,000 Active 42 DOM
-
2026-06-14days on market $285,000 Active 40 DOM
-
2026-06-13days on market $285,000 Active 39 DOM
-
2026-06-10days on market $285,000 Active 37 DOM
-
2026-06-09days on market $285,000 Active 36 DOM
-
2026-06-08days on market $285,000 Active 35 DOM
-
2026-06-07days on market $285,000 Active 34 DOM
-
2026-06-03days on market $285,000 Active 30 DOM
-
2026-06-02days on market $285,000 Active 29 DOM
-
2026-06-01days on market $285,000 Active 28 DOM
-
2026-05-31days on market $285,000 Active 27 DOM
-
2026-05-30days on market $285,000 Active 26 DOM
-
2026-05-18status Active
-
2026-05-06status Pending
-
2026-04-22$285,000 Active
-
2025-03-28soldstatus $74,000
-
2024-11-04price $39,900 148-char remark
Show marketing remark (148 chars)
SELLER WILL PAY 3% OF SELL PRICE TOWARDS BUYERS CLOSING COSTS. OFFERED AS IS- BRING ALL OFFERS- NICE COVERED DECK- BIG ATTACHED STORAGE OR WORKSHOP.
-
2023-12-26historical 148-char remark
Show marketing remark (148 chars)
SELLER WILL PAY 3% OF SELL PRICE TOWARDS BUYERS CLOSING COSTS. OFFERED AS IS- BRING ALL OFFERS- NICE COVERED DECK- BIG ATTACHED STORAGE OR WORKSHOP.
-
2023-11-29$310,000 Active 148-char remark
Show marketing remark (148 chars)
SELLER WILL PAY 3% OF SELL PRICE TOWARDS BUYERS CLOSING COSTS. OFFERED AS IS- BRING ALL OFFERS- NICE COVERED DECK- BIG ATTACHED STORAGE OR WORKSHOP.
-
2023-11-29price $310,000 148-char remark
Show marketing remark (148 chars)
SELLER WILL PAY 3% OF SELL PRICE TOWARDS BUYERS CLOSING COSTS. OFFERED AS IS- BRING ALL OFFERS- NICE COVERED DECK- BIG ATTACHED STORAGE OR WORKSHOP.
-
2004-01-30soldstatus $35,200 148-char remark
Show marketing remark (148 chars)
SELLER WILL PAY 3% OF SELL PRICE TOWARDS BUYERS CLOSING COSTS. OFFERED AS IS- BRING ALL OFFERS- NICE COVERED DECK- BIG ATTACHED STORAGE OR WORKSHOP.
-
2004-01-30soldstatus $35,200 Sold 148-char remark
Show marketing remark (148 chars)
SELLER WILL PAY 3% OF SELL PRICE TOWARDS BUYERS CLOSING COSTS. OFFERED AS IS- BRING ALL OFFERS- NICE COVERED DECK- BIG ATTACHED STORAGE OR WORKSHOP.
-
2004-01-30soldstatus $35,200 148-char remark
Show marketing remark (148 chars)
SELLER WILL PAY 3% OF SELL PRICE TOWARDS BUYERS CLOSING COSTS. OFFERED AS IS- BRING ALL OFFERS- NICE COVERED DECK- BIG ATTACHED STORAGE OR WORKSHOP.
-
2003-09-17$39,900 148-char remark
Show marketing remark (148 chars)
SELLER WILL PAY 3% OF SELL PRICE TOWARDS BUYERS CLOSING COSTS. OFFERED AS IS- BRING ALL OFFERS- NICE COVERED DECK- BIG ATTACHED STORAGE OR WORKSHOP.
-
2003-09-17$39,900 148-char remark
Show marketing remark (148 chars)
SELLER WILL PAY 3% OF SELL PRICE TOWARDS BUYERS CLOSING COSTS. OFFERED AS IS- BRING ALL OFFERS- NICE COVERED DECK- BIG ATTACHED STORAGE OR WORKSHOP.
ⓘ Source: listings_history table (triggers on properties + properties_extension) + one-shot
backfill from property_details.listing_events for pre-trigger history.
Tax reassessment forecast NC · Resets to sale price
- Current annual tax
- $716 · $60/mo
- Projected year-2 tax
- $2,255 · $188/mo
- Expected delta
- +$1,539/yr (+$128/mo · 214.8%)
ⓘ Screening estimate from a state-policy table — verify with the county assessor before closing.
Climate risk First Street
- Flood 1/10 Low FEMA zone X (unshaded) · 0% chance over 30 yrs
- Wildfire 2/10 Low
- Heat 6/10 Major 7 d/yr ≥106°F today · 16 d/yr by 30 yrs out
- Wind 6/10 Major 63% chance of damaging wind over 30 yrs
- Air quality 2/10 Low 1 unhealthy d/yr today · 1 by 30 yrs out
Nearby sold comps map
Loading sold comps map…
Walkable amenities ~0.75 mi
Loading nearby amenities…
Taxation est. · year 1
- Rental income
- $17,053
- − Mortgage interest
- −$15,404
- − Property taxes
- −$716
- − Insurance
- −$1,375
- − Repairs & maintenance
- −$1,364
- − Management
- −$1,364
- − Depreciation
- −$8,000
- Taxable loss
- −$11,171
- Est. tax savings @ 24.0%
- +$2,681
- After-tax cash flow
- $-3,244/yr
For passive investors: Depreciation is non-cash, so a rental often shows a tax loss while cash-flowing — sheltering income. Rental losses are passive: they offset passive income freely, and up to $25,000/yr can offset ordinary (W-2) income if you actively participate and your MAGI is under $100k (phasing out to $0 by $150k); unused losses carry forward. On sale, claimed depreciation is recaptured at up to 25%, and gains may owe capital-gains tax (a 1031 exchange can defer both). Figures are a year-1 estimate at your 24.0% rate — not tax advice; consult a CPA.
Schools (NCES district)
- District
- Nash-Rocky Mount Schools
- NCES district ID
- 3703270
- Math proficiency
- 20% ▼ -3.00%
- Reading proficiency
- 32% ▲ 1.00%
- Median HH income
- $41,553
- Composite
- 22.04/100
- National rank
- #8198
- State rank
- #155 of 178 in NC
Livability — Middlesex
- Score
- 59/100
- State rank
- #551
- US rank
- #20308
Category grades
Schools grade is shown separately in the Schools card above.
Census & demographics
- Population (ZIP)
- 8,407
Population outlook (Nash County) Hauer SSP2
- Today (2025)
- 91,107 people
- By 2030
- 89,193 · -2.1%
- By 2040
- 84,959 · -6.7%
- By 2050
- 80,517 · -11.6%
- By 2075
- 72,941 · -19.9%
- By 2100
- 63,602 · -30.2%
Race, ethnicity, and origin ACS 2023
- Neighborhood character
- Diverse neighborhood (Simpson 0.64)
- Race & ethnicity
- White 54% Hispanic / Latino 23% Black 13% Two or more races 13% Native American 3%
- Hispanic origin (detail)
- Mexican 13% Puerto Rican 4%
- Common ancestry
- Slovak 2% Romanian 2% Lithuanian 1%
- Foreign-born
- 10% · Canada
- Languages at home
- 77% English-only · Spanish 23%
Political lean MEDSL · Nash
- 2024 margin
- Toss-up / Even · D 48.7% · R 50.5%
- 2008→2024 swing
- -0.4pp no change · 2008: -1.3pp · 2024: -1.8pp
- All cycles
- 2024: R+1.8 2020: D+0.2 2016: R+0.2 2012: D+0.9 2008: R+1.3
Not yet ingested
- Civics
- —
Market trends
- HPI YoY
- ▲ 7.73%
- Current HPI
- 311.489
- Rent YoY
- —
- Metro
- —
- State GDP YoY
- ▲ 3.28%
- F500 in state
- 26
Industry mix (Fortune 500 HQ in NC)
| Industry | F500 HQs | Revenue |
|---|---|---|
| Financial Services | 2 | $213B |
|
||
| Retail | 2 | $95B |
|
||
| Industrial Conglomerate | 1 | $38B |
|
||
| Metals / Steel | 1 | $35B |
|
||
| Utilities | 1 | $30B |
|
||
| Industrial Machinery | 1 | $19B |
|
||
Price history
+614.3% since first listed13 events — show timeline
- 2026-05-18 Relisted — Hive MLS
- 2026-05-06 Pending — Hive MLS
- 2026-04-22 Listed $285,000 Hive MLS
- 2025-03-28 Sold (Public Records) $74,000 Public Records
- 2024-11-04 Price Changed $39,900 TMLS
- 2023-12-26 Listing Removed — TMLS
- 2023-11-29 Listed $310,000 TMLS
- 2023-11-29 Price Changed $310,000 TMLS
- 2004-01-30 Sold (MLS) $35,200 AMLSNC
- 2004-01-30 Sold (MLS) $35,200 TMLS
- 2004-01-30 Sold (MLS) $35,200 TMLS
- 2003-09-17 Listed $39,900 AMLSNC
- 2003-09-17 Listed $39,900 TMLS
Property tax history
+0.8%/yrLatest (2025): $716 · +12.5% YoY. Source: county tax records.
Cash-flow waterfall
monthlySold comps — $/sqft
last 12 mo · ≤1 miLoading sold comps…