7139 Beech Hill Rd · Mayville, NY
Flood risk 1/10 · Minimal
- FEMA flood zone
- —
- Chance of flooding over 30 yrs
- 0.0%
- Est. flood insurance / yr
- —
Fire risk 3/10 · Minor
- Est. fire insurance / yr
- $691 – $1,283
Heat risk 1/10 · Minimal
- Hot days now (above 89°F)
- 7 days/yr
- Hot days in 30 yrs
- 16 days/yr
Wind risk 1/10 · Minimal
- Chance of severe wind over 30 yrs
- —
Air-quality risk 2/10 · Minimal
- Unhealthy air days now
- 1 days/yr
- Unhealthy air days in 30 yrs
- 2 days/yr
Risk factors via First Street. Map © Google.
Why this score? — see what drove the D+ grade
The composite is a weighted blend of 9 inputs, each scored 0–100. Each bar is that input's sub-score; the figure is the points it added to the 100-point composite (weight × sub-score).
- Cash flow +12.3/30.0
- ARV discount +7.5/15.0
- Appreciation +7.2/10.0
- Schools +5.3/10.0
- 1% rule +4.2/10.0
- Livability +3.8/5.0
- DSCR +3.7/10.0
- Rent growth +2.5/5.0
- Condition / age +2.5/5.0
$129,000
🖨 Deal sheet 📄 Offer letter ✓ Due diligence
Listing remarks
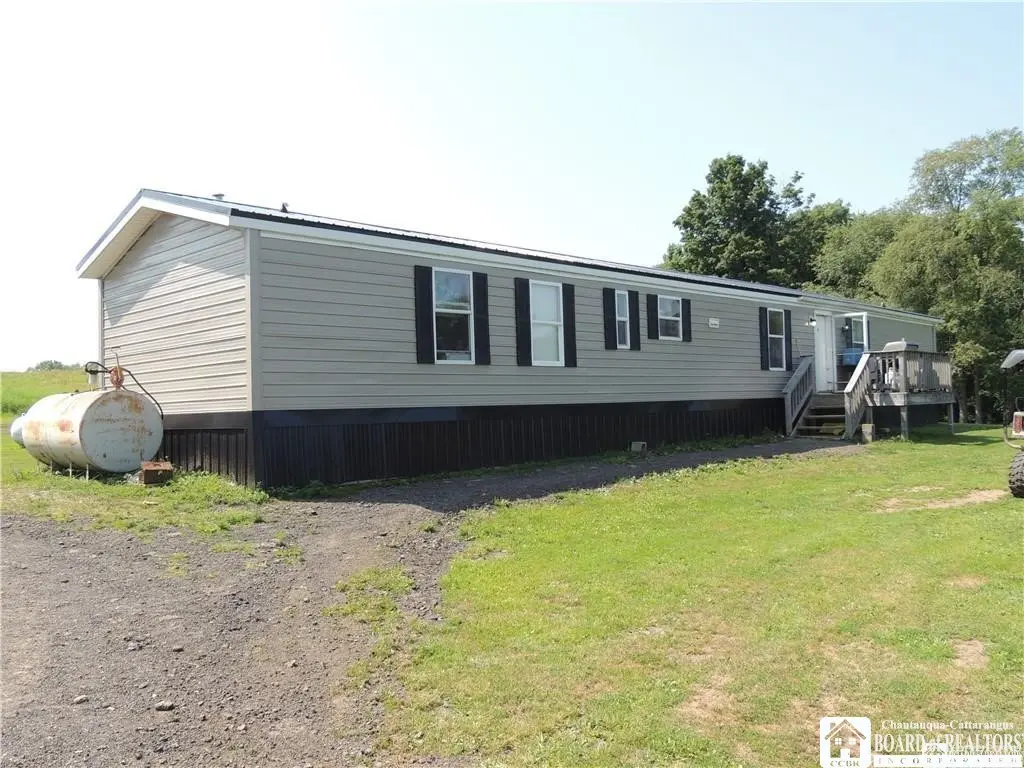
Country living on a great 1.3-acre lot featuring a quality built 2000 Redman single-wide manufactured home (16'x80'). This 3-bedroom/2-bathroom home boasts a new metal roof, metal siding, and metal skirting, making it practically maintenance-free. Nicely appointed kitchen with a huge hidden pantry/utility/laundry room. Includes a metal-sided, metal-roofed machine shed pole building (Seller wants to point out that the Pole Building is an Agricultural building and was built under an Ag exemption). Located in the Town of Chautauqua with the highly desired Chautauqua Lake Central School System, resulting in lower taxes. 24-hour notice required for showings. Sellers require a pre-qualification l
Key facts
- New metal roof
- Metal siding
- 1.3-acre lot
Tags
Neighborhood map
What this means for you Summary
Snapshot
- This is a 3-bed/2.0-bath manufactured listed at $129k.
Deal economics
- At list price, monthly cash flow is $-24 ($-283/yr) — negative.
- To cash-flow at today's rent, offer at most $125k (3.2% below list).
- To meet the 1% rule (rent ≥ 1% of price), the offer needs to be $118k (8.4% below list).
- Recommended offer: $118k (8.4% below list) — sets the bar for 1% rule.
Location & tenants
- Location reads 75/100 on livability (#259 in NY, #4,087 nationally) — a middle-class / working-renter tenant base. Strengths: cost of living A+, housing A+, health & safety A+; Watch: amenities F, commute F.
- Chautauqua Lake Central School District (rural): math 65% / reading 59% proficiency, ranked #218 of 590 in NY (top 37%) — acceptable for families but not a draw, mixed tenant base, ~2y average lease.
- Market conditions: 21 active listings in the ZIP; 127 units permitted in Chautauqua County in 2024 (0 in 5+ unit buildings).
Forward outlook
- In year one you build about $7k of equity ($892 loan paydown + $6k appreciation (4.4% local appreciation)).
- Chautauqua County population projected at -22% by 2050 — secular population decline; favor cash flow + early exit over multi-decade hold.
- At projected returns (4.4% appreciation + 3.0% rent growth), your $36k cash investment doubles in ~5 years — after that, you're playing with house money.
- By year 6, paydown + projected appreciation supports a ~$35k cash-out refi (75% LTV) — recoverable capital for the next deal without selling this one.
Negotiation context
- It's been on market 82 days — a 6% lower offer ($121k) is reasonable based on typical stale-listing flexibility.
- 2 sale attempts with the ask held roughly flat each time — persistent listings suggest the price (not the market) is what's stuck; bring a comps-based counter.
Questions for the listing agent
- What do current leases actually rent for vs. the listed asking? Can we see a recent rent roll and the last 12 months of T-12 income?
- It's been on market 82 days. Have you received any prior offers? Is the seller open to a 8% concession, seller financing, or rate buy-down credit?
- Why hasn't it sold? Are there any deal-killer items the seller is aware of (foundation, flood, title, zoning, code violations)?
- Is there a deadline driving the sale (1031 exchange, divorce, estate, relocation)? That informs how much negotiation room exists.
- The area grade is low — what's the realistic commute time and amenity access for the typical tenant pool here? Any planned neighborhood developments (good or bad) we should know about?
- What's the average days-on-market for RENTAL listings here right now (not sales)? A rising rental-DOM trend means longer vacancies and softer asking-rent achievability than the comps imply.
- What's the recent tenant-quality profile in this submarket — average credit score on applications, eviction rate, late-payment / NSF rate, and stable-employment percentage? A property-management company in the area should have these aggregated.
- How much new for-sale + rental construction is in the pipeline within 1–3 miles? Heavy new supply typically softens prices + rents 12–24 months out; constrained supply supports both.
Investment metrics
- 1% rule
- 0.92% ✗
- Cap rate
- 6.07%
- Cash-on-cash
- -0.78%
- DSCR
- 0.97
- GRM
- 9.1
CMA / ARV
No comps found within radius.
Projected returns pro-forma
4.44% appreciation · 3.0% rent growth · sell at horizon
- IRR
- 10.8%
- Equity multiple
- 1.67×
- Total profit
- $24,233
- Equity at exit
- $68,788
- IRR
- 12.3%
- Equity multiple
- 3.12×
- Total profit
- $76,735
- Equity at exit
- $115,296
Cash invested: $36,120 (down + closing). Projections, not guarantees.
Landlord ↔ Tenant lean methodology
- Overall (STATE)
- 15 Strongly Tenant-Friendly
- State New York
- 15 Strongly Tenant-Friendly · D+10
- County
- — inherits STATE
- City
- — inherits STATE
ZIP-level market 14728
- Home prices YoY
- 1.3%
- Active inventory
- 21
- Price-to-rent
- 9.1×
Monthly cashflow live
- Estimated rent
- $1,181 medium interval (Pro) →
- Mortgage (P&I)
- −$676
- Tax from tax record
- −$226 /mo · $2,716/yr
- Insurance
- −$54
- HOA
- −$0
- Vacancy / Maint / Mgmt
- −$248
- Net cashflow
- $-24
Break-even live
UW: 25.0% down · 7.5% · 30yr · 1.5% tax · 5.0% vac · 8.0% maint · 8.0% mgmt
Financing live
Cash to close
- Down payment
- $32,250
- Closing costs
- $3,870
- Reserves months
- —
- Total cash needed
- —
Loan-product check · same deal, 3 products live
Conventional
25% down · 7.5% · 30yr
- Down + closing
- —
- Monthly P&I
- —
- Monthly cashflow
- —
- DSCR
- —
- Eligible?
- —
Personal DTI + credit; lowest rate.
DSCR
20% down · 8.5% · 30yr
- Down + closing
- —
- Monthly P&I
- —
- Monthly cashflow
- —
- DSCR
- —
- Eligible?
- —
No personal income docs; deal must DSCR.
Hard money
10% down · 12.0% · 12mo
- Down + closing
- —
- Monthly P&I
- —
- Monthly cashflow
- —
- DSCR
- —
- Eligible?
- —
Short-term bridge; refi at stabilization.
Listing history 19 events
-
2026-06-18days on market $129,000 Active 82 DOM
-
2026-06-17days on market $129,000 Active 81 DOM
-
2026-06-16days on market $129,000 Active 80 DOM
-
2026-06-15days on market $129,000 Active 79 DOM
-
2026-06-13days on market $129,000 Active 77 DOM
-
2026-06-12days on market $129,000 Active 76 DOM
-
2026-06-09days on market $129,000 Active 73 DOM
-
2026-06-08days on market $129,000 Active 72 DOM
-
2026-06-07days on market $129,000 Active 71 DOM
-
2026-06-05days on market $129,000 Active 69 DOM
-
2026-06-04days on market $129,000 Active 67 DOM
-
2026-06-02days on market $129,000 Active 66 DOM
-
2026-06-01days on market $129,000 Active 65 DOM
-
2026-05-31days on market $129,000 Active 64 DOM
-
2026-04-03historical Active Under Contract
-
2026-03-30status Pending
-
2026-03-24$129,000 Active
-
2025-06-20historical
-
2025-05-05$60,000 Active
ⓘ Source: listings_history table (triggers on properties + properties_extension) + one-shot
backfill from property_details.listing_events for pre-trigger history.
Tax reassessment forecast NY · Partial reset (capped growth)
- Current annual tax
- $2,716 · $226/mo
- Projected year-2 tax
- $2,716 · $226/mo
- Expected delta
- $0/yr ($0/mo · 0.0%)
ⓘ Screening estimate from a state-policy table — verify with the county assessor before closing.
Climate risk First Street
- Flood 1/10 Low 0% chance over 30 yrs
- Wildfire 3/10 Moderate
- Heat 1/10 Low 7 d/yr ≥89°F today · 16 d/yr by 30 yrs out
- Wind 1/10 Low
- Air quality 2/10 Low 1 unhealthy d/yr today · 2 by 30 yrs out
Nearby sold comps map
Loading sold comps map…
Walkable amenities ~0.75 mi
Loading nearby amenities…
Taxation est. · year 1
- Rental income
- $14,172
- − Mortgage interest
- −$7,226
- − Property taxes
- −$2,716
- − Insurance
- −$645
- − Repairs & maintenance
- −$1,134
- − Management
- −$1,134
- − Depreciation
- −$3,753
- Taxable loss
- −$2,435
- Est. tax savings @ 24.0%
- +$584
- After-tax cash flow
- $302/yr
For passive investors: Depreciation is non-cash, so a rental often shows a tax loss while cash-flowing — sheltering income. Rental losses are passive: they offset passive income freely, and up to $25,000/yr can offset ordinary (W-2) income if you actively participate and your MAGI is under $100k (phasing out to $0 by $150k); unused losses carry forward. On sale, claimed depreciation is recaptured at up to 25%, and gains may owe capital-gains tax (a 1031 exchange can defer both). Figures are a year-1 estimate at your 24.0% rate — not tax advice; consult a CPA.
Schools (NCES district)
- District
- Chautauqua Lake Central School District
- NCES district ID
- 3600018
- Math proficiency
- 65% ▲ 4.00%
- Reading proficiency
- 59% ▲ 7.00%
- Median HH income
- $50,728
- Composite
- 52.84/100
- National rank
- #1535
- State rank
- #218 of 590 in NY
Livability — Mayville
- Score
- 75/100
- State rank
- #259
- US rank
- #4087
Category grades
Schools grade is shown separately in the Schools card above.
Census & demographics
- Population (ZIP)
- 856
Population outlook (Chautauqua County) Hauer SSP2
- Today (2025)
- 123,454 people
- By 2030
- 118,509 · -4.0%
- By 2040
- 107,311 · -13.1%
- By 2050
- 96,703 · -21.7%
- By 2075
- 76,757 · -37.8%
- By 2100
- 60,984 · -50.6%
Race, ethnicity, and origin ACS 2023
- Neighborhood character
- Predominantly White (99%)
- Race & ethnicity
- White 99% Hispanic / Latino 1%
- Common ancestry
- Romanian 6% Lithuanian 2% Iranian 2%
- Foreign-born
- 0%
Political lean MEDSL · Chautauqua
- 2024 margin
- Strong R (+22.0) · D 39.0% · R 61.0%
- 2008→2024 swing
- -22.9pp toward R · 2008: 0.9pp · 2024: -22.0pp
- All cycles
- 2024: R+22.0 2020: R+19.8 2016: R+24.6 2012: R+8.2 2008: D+0.9
Not yet ingested
- Civics
- —
Market trends
- HPI YoY
- ▲ 4.44%
- Current HPI
- 336.7808
- Rent YoY
- —
- Metro
- —
- State GDP YoY
- ▲ 2.60%
- F500 in state
- 92
Industry mix (Fortune 500 HQ in NY)
| Industry | F500 HQs | Revenue |
|---|---|---|
| Financial Services | 10 | $950B |
|
||
| Consumer Goods | 9 | $162B |
|
||
| Insurance | 4 | $225B |
|
||
| Telecommunications | 2 | $144B |
|
||
| Pharmaceuticals | 2 | $112B |
|
||
| Media / Entertainment | 2 | $69B |
|
||
Price history
+115.0% since first listed5 events — show timeline
- 2026-04-03 Contingent — UNYREIS
- 2026-03-30 Pending — UNYREIS
- 2026-03-24 Listed $129,000 UNYREIS
- 2025-06-20 Listing Removed — UNYREIS
- 2025-05-05 Listed $60,000 UNYREIS
Property tax history
+19.9%/yrLatest (2025): $2,716 · +1.0% YoY. Source: county tax records.
Cash-flow waterfall
monthlySold comps — $/sqft
last 12 mo · ≤1 miLoading sold comps…