4911 Goode Rd · Bedford, VA
Flood risk 1/10 · Minimal
- FEMA flood zone
- X (unshaded)
- Chance of flooding over 30 yrs
- 0.0%
- Est. flood insurance / yr
- $507 – $1,088
Fire risk 5/10 · Moderate
- Est. fire insurance / yr
- $666 – $1,236
Heat risk 5/10 · Moderate
- Hot days now (above 101°F)
- 7 days/yr
- Hot days in 30 yrs
- 18 days/yr
Wind risk 2/10 · Minimal
- Chance of severe wind over 30 yrs
- 2.0%
Air-quality risk 2/10 · Minimal
- Unhealthy air days now
- 1 days/yr
- Unhealthy air days in 30 yrs
- 1 days/yr
Risk factors via First Street. Map © Google.
Why this score? — see what drove the D+ grade
The composite is a weighted blend of 9 inputs, each scored 0–100. Each bar is that input's sub-score; the figure is the points it added to the 100-point composite (weight × sub-score).
- ARV discount +15.0/15.0
- Appreciation +10.0/10.0
- Cash flow +6.5/30.0
- Schools +5.5/10.0
- Livability +3.7/5.0
- Rent growth +2.5/5.0
- Condition / age +2.5/5.0
- DSCR +0.8/10.0
- 1% rule +0.3/10.0
$429,900
🖨 Deal sheet 📄 Offer letter ✓ Due diligence
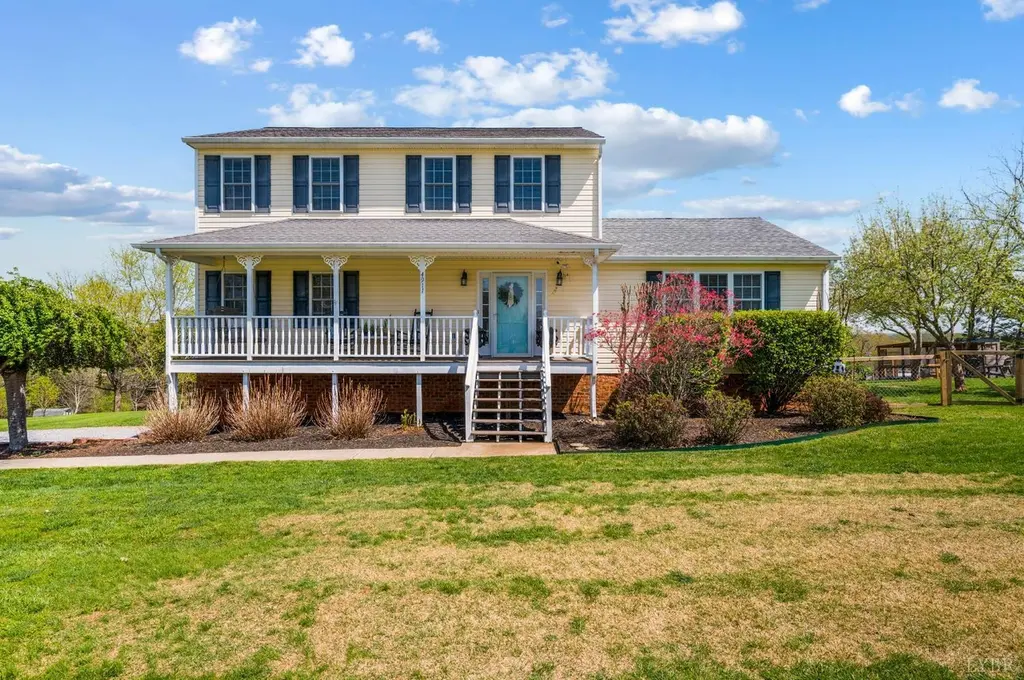
Listing remarks
Welcome to your peaceful country retreat with stunning mountain views! This charming 3-bedroom, 2.5-bath home offers the perfect blend of comfort and outdoor living. Inside, you'll find a spacious great room with a vaulted ceiling and a cozy gas fireplace, ideal for relaxing or entertaining. Step outside and enjoy the covered front porch or unwind on the back deck overlooking almost 2 acres. The property features new fencing, raised garden beds, fruit trees, and a custom-built chicken coop with chickens included if you would like to keep them! Additional highlights include a full unfinished basement offering endless possibilities for expansion or storage, plus a convenient 2-car garage. If
Key facts
- Covered front porch
- New fencing
- Raised garden beds
Tags
Neighborhood map
What this means for you Summary
Snapshot
- This is a 3-bed/3.0-bath single-family listed at $430k.
Deal economics
- At list price, monthly cash flow is $-725 ($-9k/yr) — negative.
- To cash-flow at today's rent, offer at most $302k (29.8% below list).
- To meet the 1% rule (rent ≥ 1% of price), the offer needs to be $230k (46.6% below list).
- Recommended offer: $230k (46.6% below list) — sets the bar for 1% rule.
- Cap rate 4.3% vs local median 3.2% in Bedford — top-decile yield for the area; either an underpriced asset or a hidden risk that comps aren't pricing in. Stress-test before assuming the spread holds.
Location & tenants
- Location reads 74/100 on livability (#137 in VA, #4,371 nationally) — a middle-class / working-renter tenant base. Strengths: cost of living A+, health & safety A+, housing A-; Watch: amenities F, commute F, employment D-.
- Bedford County Public School District (rural): math 55% / reading 73% proficiency, ranked #41 of 131 in VA (top 31%) — acceptable for families but not a draw, mixed tenant base, ~2y average lease.
- Zoned schools: Otter River Elementary (math 64% / reading 74%, grade A-, #313 of 1,108 statewide, top 32%, 198 students, 39% FRL); Forest Middle (math 71% / reading 85%, grade A+, #34 of 342 statewide, top 10%, 870 students, 22% FRL); Jefferson Forest High (math 59% / reading 81%, grade B+, #151 of 319 statewide, top 49%, 1,309 students, 23% FRL) — zoned schools at 28% FRL track the district average.
- Market conditions: 42 active listings in the ZIP; 1 comparable units currently listed for rent nearby; 294 units permitted in Bedford County in 2024 (0 in 5+ unit buildings).
Forward outlook
- In year one you build about $46k of equity ($3k loan paydown + $43k appreciation (10.0% local appreciation)).
- Bedford County population projected at +8% by 2050 — modest demand growth; plan on rents tracking national, not racing it.
- By year 2, paydown + projected appreciation supports a ~$74k cash-out refi (75% LTV) — recoverable capital for the next deal without selling this one.
Negotiation context
- Only 3 days on market — expect competitive offers; lowballing is unlikely to land.
Risks & watch-outs
- Climate carrying-cost: moderate wildfire risk; extreme-heat days projected 7→18/yr by 2055 (HVAC capex compounding) — expect insurance premiums to compound above CPI over the hold.
Questions for the listing agent
- What do current leases actually rent for vs. the listed asking? Can we see a recent rent roll and the last 12 months of T-12 income?
- Is there a deadline driving the sale (1031 exchange, divorce, estate, relocation)? That informs how much negotiation room exists.
- Schools are B-rated — typically a magnet for longer-tenancy family renters. What's the average tenant stay here, and is there a school-zone premium baked into asking?
- The area grade is low — what's the realistic commute time and amenity access for the typical tenant pool here? Any planned neighborhood developments (good or bad) we should know about?
- What's the average days-on-market for RENTAL listings here right now (not sales)? A rising rental-DOM trend means longer vacancies and softer asking-rent achievability than the comps imply.
- What's the recent tenant-quality profile in this submarket — average credit score on applications, eviction rate, late-payment / NSF rate, and stable-employment percentage? A property-management company in the area should have these aggregated.
- How much new for-sale + rental construction is in the pipeline within 1–3 miles? Heavy new supply typically softens prices + rents 12–24 months out; constrained supply supports both.
Investment metrics
- 1% rule
- 0.53% ✗
- Cap rate
- 4.27%
- Cash-on-cash
- -7.23%
- DSCR
- 0.68
- GRM
- 15.6
CMA / ARV
- ARV (on-the-fly)
- $589,680
- Comps found
- 2
Show comp detail 2 sales within ~0.75 mi
| Address | Dist | Beds/Ba | Sqft | Sold | Price | $/sf | Match |
|---|---|---|---|---|---|---|---|
| 4911 Goode Rd | 0.00mi | 3/2.5 | 2,132 (-1%) | 1mo | $435,000 | $204 | 95 |
| 2 Wingfield Dr | 0.72mi | 3/2.5 | 2,090 (-3%) | 22mo | $569,900 | $273 | 40 |
Match score weights: distance 35% · size 25% · config 20% · recency 20%. Top-matched comps best support the ARV.
Projected returns pro-forma
10.0% appreciation · 3.0% rent growth · sell at horizon
- IRR
- 19.2%
- Equity multiple
- 2.56×
- Total profit
- $187,700
- Equity at exit
- $387,288
- IRR
- 17.7%
- Equity multiple
- 5.89×
- Total profit
- $588,620
- Equity at exit
- $835,201
Cash invested: $120,372 (down + closing). Projections, not guarantees.
Landlord ↔ Tenant lean methodology
- Overall (STATE)
- 55 Moderately Landlord-Leaning
- State Virginia
- 55 Moderately Landlord-Leaning · D+2
- County
- — inherits STATE
- City
- — inherits STATE
ZIP-level market 24556
- Home prices YoY
- 3.6%
- Active inventory
- 42
- Price-to-rent
- 15.6×
Monthly cashflow live
- Estimated rent
- $2,295 medium interval (Pro) →
- Mortgage (P&I)
- −$2,254
- Tax from tax record
- −$105 /mo · $1,259/yr
- Insurance
- −$179
- HOA
- −$0
- Vacancy / Maint / Mgmt
- −$482
- Net cashflow
- $-725
Break-even live
UW: 25.0% down · 7.5% · 30yr · 1.5% tax · 5.0% vac · 8.0% maint · 8.0% mgmt
Financing live
Cash to close
- Down payment
- $107,475
- Closing costs
- $12,897
- Reserves months
- —
- Total cash needed
- —
Loan-product check · same deal, 3 products live
Conventional
25% down · 7.5% · 30yr
- Down + closing
- —
- Monthly P&I
- —
- Monthly cashflow
- —
- DSCR
- —
- Eligible?
- —
Personal DTI + credit; lowest rate.
DSCR
20% down · 8.5% · 30yr
- Down + closing
- —
- Monthly P&I
- —
- Monthly cashflow
- —
- DSCR
- —
- Eligible?
- —
No personal income docs; deal must DSCR.
Hard money
10% down · 12.0% · 12mo
- Down + closing
- —
- Monthly P&I
- —
- Monthly cashflow
- —
- DSCR
- —
- Eligible?
- —
Short-term bridge; refi at stabilization.
Rent comps 1 comps
| Address | Beds | Baths | Sqft | Rent | $/sqft | DOM | Units | Dist |
|---|---|---|---|---|---|---|---|---|
| 4946 Goode Rd Goode, VA | 4.0 | 2.0 | 1750 | $2,295 | $1.31 | 13d | 1 | 0.09mi |
Listing history 2 events
-
2026-04-09status Pending
-
2026-04-06$429,900 Active
ⓘ Source: listings_history table (triggers on properties + properties_extension) + one-shot
backfill from property_details.listing_events for pre-trigger history.
Tax reassessment forecast VA · Resets to sale price
- Current annual tax
- $1,259 · $105/mo
- Projected year-2 tax
- $3,525 · $294/mo
- Expected delta
- +$2,266/yr (+$189/mo · 180.0%)
ⓘ Screening estimate from a state-policy table — verify with the county assessor before closing.
Climate risk First Street
- Flood 1/10 Low FEMA zone X (unshaded) · 0% chance over 30 yrs
- Wildfire 5/10 Major
- Heat 5/10 Major 7 d/yr ≥101°F today · 18 d/yr by 30 yrs out
- Wind 2/10 Low 2% chance of damaging wind over 30 yrs
- Air quality 2/10 Low 1 unhealthy d/yr today · 1 by 30 yrs out
Nearby sold comps map
Loading sold comps map…
Walkable amenities ~0.75 mi
Loading nearby amenities…
Taxation est. · year 1
- Rental income
- $27,540
- − Mortgage interest
- −$24,081
- − Property taxes
- −$1,259
- − Insurance
- −$2,150
- − Repairs & maintenance
- −$2,203
- − Management
- −$2,203
- − Depreciation
- −$12,506
- Taxable loss
- −$16,862
- Est. tax savings @ 24.0%
- +$4,047
- After-tax cash flow
- $-4,658/yr
For passive investors: Depreciation is non-cash, so a rental often shows a tax loss while cash-flowing — sheltering income. Rental losses are passive: they offset passive income freely, and up to $25,000/yr can offset ordinary (W-2) income if you actively participate and your MAGI is under $100k (phasing out to $0 by $150k); unused losses carry forward. On sale, claimed depreciation is recaptured at up to 25%, and gains may owe capital-gains tax (a 1031 exchange can defer both). Figures are a year-1 estimate at your 24.0% rate — not tax advice; consult a CPA.
Schools (NCES district)
- District
- Bedford County Public School District
- NCES district ID
- 5100360
- Math proficiency
- 55% ▼ -29.00%
- Reading proficiency
- 73% ▼ -7.00%
- Median HH income
- $56,288
- Composite
- 54.92/100
- National rank
- #1310
- State rank
- #41 of 131 in VA
Livability — Bedford
- Score
- 74/100
- State rank
- #137
- US rank
- #4371
Category grades
Schools grade is shown separately in the Schools card above.
Census & demographics
- City population
- 21,447
- Population (ZIP)
- 2,695
Population outlook (Bedford County) Hauer SSP2
- Today (2025)
- 83,194 people
- By 2030
- 85,499 · +2.8%
- By 2040
- 88,834 · +6.8%
- By 2050
- 90,060 · +8.3%
- By 2075
- 94,131 · +13.1%
- By 2100
- 89,832 · +8.0%
Race, ethnicity, and origin ACS 2023
- Neighborhood character
- Predominantly White (89%)
- Race & ethnicity
- White 89% Two or more races 4% Black 3% Asian 3% Native American 1% Hispanic / Latino 1%
- Common ancestry
- Lithuanian 5% Romanian 3% Italian 3%
- Foreign-born
- 5%
- Languages at home
- 95% English-only · Tagalog/Filipino 2% Other Indo-European 1% Other Asian/Pacific 1%
Political lean MEDSL · Bedford
- 2024 margin
- Solid R (+50.4) · D 24.4% · R 74.8%
- 2008→2024 swing
- -13.0pp toward R · 2008: -37.4pp · 2024: -50.4pp
- All cycles
- 2024: R+50.4 2020: R+48.1 2016: R+49.4 2012: R+45.0 2008: R+37.4
Not yet ingested
- Civics
- —
Market trends
- HPI YoY
- ▲ 11.28%
- Current HPI
- 326.0488
- Rent YoY
- —
- Metro
- —
- State GDP YoY
- ▲ 2.40%
- F500 in state
- 50
Industry mix (Fortune 500 HQ in VA)
| Industry | F500 HQs | Revenue |
|---|---|---|
| Aerospace / Defense | 4 | $236B |
|
||
| Technology / Defense | 3 | $32B |
|
||
| Financial Services | 2 | $176B |
|
||
| Utilities | 2 | $27B |
|
||
| Insurance | 2 | $25B |
|
||
| Technology | 2 | $15B |
|
||
Price history
2 events — show timeline
- 2026-04-09 Pending — LMLS
- 2026-04-06 Listed $429,900 LMLS
Property tax history
+0.7%/yrLatest (2025): $1,259 · +0.0% YoY. Source: county tax records.
Cash-flow waterfall
monthlySold comps — $/sqft
last 12 mo · ≤1 miLoading sold comps…