5517 Eden View Dr · Edmond, OK
Flood risk No data
- FEMA flood zone
- —
- Chance of flooding over 30 yrs
- —
- Est. flood insurance / yr
- —
Fire risk No data
- Est. fire insurance / yr
- —
Heat risk No data
- Hot days now (above threshold)
- —
- Hot days in 30 yrs
- —
Wind risk No data
- Chance of severe wind over 30 yrs
- —
Air-quality risk No data
- Unhealthy air days now
- —
- Unhealthy air days in 30 yrs
- —
Risk factors via First Street. Map © Google.
Why this score? — see what drove the D- grade
The composite is a weighted blend of 9 inputs, each scored 0–100. Each bar is that input's sub-score; the figure is the points it added to the 100-point composite (weight × sub-score).
- Appreciation +10.0/10.0
- ARV discount +7.5/15.0
- Cash flow +5.9/30.0
- Livability +3.9/5.0
- Schools +3.6/10.0
- Rent growth +2.5/5.0
- Condition / age +2.5/5.0
- 1% rule +1.4/10.0
- DSCR +0.3/10.0
$468,490
🖨 Deal sheet 📄 Offer letter ✓ Due diligence
Listing remarks
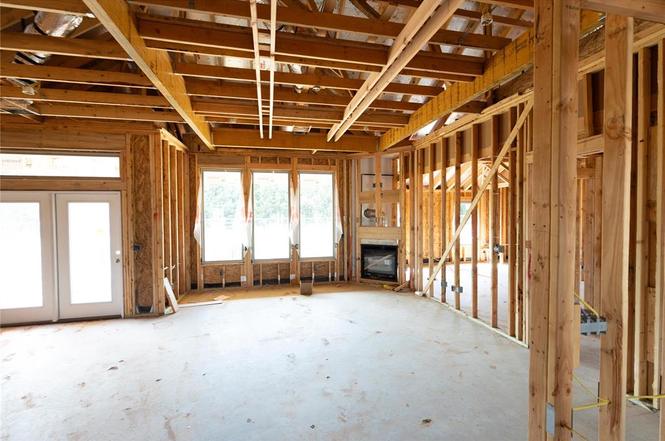
This Mallory floor plan includes 2,420 Sq Ft of total living space, which features 2,100 Sq Ft of indoor living space and 320 Sq Ft of outdoor living space. There is also a 645 Sq Ft, three-car garage with carriage doors and an in-ground storm shelter installed. This incredibly spacious home welcomes 4 bedrooms, 2 bathrooms, a mudroom featuring a mudbench, utility room, and 2 covered patios. The oversized kitchen boasts a straight kitchen island with a trash can pullout, custom-built cabinets to the ceiling, stainless steel appliances, including a 5-burner cooktop, pulls-only cabinet hardware throughout, exclusive pendant lighting, 3 CM countertops, modern tile backsplash, a corner pantry,
Key facts
- Oversized kitchen
- 8,712 sq ft lot
- 3 garage spots
Tags
Property features AI
Finance
- Other: Living area based on plans (2,100 sq ft); Located in Wild Rose Ranch subdivision; Directions: Located on E Sorghum Mill Rd between N Bryant Ave and N Broadway in north Edmond; turn north onto Rose Prairie Blvd to enter the community
- Financial info: Not assumable; Loan qualification does not apply
- HOA & community: Mandatory association dues; Association fee $500 (includes pool and recreation facility)
Exterior
- Parking: Concrete surface; 3-car garage
- Security: Smoke alarm
- Utilities: Cable available; Electricity available; Natural gas available; Public utilities
- Home design: Single family residence; One story; East-facing; Residential property; Under construction (estimated completion August 4, 2026); Model built by Homes by Taber
- Construction: Brick and frame with masonry veneer; Composition roof (new in 2026); Double-pane low-E vinyl frame windows; Post-tension foundation
- Exterior features: Covered patio; Covered porch; Interior lot; Underground sprinkler system; Storm shelter in garage floor
Interior
- Kitchen: Built-in gas range; Built-in electric oven; Dishwasher; Microwave; Garbage disposal
- Bedrooms: 4 bedrooms (includes optional bedroom/inside utility that can serve as a bedroom); Study/office available
- Flooring: Combination of carpet and tile
- Bathrooms: 2 full bathrooms
- Heating & cooling: Central gas heating
- Interior features: Ceiling fans; Blown cellulose insulation; Two fireplaces with metal inserts; Energy Star certified; Home warranty provided; Smart house features (smart systems); Smoke alarm; Tankless hot water
- Laundry & utility: Inside utility; Water heater (listed under appliances)
Neighborhood map
What this means for you Summary
Snapshot
- This is a 4-bed/2.0-bath other listed at $468k.
Deal economics
- At list price, monthly cash flow is $-910 ($-11k/yr) — negative.
- To cash-flow at today's rent, offer at most $337k (28.1% below list).
- To meet the 1% rule (rent ≥ 1% of price), the offer needs to be $300k (36.0% below list).
- Recommended offer: $300k (36.0% below list) — sets the bar for 1% rule.
Location & tenants
- Location reads 78/100 on livability (#6 in OK, #2,383 nationally) — a middle-class / working-renter tenant base. Strengths: employment A+, housing A+, crime A-; Watch: health & safety C-, commute F.
- Edmond (suburban): math 38% / reading 40% proficiency, ranked #11 of 270 in OK (top 4%) — families likely to look elsewhere, expect single-tenant / working-renter base with shorter leases.
- Zoned schools: Heritage Es (math 59% / reading 42%, grade D+, #41 of 845 statewide, top 5%, 867 students, 0% FRL); North Hs (math 47% / reading 57%, grade D+, #1 of 447 statewide, top 0%, 2,555 students, 0% FRL) — zoned schools average 0% FRL vs 22% district-wide (22 pts lower); this property's tenant base skews higher-income than the district average.
- Zoned-school proficiency averages 51% at this address vs 39% district-wide (+12 pts) — the actual schools serving this property are materially stronger than the Edmond average implies; a family-tenant draw the district grade alone would hide.
- Market conditions: 192 active listings in the ZIP; 1 comparable units currently listed for rent nearby; 5,365 units permitted in Oklahoma County in 2024 (569 in 5+ unit buildings).
Forward outlook
- In year one you build about $50k of equity ($3k loan paydown + $47k appreciation (10.0% local appreciation)).
- Oklahoma County population projected at +41% by 2050 — long-run rental-demand tailwind backs the buy-and-hold thesis.
- By year 2, paydown + projected appreciation supports a ~$81k cash-out refi (75% LTV) — recoverable capital for the next deal without selling this one.
Negotiation context
- It's been on market 134 days — a 12% lower offer ($412k) is reasonable based on typical stale-listing flexibility.
Questions for the listing agent
- What do current leases actually rent for vs. the listed asking? Can we see a recent rent roll and the last 12 months of T-12 income?
- It's been on market 134 days. Have you received any prior offers? Is the seller open to a 36% concession, seller financing, or rate buy-down credit?
- What does the HOA fee cover, when was the last increase, and are there any pending special assessments or reserve-fund shortfalls?
- Why hasn't it sold? Are there any deal-killer items the seller is aware of (foundation, flood, title, zoning, code violations)?
- Is there a deadline driving the sale (1031 exchange, divorce, estate, relocation)? That informs how much negotiation room exists.
- Schools are A-rated — typically a magnet for longer-tenancy family renters. What's the average tenant stay here, and is there a school-zone premium baked into asking?
- The area grade is low — what's the realistic commute time and amenity access for the typical tenant pool here? Any planned neighborhood developments (good or bad) we should know about?
- What's the average days-on-market for RENTAL listings here right now (not sales)? A rising rental-DOM trend means longer vacancies and softer asking-rent achievability than the comps imply.
- What's the recent tenant-quality profile in this submarket — average credit score on applications, eviction rate, late-payment / NSF rate, and stable-employment percentage? A property-management company in the area should have these aggregated.
- How much new for-sale + rental construction is in the pipeline within 1–3 miles? Heavy new supply typically softens prices + rents 12–24 months out; constrained supply supports both.
Investment metrics
- 1% rule
- 0.64% ✗
- Cap rate
- 3.96%
- Cash-on-cash
- -8.32%
- DSCR
- 0.63
- GRM
- 13.0
CMA / ARV
No comps found within radius.
Projected returns pro-forma
10.0% appreciation · 3.0% rent growth · sell at horizon
- IRR
- 18.4%
- Equity multiple
- 2.50×
- Total profit
- $197,288
- Equity at exit
- $422,053
- IRR
- 17.2%
- Equity multiple
- 5.78×
- Total profit
- $626,683
- Equity at exit
- $910,173
Cash invested: $131,177 (down + closing). Projections, not guarantees.
Landlord ↔ Tenant lean methodology
- Overall (STATE)
- 83 Strongly Landlord-Friendly
- State Oklahoma
- 83 Strongly Landlord-Friendly · R+20
- County
- — inherits STATE
- City
- — inherits STATE
ZIP-level market 73007
- Home prices YoY
- 4.0%
- Active inventory
- 192
- Price-to-rent
- 13.0×
Monthly cashflow live
- Estimated rent
- $3,000 medium interval (Pro) →
- Mortgage (P&I)
- −$2,457
- Tax est. 1.5%
- −$586 /mo · $7,027/yr
- Insurance
- −$195
- HOA
- −$42
- Vacancy / Maint / Mgmt
- −$630
- Net cashflow
- $-910
Break-even live
UW: 25.0% down · 7.5% · 30yr · 1.5% tax · 5.0% vac · 8.0% maint · 8.0% mgmt
Financing live
Cash to close
- Down payment
- $117,122
- Closing costs
- $14,055
- Reserves months
- —
- Total cash needed
- —
Loan-product check · same deal, 3 products live
Conventional
25% down · 7.5% · 30yr
- Down + closing
- —
- Monthly P&I
- —
- Monthly cashflow
- —
- DSCR
- —
- Eligible?
- —
Personal DTI + credit; lowest rate.
DSCR
20% down · 8.5% · 30yr
- Down + closing
- —
- Monthly P&I
- —
- Monthly cashflow
- —
- DSCR
- —
- Eligible?
- —
No personal income docs; deal must DSCR.
Hard money
10% down · 12.0% · 12mo
- Down + closing
- —
- Monthly P&I
- —
- Monthly cashflow
- —
- DSCR
- —
- Eligible?
- —
Short-term bridge; refi at stabilization.
Rent comps 1 comps
| Address | Beds | Baths | Sqft | Rent | $/sqft | DOM | Units | Dist |
|---|---|---|---|---|---|---|---|---|
| 600 Dardanelle Pass Edmond, OK | 5.0 | 3.0 | 2822 | $3,000 | $1.06 | 11d | 1 | 1.22mi |
HOA detail
- Monthly dues
- $42 · $504/yr
- Likely covers
- trash
Listing history 15 events
-
2026-06-18days on market $468,490 Active 134 DOM
-
2026-06-17days on market $468,490 Active 133 DOM
-
2026-06-16days on market $468,490 Active 132 DOM
-
2026-06-15days on market $468,490 Active 131 DOM
-
2026-06-13days on market $468,490 Active 129 DOM
-
2026-06-09days on market $468,490 Active 125 DOM
-
2026-06-08days on market $468,490 Active 124 DOM
-
2026-06-07days on market $468,490 Active 123 DOM
-
2026-06-03days on market $468,490 Active 119 DOM
-
2026-06-02days on market $468,490 Active 118 DOM
-
2026-06-01days on market $468,490 Active 117 DOM
-
2026-05-31days on market $468,490 Active 116 DOM
-
2026-04-29price $468,490
-
2026-02-25price $466,990
-
2026-02-04$468,990 Active
ⓘ Source: listings_history table (triggers on properties + properties_extension) + one-shot
backfill from property_details.listing_events for pre-trigger history.
Nearby sold comps map
Loading sold comps map…
Walkable amenities ~0.75 mi
Loading nearby amenities…
Taxation est. · year 1
- Rental income
- $36,000
- − Mortgage interest
- −$26,243
- − Property taxes
- −$7,027
- − Insurance
- −$2,342
- − Repairs & maintenance
- −$2,880
- − Management
- −$2,880
- − HOA
- −$504
- − Depreciation
- −$13,629
- Taxable loss
- −$19,505
- Est. tax savings @ 24.0%
- +$4,681
- After-tax cash flow
- $-6,234/yr
For passive investors: Depreciation is non-cash, so a rental often shows a tax loss while cash-flowing — sheltering income. Rental losses are passive: they offset passive income freely, and up to $25,000/yr can offset ordinary (W-2) income if you actively participate and your MAGI is under $100k (phasing out to $0 by $150k); unused losses carry forward. On sale, claimed depreciation is recaptured at up to 25%, and gains may owe capital-gains tax (a 1031 exchange can defer both). Figures are a year-1 estimate at your 24.0% rate — not tax advice; consult a CPA.
Schools (NCES district)
- District
- Edmond
- NCES district ID
- 4010590
- Math proficiency
- 38% ▼ -12.00%
- Reading proficiency
- 40% ▼ -12.00%
- Median HH income
- $73,212
- Composite
- 35.88/100
- National rank
- #4814
- State rank
- #11 of 270 in OK
Livability — Edmond
- Score
- 78/100
- State rank
- #6
- US rank
- #2383
Category grades
Schools grade is shown separately in the Schools card above.
Census & demographics
- Census place
- Edmond, OK
- City population
- 177,083
- Population (ZIP)
- 2,945
Population outlook (Oklahoma County) Hauer SSP2
- Today (2025)
- 911,875 people
- By 2030
- 982,413 · +7.7%
- By 2040
- 1,130,468 · +24.0%
- By 2050
- 1,288,422 · +41.3%
- By 2075
- 1,711,482 · +87.7%
- By 2100
- 2,088,448 · +129.0%
Race, ethnicity, and origin ACS 2023
- Neighborhood character
- Predominantly White (80%)
- Race & ethnicity
- White 80% Two or more races 15% Hispanic / Latino 5% Black 2%
- Common ancestry
- Lithuanian 5% Romanian 3% Italian 2%
- Foreign-born
- 2% · Canada
- Languages at home
- 94% English-only · Spanish 2% Other Asian/Pacific 1%
Political lean MEDSL · Oklahoma
- 2024 margin
- Toss-up / Even · D 48.0% · R 49.7% · Other 2.3%
- 2008→2024 swing
- +15.1pp toward D · 2008: -16.8pp · 2024: -1.7pp
- All cycles
- 2024: R+1.7 2020: R+1.1 2016: R+10.5 2012: R+16.7 2008: R+16.8
Not yet ingested
- Civics
- —
Market trends
- HPI YoY
- ▲ 12.99%
- Current HPI
- 336.6015
- Rent YoY
- —
- Metro
- —
- State GDP YoY
- ▲ 1.55%
- F500 in state
- 6
Industry mix (Fortune 500 HQ in OK)
| Industry | F500 HQs | Revenue |
|---|---|---|
| Energy | 3 | $48B |
|
||
Price history
-0.1% since first listed3 events — show timeline
- 2026-04-29 Price Changed $468,490 MLSOK
- 2026-02-25 Price Changed $466,990 MLSOK
- 2026-02-04 Listed $468,990 MLSOK
Cash-flow waterfall
monthlySold comps — $/sqft
last 12 mo · ≤1 miLoading sold comps…