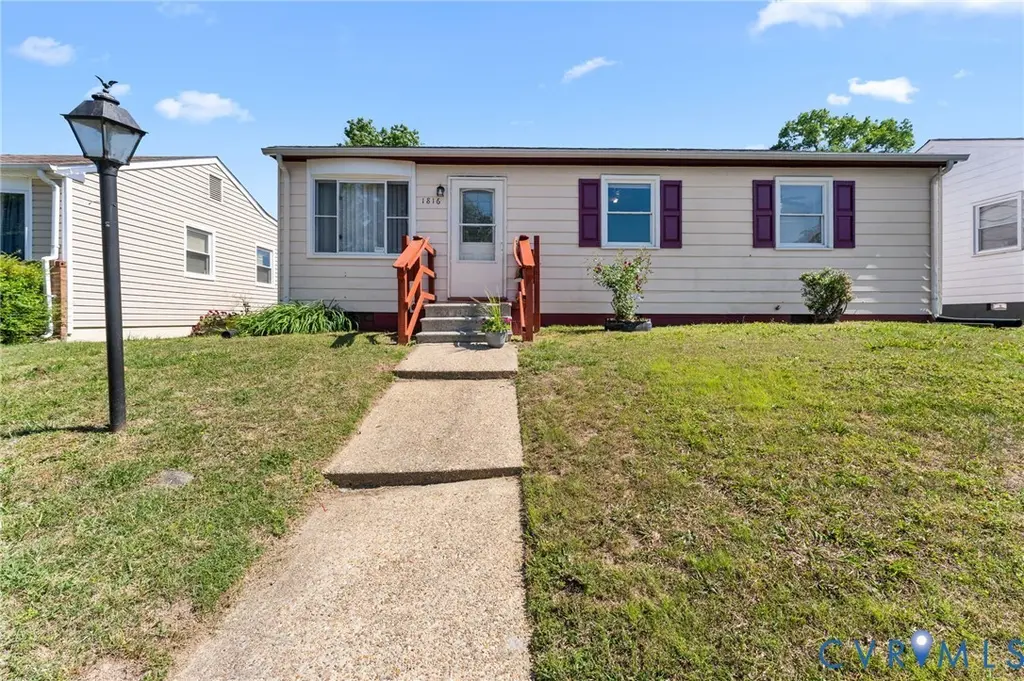
1816 Dublin St · Hopewell, VA
Flood risk 1/10 · Minimal
- FEMA flood zone
- X (unshaded)
- Chance of flooding over 30 yrs
- 0.0%
- Est. flood insurance / yr
- $507 – $1,088
Fire risk 3/10 · Minor
- Est. fire insurance / yr
- $666 – $1,236
Heat risk 8/10 · Major
- Hot days now (above 110°F)
- 7 days/yr
- Hot days in 30 yrs
- 17 days/yr
Wind risk 6/10 · Moderate
- Chance of severe wind over 30 yrs
- 42.0%
Air-quality risk 2/10 · Minimal
- Unhealthy air days now
- 1 days/yr
- Unhealthy air days in 30 yrs
- 2 days/yr
Risk factors via First Street. Map © Google.
Why this score? — see what drove the D grade
The composite is a weighted blend of 9 inputs, each scored 0–100. Each bar is that input's sub-score; the figure is the points it added to the 100-point composite (weight × sub-score).
- Cash flow +12.3/30.0
- ARV discount +10.1/15.0
- Rent growth +4.7/5.0
- DSCR +3.6/10.0
- Livability +3.5/5.0
- Schools +3.0/10.0
- 1% rule +2.6/10.0
- Condition / age +2.5/5.0
- Appreciation +0.0/10.0
$199,000
🖨 Deal sheet (PDF) 📄 Offer letter ✓ Due diligence
Listing remarks
Move-In Ready and Full of Charm! Step inside this beautifully updated 3-bedroom, 1-bath home that perfectly blends comfort and style. You’ll love the warmth of the refinished hardwood floors and the bright, updated kitchen designed for everyday living. The home features a brand-new roof, newer HVAC system, and energy-efficient vinyl windows, giving you peace of mind for years to come. Enjoy meals in the separate dining area and the convenience of a dedicated laundry room. This home checks all the boxes — move-in ready, well cared for, and full of character!
Key facts
- Brand-new roof
- Updated kitchen
- Newer hvac system
Tags
Property features AI
Exterior
- Utilities: Public water; Public sewer
- Home design: Single-story home; Resale property
- Construction: Built with aluminum siding, block, frame and drywall; Composition roof
- Exterior features: Public water; Public sewer; Zoned R3
Interior
- Kitchen: Laminate counters
- Bedrooms: Bedroom located on the main level
- Flooring: Vinyl flooring; Wood flooring
- Bathrooms: 1 full bathroom with tub & shower (first level)
- Heating & cooling: Electric heating; Central air conditioning; Heat pump
- Interior features: Bedroom on main level; Dining area; Laminate counters; Crawl space basement
- Laundry & utility: Electric water heater
Neighborhood map
What this means for you Summary
Snapshot
- This is a 3-bed/1.0-bath single-family listed at $199k.
Deal economics
- At list price, monthly cash flow is $-37 ($-442/yr) — negative.
- To cash-flow at today's rent, offer at most $192k (3.3% below list).
- To meet the 1% rule (rent ≥ 1% of price), the offer needs to be $151k (23.9% below list).
- Recommended offer: $151k (23.9% below list) — sets the bar for 1% rule.
- Cap rate 6.1% vs local median 4.2% in Hopewell — top-decile yield for the area; either an underpriced asset or a hidden risk that comps aren't pricing in. Stress-test before assuming the spread holds.
Location & tenants
- Location reads 70/100 on livability (#224 in VA) — a middle-class / working-renter tenant base. Strengths: cost of living A+, health & safety A+, housing A-; Watch: crime D+, amenities F, commute F.
- Hopewell City Public School District (suburban): math 23% / reading 49% proficiency, ranked #129 of 131 in VA (top 98%) — families likely to look elsewhere, expect single-tenant / working-renter base with shorter leases; 68% free/reduced lunch — lower-income household profile, screen leases tightly.
- Zoned schools: Dupont Elementary (math 17% / reading 37%, grade F, #1,029 of 1,108 statewide, top 94%, 632 students, 104% FRL); Carter G. Woodson Middle (math 22% / reading 51%, grade F, #320 of 342 statewide, top 95%, 826 students, 102% FRL); Hopewell High (math 37% / reading 72%, grade C-, #281 of 319 statewide, top 90%, 1,136 students, 102% FRL) — zoned schools average 103% FRL vs 68% district-wide (35 pts higher); higher-poverty schools than district average — tighter screening recommended.
- Market conditions: Rents rising fast (+8.9%/yr); 234 active listings in the ZIP; 27 comparable units currently listed for rent nearby; rentals at typical pace (median 23d on market — plan ~3-4 weeks tenant-placement turnaround); 42 units permitted in Hopewell city in 2024 (0 in 5+ unit buildings).
Forward outlook
- Local home prices are declining (-3.0%/yr); year-one equity from $1k of loan paydown is wiped out by about $6k of value loss. Plan a longer hold.
- Hopewell County population projected to shrink 7% by 2050 — rents likely to lag national; underwrite the cash flow, not the appreciation.
Negotiation context
- It's been on market 45 days — a 3% lower offer ($193k) is reasonable based on typical stale-listing flexibility.
- 7 sale attempts since 19y ago; this cycle's ask has dropped $16k (7%) from the opening price — seller is motivated, your offer sets the floor, not the list.
- Current owner paid $46k; list at $199k implies a 331% gain — meaningful room to come down on a strong offer.
Risks & watch-outs
- Climate carrying-cost: major wind risk, 42% chance of damaging wind over 30y; extreme-heat days projected 7→17/yr by 2055 (HVAC capex compounding) — expect insurance premiums to compound above CPI over the hold.
Questions for the listing agent
- What do current leases actually rent for vs. the listed asking? Can we see a recent rent roll and the last 12 months of T-12 income?
- It's been on market 45 days. Have you received any prior offers? Is the seller open to a 24% concession, seller financing, or rate buy-down credit?
- Built in 1970 — when were the roof, HVAC, electrical panel, plumbing, and water heater last replaced?
- Is there a deadline driving the sale (1031 exchange, divorce, estate, relocation)? That informs how much negotiation room exists.
- Schools are A-rated — typically a magnet for longer-tenancy family renters. What's the average tenant stay here, and is there a school-zone premium baked into asking?
- Crime grade is D in this area — have there been break-ins, vandalism, or insurance claims at this property in the last 3 years? What carrier currently insures it and at what premium?
- The area grade is low — what's the realistic commute time and amenity access for the typical tenant pool here? Any planned neighborhood developments (good or bad) we should know about?
- What's the average days-on-market for RENTAL listings here right now (not sales)? A rising rental-DOM trend means longer vacancies and softer asking-rent achievability than the comps imply.
- What's the recent tenant-quality profile in this submarket — average credit score on applications, eviction rate, late-payment / NSF rate, and stable-employment percentage? A property-management company in the area should have these aggregated.
- How much new for-sale + rental construction is in the pipeline within 1–3 miles? Heavy new supply typically softens prices + rents 12–24 months out; constrained supply supports both.
Investment metrics
- 1% rule
- 0.76% ✗
- Cap rate
- 6.07%
- Cash-on-cash
- -0.79%
- DSCR
- 0.96
- GRM
- 10.9
CMA / ARV
- ARV (median comp)
- $211,428
- List price
- $199,000
- Delta
- -5.88%
- Verdict
- FAIR
- Comps
- 20 within 1.0 mi
Show comp detail 12 sales within ~0.75 mi
| Address | Dist | Beds/Ba | Sqft | Sold | Price | $/sf | Match |
|---|---|---|---|---|---|---|---|
| 1802 Freeman St | 0.14mi | 3/1.5 | 1,008 (+0%) | 4mo | $220,000 | $218 | 87 |
| 2005 Dublin St | 0.10mi | 3/2.0 | 1,040 (+4%) | 5mo | $235,000 | $226 | 81 |
| 1125 Salem Ave | 0.18mi | 3/2.0 | 1,091 (+9%) | 5mo | $215,000 | $197 | 69 |
| 1602 Tabb Ave | 0.60mi | 3/1.0 | 968 (-4%) | 1mo | $220,000 | $227 | 66 |
| 1201 Stewart Ave | 0.64mi | 3/1.0 | 972 (-3%) | 2mo | $227,000 | $234 | 64 |
| 2405 Freeman St | 0.38mi | 3/1.0 | 1,093 (+9%) | 8mo | $100,000 | $91 | 61 |
| 1707 Arlington Rd | 0.55mi | 3/1.0 | 1,050 (+5%) | 7mo | $120,000 | $114 | 60 |
| 1105 Arlington Rd | 0.43mi | 3/2.0 | 1,080 (+8%) | 4mo | $219,950 | $204 | 60 |
| 1701 Arlington Rd | 0.54mi | 3/2.0 | 1,104 (+10%) | 2mo | $270,000 | $245 | 52 |
| 1110 Pine Ave | 0.54mi | 3/1.5 | 1,104 (+10%) | 10mo | $177,500 | $161 | 48 |
| 2708 Granby St | 0.70mi | 3/1.0 | 912 (-9%) | 9mo | $132,500 | $145 | 44 |
| 2102 Hazelwood Ave | 0.67mi | 3/1.5 | 1,098 (+10%) | 9mo | $221,000 | $201 | 43 |
Match score weights: distance 35% · size 25% · config 20% · recency 20%. Top-matched comps best support the ARV.
Projected returns pro-forma
-3.0% appreciation · 8.0% rent growth · sell at horizon
- IRR
- -12.7%
- Equity multiple
- 0.52×
- Total profit
- $-26,649
- Equity at exit
- $29,672
- IRR
- 2.1%
- Equity multiple
- 1.18×
- Total profit
- $9,954
- Equity at exit
- $17,206
Cash invested: $55,720 (down + closing). Projections, not guarantees.
Landlord ↔ Tenant lean methodology
- Overall (STATE)
- 55 Moderately Landlord-Leaning
- State Virginia
- 55 Moderately Landlord-Leaning · D+2
- County
- — inherits STATE
- City
- — inherits STATE
ZIP-level market 23860
- Home prices YoY
- -22.0%
- Rents YoY
- 8.9%
- Active inventory
- 234
- Price-to-rent
- 10.9×
Monthly cashflow live
- Estimated rent
- $1,515 high interval (Pro) →
- Mortgage (P&I)
- −$1,044
- Tax from tax record
- −$107 /mo · $1,285/yr
- Insurance
- −$83
- HOA
- −$0
- Vacancy / Maint / Mgmt
- −$318
- Net cashflow
- $-37
Break-even live
Sensitivity live
| Price | -10% $76 | -5% $20 | +0% $-37 | +5% $-93 | +10% $-149 |
|---|---|---|---|---|---|
| Rent | -10% $-156 | -5% $-97 | +0% $-37 | +5% $23 | +10% $83 |
| Rate | -1.0pp $63 | -0.5pp $14 | base $-37 | +0.5pp $-88 | +1.0pp $-141 |
UW: 25.0% down · 7.5% · 30yr · 1.5% tax · 5.0% vac · 8.0% maint · 8.0% mgmt
Financing live
Cash to close
- Down payment
- $49,750
- Closing costs
- $5,970
- Reserves months
- —
- Total cash needed
- —
Loan-product check · same deal, 3 products live
Conventional
25% down · 7.5% · 30yr
- Down + closing
- —
- Monthly P&I
- —
- Monthly cashflow
- —
- DSCR
- —
- Eligible?
- —
Personal DTI + credit; lowest rate.
DSCR
20% down · 8.5% · 30yr
- Down + closing
- —
- Monthly P&I
- —
- Monthly cashflow
- —
- DSCR
- —
- Eligible?
- —
No personal income docs; deal must DSCR.
Hard money
10% down · 12.0% · 12mo
- Down + closing
- —
- Monthly P&I
- —
- Monthly cashflow
- —
- DSCR
- —
- Eligible?
- —
Short-term bridge; refi at stabilization.
Rent comps 27 comps
| Address | Beds | Baths | Sqft | Rent | $/sqft | DOM | Units | Dist |
|---|---|---|---|---|---|---|---|---|
| 2303 Maclin Cir Hopewell, VA | 3.0 | 2.0 | 1150 | $1,499 | $1.30 | 5d | 1 | 0.32mi |
| 600 Winston Churchill Dr Hopewell, VA | 2.0 | 1.0 | 900 | $1,075 | $1.19 | 3d | 1 | 0.37mi |
| 460 Highland Ave Hopewell, VA | 3.0 | 1.0 | 1212 | $1,700 | $1.40 | 21d | 1 | 0.58mi |
| 800 Chestnut St Hopewell, VA | 2.0 | 1.0 | 884 | $1,395 | $1.58 | 45d | 1 | 0.59mi |
| 1206 Tabb Ave Hopewell, VA | 3.0 | 1.0 | 974 | $1,470 | $1.51 | 45d | 1 | 0.63mi |
| 2305 Poplar St Unit B Hopewell, VA | 2.0 | 1.5 | 959 | $1,050 | $1.09 | 25d | 1 | 0.63mi |
| 1900 Arlington Rd Hopewell, VA | 3.0 | 2.0 | 1216 | $1,695 | $1.39 | 45d | 1 | 0.71mi |
| 1004 Sunnyside Ave Hopewell, VA | 4.0 | 2.0 | 875 | $1,737 | $1.99 | 6d | 1 | 0.81mi |
| 522 S 22nd Ave Hopewell, VA | 3.0 | 2.0 | 1368 | $1,800 | $1.32 | 25d | 1 | 0.86mi |
| 305 S 9th Ave Hopewell, VA | 4.0 | 1.0 | 1056 | $1,599 | $1.51 | 5d | 1 | 0.87mi |
| 552 S 22nd Ave Hopewell, VA | 3.0 | 2.0 | 1368 | $1,800 | $1.32 | 25d | 1 | 0.89mi |
| 507 Hill Ave Hopewell, VA | 3.0 | 1.0 | 932 | $1,395 | $1.50 | 25d | 1 | 0.96mi |
| 101 S Main St Unit 1 Hopewell, VA | 2.0 | 2.0 | 800 | $1,395 | $1.74 | 6d | 1 | 1.10mi |
| 1201 W City Point Rd Hopewell, VA | 1.0–2.0 | 1.0–1.5 | 710 | $1,250 | $1.76 | 16d | 3 | 1.17mi |
| 1201 W City Point Rd Hopewell, VA | 1.0–2.0 | 1.0–1.5 | 711 | $1,250 | $1.76 | 3d | 7 | 1.17mi |
| 3309 Carlisle Ave Hopewell, VA | 3.0 | 1.0 | 1152 | $1,395 | $1.21 | 23d | 1 | 1.23mi |
| 3314 Granby St Hopewell, VA | 3.0 | 1.0 | 1469 | $1,600 | $1.09 | 25d | 1 | 1.24mi |
| 2009 Day St Hopewell, VA | 2.0 | 1.0 | 780 | $895 | $1.15 | 25d | 1 | 1.26mi |
| 3200 Saint Charles St Hopewell, VA | 3.0 | 1.5 | 1272 | $1,595 | $1.25 | 45d | 1 | 1.30mi |
| 1208 W Broadway Hopewell, VA | 3.0 | 1.0 | 1200 | $1,495 | $1.25 | 18d | 1 | 1.30mi |
| 404 N 4th Ave Hopewell, VA | 3.0 | 1.0 | 1132 | $1,495 | $1.32 | 45d | 1 | 1.34mi |
| 311 E Cawson St Hopewell, VA | 2.0–3.0 | 1.0 | 978 | $2,154 | $2.20 | 3d | 9 | 1.41mi |
| 221 S Mesa Dr Hopewell, VA | 3.0 | 1.0 | 1152 | $1,300 | $1.13 | 25d | 1 | 1.45mi |
| 508 N 7th Ave Hopewell, VA | 4.0 | 1.0 | 1183 | $1,599 | $1.35 | 3d | 1 | 1.45mi |
| 3500 Oaklawn Blvd Hopewell, VA | 3.0 | 1.0 | 1000 | $1,650 | $1.65 | 19d | 1 | 1.46mi |
| 3502 Oaklawn Blvd Hopewell, VA | 3.0 | 1.0 | 1124 | $1,850 | $1.65 | 23d | 1 | 1.47mi |
| 3568 Perrins Hill Way Prince George, VA | 3.0 | 2.5 | 1500 | $2,200 | $1.47 | 3d | 1 | 1.47mi |
Listing history 27 events
-
2026-06-21days on market $199,000 Active 45 DOM
-
2026-06-19price $199,000 Active 42 DOM
-
2026-06-18days on market $215,000 Active 42 DOM
-
2026-06-17days on market $215,000 Active 41 DOM
-
2026-06-16days on market $215,000 Active 40 DOM
-
2026-06-15days on market $215,000 Active 39 DOM
-
2026-06-13days on market $215,000 Active 37 DOM
-
2026-06-09days on market $215,000 Active 33 DOM
-
2026-06-08days on market $215,000 Active 32 DOM
-
2026-06-07days on market $215,000 Active 31 DOM
-
2026-06-03days on market $215,000 Active 27 DOM
-
2026-06-02days on market $215,000 Active 26 DOM
-
2026-06-01days on market $215,000 Active 25 DOM
-
2026-05-31days on market $215,000 Active 24 DOM
-
2026-05-07$215,000 Active 576-char remark
-
2025-12-15status Active
-
2025-12-01$215,000 Active
-
2025-11-04historical
-
2009-09-22historical
-
2007-12-29historical
-
2007-11-12historical
-
2007-11-09historical
-
2007-11-08$109,950
-
2007-11-08$109,950
-
2007-06-26$109,950
-
2007-06-26$109,950
-
2007-03-15soldstatus $46,200
ⓘ Source: listings_history table (triggers on properties + properties_extension) + one-shot
backfill from property_details.listing_events for pre-trigger history.
Tax reassessment forecast VA · Resets to sale price
- Current annual tax
- $1,285 · $107/mo
- Projected year-2 tax
- $1,632 · $136/mo
- Expected delta
- +$347/yr (+$29/mo · 27.0%)
ⓘ Screening estimate from a state-policy table — verify with the county assessor before closing.
Climate risk First Street
- Flood 1/10 Low FEMA zone X (unshaded) · 0% chance over 30 yrs
- Wildfire 3/10 Moderate
- Heat 8/10 Severe 7 d/yr ≥110°F today · 17 d/yr by 30 yrs out
- Wind 6/10 Major 42% chance of damaging wind over 30 yrs
- Air quality 2/10 Low 1 unhealthy d/yr today · 2 by 30 yrs out
Nearby sold comps map
Loading sold comps map…
Walkable amenities ~0.75 mi
Loading nearby amenities…
Taxation est. · year 1
- Rental income
- $18,179
- − Mortgage interest
- −$11,147
- − Property taxes
- −$1,285
- − Insurance
- −$995
- − Repairs & maintenance
- −$1,454
- − Management
- −$1,454
- − Depreciation
- −$5,789
- Taxable loss
- −$3,946
- Est. tax savings @ 24.0%
- +$947
- After-tax cash flow
- $505/yr
For passive investors: Depreciation is non-cash, so a rental often shows a tax loss while cash-flowing — sheltering income. Rental losses are passive: they offset passive income freely, and up to $25,000/yr can offset ordinary (W-2) income if you actively participate and your MAGI is under $100k (phasing out to $0 by $150k); unused losses carry forward. On sale, claimed depreciation is recaptured at up to 25%, and gains may owe capital-gains tax (a 1031 exchange can defer both). Figures are a year-1 estimate at your 24.0% rate — not tax advice; consult a CPA.
Schools (NCES district)
- District
- Hopewell City Public School District
- NCES district ID
- 5101980
- Math proficiency
- 23% ▼ -54.00%
- Reading proficiency
- 49% ▼ -18.00%
- Median HH income
- $38,234
- Composite
- 29.95/100
- National rank
- #6377
- State rank
- #129 of 131 in VA
Livability — Hopewell
- Score
- 70/100
- State rank
- #224
- US rank
- #7437
Category grades
Schools grade is shown separately in the Schools card above.
Census & demographics
- Census place
- Hopewell, VA
- County
- Hopewell City · 31,404 people
- City population
- 31,404
- Metro
- Richmond, VA
- Population (ZIP)
- 31,404
- Household income
- $62,141
- Rent vs Own
- Severe rent burden
- 1055.0
Population outlook (Hopewell County) Hauer SSP2
- Today (2025)
- 21,776 people
- By 2030
- 21,457 · -1.5%
- By 2040
- 20,882 · -4.1%
- By 2050
- 20,239 · -7.1%
- By 2075
- 18,905 · -13.2%
- By 2100
- 16,949 · -22.2%
Race, ethnicity, and origin ACS 2023
- Neighborhood character
- Diverse neighborhood (Simpson 0.64)
- Race & ethnicity
- White 43% Black 42% Two or more races 9% Hispanic / Latino 8% Asian 1%
- Hispanic origin (detail)
- Mexican 2% Puerto Rican 2%
- Common ancestry
- Slovak 1% Romanian 1% Serbian 1%
- Foreign-born
- 3% · Canada
- Languages at home
- 94% English-only · Spanish 4% German/W. Germanic 1%
Political lean MEDSL · Hopewell
- 2024 margin
- D (+13.8) · D 56.4% · R 42.6% · Other 1.0%
- 2008→2024 swing
- +1.8pp toward D · 2008: 11.9pp · 2024: 13.8pp
- All cycles
- 2024: D+13.8 2020: D+14.7 2016: D+9.3 2012: D+16.0 2008: D+11.9
Not yet ingested
- Civics
- —
Market trends
- HPI YoY
- ▼ -85.28%
- Current HPI
- 302.6343
- Rent YoY
- ▲ 8.86%
- Metro
- Richmond, VA
- State GDP YoY
- ▲ 2.40%
- F500 in state
- 50
Industry mix (Fortune 500 HQ in VA)
| Industry | F500 HQs | Revenue |
|---|---|---|
| Aerospace / Defense | 4 | $236B |
|
||
| Technology / Defense | 3 | $32B |
|
||
| Financial Services | 2 | $176B |
|
||
| Utilities | 2 | $27B |
|
||
| Insurance | 2 | $25B |
|
||
| Technology | 2 | $15B |
|
||
Price history
+365.4% since first listed13 events — show timeline
- 2026-05-07 Listed $215,000 CVRMLS
- 2025-12-15 Relisted — CVRMLS
- 2025-12-01 Listed $215,000 CVRMLS
- 2025-11-04 Coming Soon — CVRMLS
- 2009-09-22 Listing Removed — CVRMLS
- 2007-12-29 Listing Removed — CVRMLS
- 2007-11-12 Listing Removed — CVRMLS
- 2007-11-09 Listing Removed — CVRMLS
- 2007-11-08 Listed $109,950 CVRMLS
- 2007-11-08 Listed $109,950 CVRMLS
- 2007-06-26 Listed $109,950 CVRMLS
- 2007-06-26 Listed $109,950 CVRMLS
- 2007-03-15 Sold (Public Records) $46,200 Public Records
Property tax history
+5.4%/yrLatest (2025): $1,285 · +6.3% YoY. Source: county tax records.
Cash-flow waterfall
monthlySold comps — $/sqft
last 12 mo · ≤1 miLoading sold comps…