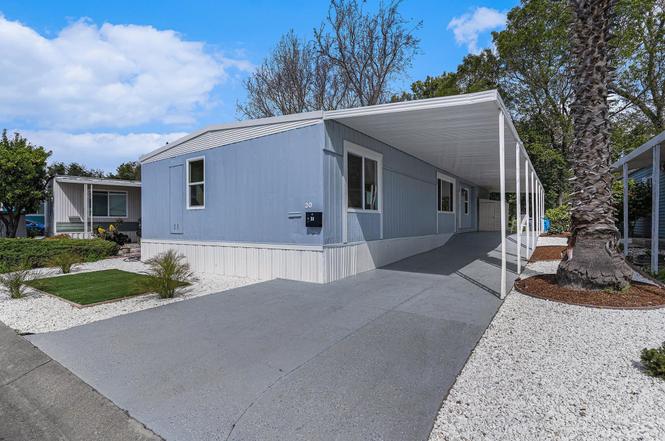
30 Palm Dr #30 · Union City, CA
Flood risk 3/10 · Minor
- FEMA flood zone
- X (unshaded)
- Chance of flooding over 30 yrs
- 0.18%
- Est. flood insurance / yr
- $507 – $1,088
Fire risk 1/10 · Minimal
- Est. fire insurance / yr
- $659 – $1,223
Heat risk 4/10 · Minor
- Hot days now (above 90°F)
- 7 days/yr
- Hot days in 30 yrs
- 14 days/yr
Wind risk 1/10 · Minimal
- Chance of severe wind over 30 yrs
- —
Air-quality risk 7/10 · Major
- Unhealthy air days now
- 12 days/yr
- Unhealthy air days in 30 yrs
- 12 days/yr
Risk factors via First Street. Map © Google.
Why this score? — see what drove the B+ grade
The composite is a weighted blend of 9 inputs, each scored 0–100. Each bar is that input's sub-score; the figure is the points it added to the 100-point composite (weight × sub-score).
- Cash flow +28.2/30.0
- ARV discount +15.0/15.0
- DSCR +10.0/10.0
- 1% rule +7.8/10.0
- Schools +5.1/10.0
- Livability +3.7/5.0
- Rent growth +3.4/5.0
- Condition / age +2.5/5.0
- Appreciation +0.0/10.0
$299,888
🖨 Deal sheet (PDF) 📄 Offer letter ✓ Due diligence
Listing remarks
Welcome to 30 Palm Drive, a delightful 4-bedroom, 2-bathroom remodeled home in sought after The Tropics premier 55+ active adult community. This inviting residence features dual-paned windows for energy efficiency, new floors and an updated kitchen with newer appliances. New HVAC energy efficient unit, new interior and exterior paint, new plumbing, extensive Interior upgrades: Sheet rocked & Textured Ceilings for a modern feel with recessed lights. , New Doors with new hardware, New Awnings and much more. All work performed with permits. Offers an open Floor Plan with a living room, formal dining area, brand new kitchen with soft close cabinets, kitchen open to utility room to exterio
Key facts
- New plumbing
- New hvac unit
- Energy efficiency
Tags
Neighborhood map
What this means for you Summary
Snapshot
- This is a 4-bed/2.0-bath manufactured listed at $300k.
Deal economics
- At list price, monthly cash flow is $954 ($11k/yr) — positive.
- The deal already cash-flows at list — no discount required.
- Meets the 1% rule at list price ($4k rent vs $300k).
- Recommended offer: $291k (3.0% below list) — sets the bar for market timing.
- Cap rate 10.1% vs local median 1.7% in Union City — top-decile yield for the area; either an underpriced asset or a hidden risk that comps aren't pricing in. Stress-test before assuming the spread holds.
Location & tenants
- Location reads 73/100 on livability (#150 in CA) — a middle-class / working-renter tenant base. Strengths: commute A+, employment A+, health & safety A+; Watch: crime D, amenities D, cost of living F.
- New Haven Unified (suburban): math 43% / reading 69% proficiency, ranked #85 of 517 in CA (top 16%) — acceptable for families but not a draw, mixed tenant base, ~2y average lease.
- Zoned schools: Tom Kitayama Elementary (615 students, 34% FRL); Cesar Chavez Middle (1,012 students, 49% FRL); James Logan High (math 46% / reading 71%, grade C, #223 of 1,170 statewide, top 19%, 3,315 students, 38% FRL) — zoned schools at 40% FRL track the district average.
- Market conditions: Rents rising (+3.5%/yr); 150 active listings in the ZIP; 15 comparable units currently listed for rent nearby; rentals leasing fast (median 6d on market — plan ~1-2 weeks tenant-placement turnaround); high-income renter base; 1,742 units permitted in Alameda County in 2024 (856 in 5+ unit buildings).
- This rent runs 34% of the median local income ($134k/yr) — at the standard rent-burdened threshold; future hikes will face affordability resistance.
Forward outlook
- Local home prices are declining (-3.0%/yr); year-one equity from $2k of loan paydown is wiped out by about $9k of value loss. Plan a longer hold.
- Alameda County population projected at +34% by 2050 — long-run rental-demand tailwind backs the buy-and-hold thesis.
- At projected returns (-3.0% appreciation + 3.5% rent growth), your $84k cash investment doubles in ~9 years — after that, you're playing with house money.
Negotiation context
- It's been on market 35 days — a 3% lower offer ($291k) is reasonable based on typical stale-listing flexibility.
- 3 sale attempts since 28y ago with the ask held roughly flat each time — persistent listings suggest the price (not the market) is what's stuck; bring a comps-based counter.
Questions for the listing agent
- It's been on market 35 days. Have you received any prior offers? Is the seller open to a 3% concession, seller financing, or rate buy-down credit?
- Is there a deadline driving the sale (1031 exchange, divorce, estate, relocation)? That informs how much negotiation room exists.
- Schools are B-rated — typically a magnet for longer-tenancy family renters. What's the average tenant stay here, and is there a school-zone premium baked into asking?
- Crime grade is D in this area — have there been break-ins, vandalism, or insurance claims at this property in the last 3 years? What carrier currently insures it and at what premium?
- What's the average days-on-market for RENTAL listings here right now (not sales)? A rising rental-DOM trend means longer vacancies and softer asking-rent achievability than the comps imply.
- What's the recent tenant-quality profile in this submarket — average credit score on applications, eviction rate, late-payment / NSF rate, and stable-employment percentage? A property-management company in the area should have these aggregated.
- How much new for-sale + rental construction is in the pipeline within 1–3 miles? Heavy new supply typically softens prices + rents 12–24 months out; constrained supply supports both.
Investment metrics
- 1% rule
- 1.28% ✓
- Cap rate
- 10.11%
- Cash-on-cash
- 13.63%
- DSCR
- 1.61
- GRM
- 6.5
CMA / ARV
- ARV (on-the-fly)
- $401,760
- Comps found
- 4
Show comp detail 4 sales within ~0.75 mi
| Address | Dist | Beds/Ba | Sqft | Sold | Price | $/sf | Match |
|---|---|---|---|---|---|---|---|
| 17 Palm Dr | 0.07mi | 3/2.0 (-1) | 1,368 (-5%) | 3mo | $200,000 | $146 | 81 |
| 174 Kona Cir | 0.19mi | 3/2.0 (-1) | 1,532 (+6%) | 12mo | $428,000 | $279 | 66 |
| 289 Maui Cir | 0.21mi | 3/2.0 (-1) | 1,541 (+7%) | 12mo | $432,500 | $281 | 64 |
| 222 Hula Cir #222 | 0.08mi | 3/2.0 (-1) | 1,620 (+12%) | 12mo | $390,000 | $241 | 61 |
Match score weights: distance 35% · size 25% · config 20% · recency 20%. Top-matched comps best support the ARV.
Projected returns pro-forma
-3.0% appreciation · 3.49% rent growth · sell at horizon
- IRR
- 4.3%
- Equity multiple
- 1.17×
- Total profit
- $14,114
- Equity at exit
- $44,714
- IRR
- 14.3%
- Equity multiple
- 2.17×
- Total profit
- $98,620
- Equity at exit
- $25,929
Cash invested: $83,969 (down + closing). Projections, not guarantees.
Landlord ↔ Tenant lean methodology
- Overall (STATE)
- 18 Strongly Tenant-Friendly
- State California
- 18 Strongly Tenant-Friendly · D+13
- County
- — inherits STATE
- City
- — inherits STATE
ZIP-level market 94587
- Rents YoY
- 3.5%
- Active inventory
- 150
- Price-to-rent
- 6.5×
Monthly cashflow live
- Estimated rent
- $3,831 high interval (Pro) →
- Mortgage (P&I)
- −$1,573
- Tax est. 1.5%
- −$375 /mo · $4,498/yr
- Insurance
- −$125
- HOA
- −$0
- Vacancy / Maint / Mgmt
- −$804
- Net cashflow
- $954
Break-even live
Sensitivity live
| Price | -10% $1,161 | -5% $1,058 | +0% $954 | +5% $850 | +10% $747 |
|---|---|---|---|---|---|
| Rent | -10% $651 | -5% $803 | +0% $954 | +5% $1,105 | +10% $1,257 |
| Rate | -1.0pp $1,105 | -0.5pp $1,030 | base $954 | +0.5pp $876 | +1.0pp $797 |
UW: 25.0% down · 7.5% · 30yr · 1.5% tax · 5.0% vac · 8.0% maint · 8.0% mgmt
Financing live
Cash to close
- Down payment
- $74,972
- Closing costs
- $8,997
- Reserves months
- —
- Total cash needed
- —
Loan-product check · same deal, 3 products live
Conventional
25% down · 7.5% · 30yr
- Down + closing
- —
- Monthly P&I
- —
- Monthly cashflow
- —
- DSCR
- —
- Eligible?
- —
Personal DTI + credit; lowest rate.
DSCR
20% down · 8.5% · 30yr
- Down + closing
- —
- Monthly P&I
- —
- Monthly cashflow
- —
- DSCR
- —
- Eligible?
- —
No personal income docs; deal must DSCR.
Hard money
10% down · 12.0% · 12mo
- Down + closing
- —
- Monthly P&I
- —
- Monthly cashflow
- —
- DSCR
- —
- Eligible?
- —
Short-term bridge; refi at stabilization.
Rent comps 15 comps
| Address | Beds | Baths | Sqft | Rent | $/sqft | DOM | Units | Dist |
|---|---|---|---|---|---|---|---|---|
| 3842 Cardinal Ter Fremont, CA | 3.0 | 2.5 | 1607 | $4,100 | $2.55 | 20d | 1 | 0.56mi |
| 2262 Eric Ct #4 Union City, CA | 3.0 | 1.5 | 1003 | $3,400 | $3.39 | 5d | 1 | 0.58mi |
| 3716 Harlequin Ter Fremont, CA | 4.0 | 2.5 | 1855 | $4,500 | $2.43 | 45d | 1 | 0.58mi |
| 34426 Bentley Pl Fremont, CA | 3.0 | 2.0 | 1290 | $3,500 | $2.71 | 22d | 1 | 0.93mi |
| 2449 Almaden Blvd Union City, CA | 3.0 | 2.0 | 1565 | $4,495 | $2.87 | 3d | 1 | 0.94mi |
| 4123 Asimuth Cir Union City, CA | 3.0 | 1.5 | 1280 | $3,350 | $2.62 | 45d | 1 | 1.03mi |
| 4292 Comet Cir Union City, CA | 3.0 | 1.5 | 1250 | $2,950 | $2.36 | 26d | 1 | 1.14mi |
| 4132 Jamaica Ter Fremont, CA | 3.0 | 1.5 | 1166 | $2,890 | $2.48 | 0d | 1 | 1.20mi |
| 4163 Rainbow Ter Fremont, CA | 4.0 | 2.5 | 1474 | $3,695 | $2.51 | 0d | 1 | 1.20mi |
| 3307 San Marco Ct Union City, CA | 3.0 | 2.0 | 1349 | $3,900 | $2.89 | 4d | 1 | 1.34mi |
| 3221 San Carlos Way Union City, CA | 3.0 | 2.0 | 1396 | $3,795 | $2.72 | 5d | 1 | 1.37mi |
| 34655 Skylark Dr Union City, CA | 1.0–3.0 | 1.0–2.0 | 886 | $2,793 | $3.15 | 0d | 4 | 1.40mi |
| 1037 Stone St Union City, CA | 3.0 | 2.0 | 1583 | $4,350 | $2.75 | 25d | 1 | 1.41mi |
| 4806 Balthazar Ter Fremont, CA | 3.0 | 3.0 | 1755 | $4,250 | $2.42 | 0d | 1 | 1.42mi |
| 33016 Carrara Ter Union City, CA | 4.0 | 2.5 | 1650 | $3,750 | $2.27 | 7d | 1 | 1.44mi |
Listing history 7 events
-
2026-02-05status Pending
-
2026-01-01$299,888 Active
-
2025-12-12historical
-
2025-11-28price
-
2025-07-01Active
-
1999-02-22soldstatus
-
1998-12-31$49,950
ⓘ Source: listings_history table (triggers on properties + properties_extension) + one-shot
backfill from property_details.listing_events for pre-trigger history.
Climate risk First Street
- Flood 3/10 Moderate FEMA zone X (unshaded) · 18% chance over 30 yrs
- Wildfire 1/10 Low
- Heat 4/10 Moderate 7 d/yr ≥90°F today · 14 d/yr by 30 yrs out
- Wind 1/10 Low
- Air quality 7/10 Severe 12 unhealthy d/yr today · 12 by 30 yrs out
Nearby sold comps map
Loading sold comps map…
Walkable amenities ~0.75 mi
Loading nearby amenities…
Taxation est. · year 1
- Rental income
- $45,970
- − Mortgage interest
- −$16,798
- − Property taxes
- −$4,498
- − Insurance
- −$1,499
- − Repairs & maintenance
- −$3,678
- − Management
- −$3,678
- − Depreciation
- −$8,724
- Taxable income
- $7,094
- Est. tax owed @ 24.0%
- −$1,703
- After-tax cash flow
- $9,744/yr
For passive investors: Depreciation is non-cash, so a rental often shows a tax loss while cash-flowing — sheltering income. Rental losses are passive: they offset passive income freely, and up to $25,000/yr can offset ordinary (W-2) income if you actively participate and your MAGI is under $100k (phasing out to $0 by $150k); unused losses carry forward. On sale, claimed depreciation is recaptured at up to 25%, and gains may owe capital-gains tax (a 1031 exchange can defer both). Figures are a year-1 estimate at your 24.0% rate — not tax advice; consult a CPA.
Schools (NCES district)
- District
- New Haven Unified
- NCES district ID
- 0626910
- Math proficiency
- 43% ▲ 1.00%
- Reading proficiency
- 69% ▲ 18.00%
- Median HH income
- $87,202
- Composite
- 51.21/100
- National rank
- #1754
- State rank
- #85 of 517 in CA
Livability — Union City
- Score
- 73/100
- State rank
- #150
- US rank
- #5027
Category grades
Schools grade is shown separately in the Schools card above.
Census & demographics
- Census place
- Union City, CA
- County
- Alameda County · 1,614,355 people
- City population
- 67,464
- Metro
- San Francisco-Oakland-Berkeley, CA
- Population (ZIP)
- 67,464
- Household income
- $133,715
- Rent vs Own
- Severe rent burden
- 1565.0
Population outlook (Alameda County) Hauer SSP2
- Today (2025)
- 1,928,884 people
- By 2030
- 2,069,146 · +7.3%
- By 2040
- 2,338,405 · +21.2%
- By 2050
- 2,586,608 · +34.1%
- By 2075
- 3,061,911 · +58.7%
- By 2100
- 3,234,133 · +67.7%
Race, ethnicity, and origin ACS 2023
- Neighborhood character
- Diverse neighborhood (Simpson 0.63)
- Race & ethnicity
- Asian 55% Hispanic / Latino 19% White 15% Two or more races 10% Black 5%
- Hispanic origin (detail)
- Mexican 16%
- Common ancestry
- Russian 1% Slovak 1%
- Foreign-born
- 47% · China, Canada, Vietnam
- Languages at home
- 39% English-only · Spanish 13% Other Indo-European 13% Tagalog/Filipino 12%
Political lean MEDSL · Alameda
- 2024 margin
- Solid D (+53.6) · D 74.6% · R 21.0% · Other 4.4%
- 2008→2024 swing
- -5.9pp toward R · 2008: 59.5pp · 2024: 53.6pp
- All cycles
- 2024: D+53.6 2020: D+62.5 2016: D+64.4 2012: D+59.8 2008: D+59.5
Not yet ingested
- Civics
- —
Market trends
- HPI YoY
- ▼ -1280.49%
- Current HPI
- 343.0333
- Rent YoY
- ▲ 3.49%
- Metro
- San Francisco-Oakland-Berkeley, CA
- State GDP YoY
- ▲ 3.21%
- F500 in state
- 116
Industry mix (Fortune 500 HQ in CA)
| Industry | F500 HQs | Revenue |
|---|---|---|
| Technology | 27 | $1,492B |
|
||
| Financial Services | 3 | $174B |
|
||
| Retail | 3 | $44B |
|
||
| Insurance | 3 | $26B |
|
||
| Media / Entertainment | 2 | $115B |
|
||
| Pharmaceuticals / Biotech | 2 | $62B |
|
||
Price history
+500.4% since first listed7 events — show timeline
- 2026-02-05 Pending — bridgeMLS, Bay East AOR, or Contra Costa AOR
- 2026-01-01 Listed $299,888 bridgeMLS, Bay East AOR, or Contra Costa AOR
- 2025-12-12 Listing Removed — bridgeMLS, Bay East AOR, or Contra Costa AOR
- 2025-11-28 Price Changed — bridgeMLS, Bay East AOR, or Contra Costa AOR
- 2025-07-01 Listed — bridgeMLS, Bay East AOR, or Contra Costa AOR
- 1999-02-22 Sold (MLS) — bridgeMLS, Bay East AOR, or Contra Costa AOR
- 1998-12-31 Listed $49,950 bridgeMLS, Bay East AOR, or Contra Costa AOR
Cash-flow waterfall
monthlySold comps — $/sqft
last 12 mo · ≤1 miLoading sold comps…