 🏗️ New Construction
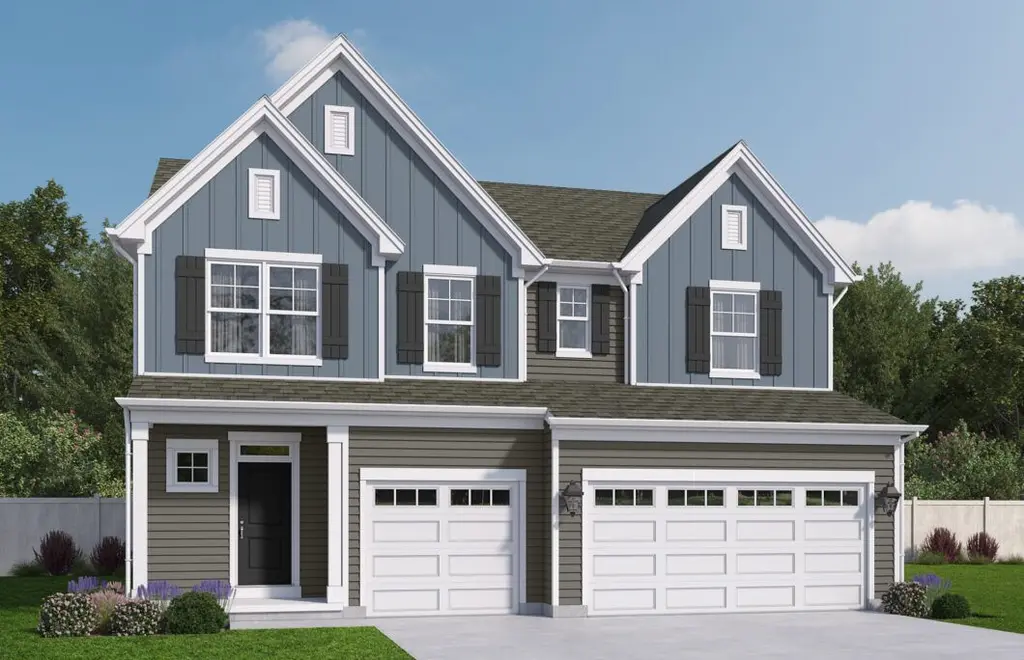
Caraway Plan · Miami Heights, OH
Flood risk No data
- FEMA flood zone
- —
- Chance of flooding over 30 yrs
- —
- Est. flood insurance / yr
- —
Fire risk No data
- Est. fire insurance / yr
- —
Heat risk No data
- Hot days now (above threshold)
- —
- Hot days in 30 yrs
- —
Wind risk No data
- Chance of severe wind over 30 yrs
- —
Air-quality risk No data
- Unhealthy air days now
- —
- Unhealthy air days in 30 yrs
- —
Risk factors via First Street. Map © Google.
Why this score? — see what drove the D grade
The composite is a weighted blend of 9 inputs, each scored 0–100. Each bar is that input's sub-score; the figure is the points it added to the 100-point composite (weight × sub-score).
- Cash flow +14.0/30.0
- ARV discount +7.5/15.0
- Schools +5.3/10.0
- DSCR +4.2/10.0
- 1% rule +3.9/10.0
- Livability +3.2/5.0
- Rent growth +2.5/5.0
- Condition / age +1.0/5.0
- Appreciation +0.0/10.0
$449,000
🖨 Deal sheet (PDF) 📄 Offer letter ✓ Due diligence
Listing remarks
The Caraway offers spacious, upscale living in a beautifully designed new construction home, perfect for families seeking more room and modern amenities in Carlisle, Wilmington, West Chester Township and Trenton. With 4 bedrooms, 2.5 baths, and 2,680 square feet, this plan delivers the ideal balance of openness and functionality. The main floor boasts 9-foot ceilings and an impressive 3-car garage, providing ample storage for active households. The open kitchen features a large island and walk-in pantry and flows seamlessly into the expansive great room, making it ideal for entertaining and everyday living. Optional features such as a fireplace and transom windows allow buyers to personaliz
Key facts
- Pocket office
- Grand bedroom
- Walk-in shower
Tags
Property features AI
Finance
- Other: Address: 8770 Silver Bell Trl, Cleves OH 45002; Inventory type: Plan
- Financial info: Listing status: Active; List price: 449000
Exterior
- Parking: 3-car garage / 3 total parking spaces
- Home design: Single-family plan (Caraway)
- Exterior features: Living area approximately 2680
Interior
- Bedrooms: 4 bedrooms
- Bathrooms: 2 full bathrooms and 1 half bathroom
- Interior features: Plan model: Caraway
Neighborhood map
What this means for you Summary
Snapshot
- This is a 4-bed/2.5-bath single-family listed at $449k. Condition is rated poor.
Deal economics
- At list price, monthly cash flow is $62 ($741/yr) — positive.
- The deal already cash-flows at list — no discount required.
- Meets the 1% rule at list price ($4k rent vs $449k).
- Recommended offer: $436k (3.0% below list) — sets the bar for market timing.
- Cap rate 6.4% vs local median 3.5% in Miami Heights — top-decile yield for the area; either an underpriced asset or a hidden risk that comps aren't pricing in. Stress-test before assuming the spread holds.
Location & tenants
- Location reads 65/100 on livability (#752 in OH) — a middle-class / working-renter tenant base. Strengths: crime A+, employment A+, housing A+; Watch: amenities F, commute F, health & safety F.
- Three Rivers Local (rural): math 58% / reading 61% proficiency, ranked #256 of 656 in OH (top 39%) — acceptable for families but not a draw, mixed tenant base, ~2y average lease.
- Zoned schools: Three Rivers Elementary (math 65% / reading 52%, grade B-, #708 of 1,584 statewide, top 45%, 793 students, 35% FRL); Taylor Middle School (math 54% / reading 65%, grade B, #271 of 654 statewide, top 43%, 665 students, 40% FRL); Taylor High School (math 24% / reading 67%, grade D-, #463 of 781 statewide, top 59%, 644 students, 32% FRL) — zoned schools at 36% FRL track the district average.
- Market conditions: 68 active listings in the ZIP; 1 comparable units currently listed for rent nearby; solid renter incomes; 801 units permitted in Hamilton County in 2024 (190 in 5+ unit buildings).
- At $4,500/mo this rent would consume 64% of the median local household income ($85k/yr) — very limited rent-growth headroom before tenants either downsize or default.
Forward outlook
- Local home prices are declining (-3.0%/yr); year-one equity from $3k of loan paydown is wiped out by about $15k of value loss. Plan a longer hold.
Negotiation context
- It's been on market 48 days — a 3% lower offer ($436k) is reasonable based on typical stale-listing flexibility.
Questions for the listing agent
- It's been on market 48 days. Have you received any prior offers? Is the seller open to a 3% concession, seller financing, or rate buy-down credit?
- Have any recent inspections been done? Can we get a copy of the seller's disclosures and any deferred-maintenance estimates?
- Is there a deadline driving the sale (1031 exchange, divorce, estate, relocation)? That informs how much negotiation room exists.
- Schools are D-rated, which usually means shorter tenancies and higher turnover. Who's the typical renter profile here, and what's been the actual vacancy rate?
- The area grade is low — what's the realistic commute time and amenity access for the typical tenant pool here? Any planned neighborhood developments (good or bad) we should know about?
- What's the average days-on-market for RENTAL listings here right now (not sales)? A rising rental-DOM trend means longer vacancies and softer asking-rent achievability than the comps imply.
- What's the recent tenant-quality profile in this submarket — average credit score on applications, eviction rate, late-payment / NSF rate, and stable-employment percentage? A property-management company in the area should have these aggregated.
- How much new for-sale + rental construction is in the pipeline within 1–3 miles? Heavy new supply typically softens prices + rents 12–24 months out; constrained supply supports both.
Investment metrics
- 1% rule
- 0.89% ✗
- Cap rate
- 6.44%
- Cash-on-cash
- 0.52%
- DSCR
- 1.02
- GRM
- 9.4
CMA / ARV
- ARV (median comp)
- $505,478
- List price
- $449,000
- Delta
- -11.17%
- Verdict
- UNDERPRICED
- Comps
- 20 within 1.0 mi
Show comp detail 12 sales within ~0.75 mi
| Address | Dist | Beds/Ba | Sqft | Sold | Price | $/sf | Match |
|---|---|---|---|---|---|---|---|
| 191 Edgefield Dr | 0.23mi | 4/2.5 | 2,839 (+6%) | 8mo | $500,000 | $176 | 72 |
| 106 Reids Way | 0.18mi | 4/3.5 | 2,915 (+9%) | 8mo | $500,000 | $172 | 66 |
| 8708 Quietwood Ln | 0.22mi | 4/3.5 | 3,040 (+13%) | 2mo | $467,000 | $154 | 61 |
| 4011 Bremen Pass | 0.34mi | 4/3.5 | 2,362 (-12%) | 3mo | $490,000 | $207 | 58 |
| 605 Coleberry Ct | 0.59mi | 4/3.0 | 2,778 (+4%) | 10mo | $450,000 | $162 | 56 |
| 3891 Haley Ln | 0.73mi | 4/2.5 | 2,832 (+6%) | 3mo | $506,000 | $179 | 54 |
| 583 Laurelwood Dr | 0.68mi | 4/3.5 | 2,700 (+1%) | 12mo | $500,000 | $185 | 53 |
| 511 Laurelwood Dr | 0.54mi | 4/2.5 | 2,485 (-7%) | 13mo | $433,000 | $174 | 52 |
| 587 Laurelwood Dr | 0.69mi | 4/2.5 | 2,790 (+4%) | 12mo | $465,000 | $167 | 51 |
| 3894 Bremen Pass | 0.54mi | 4/3.0 | 2,333 (-13%) | 2mo | $445,000 | $191 | 50 |
| 3796 Bremen Pass | 0.68mi | 4/3.0 | 2,578 (-4%) | 14mo | $512,000 | $199 | 48 |
| 702 Rosewynne Ct | 0.54mi | 4/3.5 | 3,064 (+14%) | 5mo | $450,000 | $147 | 42 |
Match score weights: distance 35% · size 25% · config 20% · recency 20%. Top-matched comps best support the ARV.
Projected returns pro-forma
-3.0% appreciation · 3.0% rent growth · sell at horizon
- IRR
- -15.5%
- Equity multiple
- 0.45×
- Total profit
- $-77,908
- Equity at exit
- $75,368
- IRR
- -6.9%
- Equity multiple
- 0.56×
- Total profit
- $-62,500
- Equity at exit
- $43,704
Cash invested: $141,534 (down + closing). Projections, not guarantees.
Landlord ↔ Tenant lean methodology
- Overall (STATE)
- 73 Landlord-Friendly
- State Ohio
- 73 Landlord-Friendly · R+6
- County
- — inherits STATE
- City
- — inherits STATE
ZIP-level market 45002
- Home prices YoY
- -28.9%
- Active inventory
- 68
- Price-to-rent
- 8.3×
Monthly cashflow live
- Estimated rent
- $4,500 medium interval (Pro) →
- Mortgage (P&I)
- −$2,651
- Tax est. 1.5%
- −$632 /mo · $7,582/yr
- Insurance
- −$211
- HOA
- −$0
- Vacancy / Maint / Mgmt
- −$945
- Net cashflow
- $62
Break-even live
Sensitivity live
| Price | -10% $411 | -5% $236 | +0% $62 | +5% $-113 | +10% $-288 |
|---|---|---|---|---|---|
| Rent | -10% $-294 | -5% $-116 | +0% $62 | +5% $240 | +10% $417 |
| Rate | -1.0pp $316 | -0.5pp $190 | base $62 | +0.5pp $-69 | +1.0pp $-202 |
UW: 25.0% down · 7.5% · 30yr · 1.5% tax · 5.0% vac · 8.0% maint · 8.0% mgmt
Financing live
Cash to close
- Down payment
- $126,369
- Closing costs
- $15,164
- Reserves months
- —
- Total cash needed
- —
Loan-product check · same deal, 3 products live
Conventional
25% down · 7.5% · 30yr
- Down + closing
- —
- Monthly P&I
- —
- Monthly cashflow
- —
- DSCR
- —
- Eligible?
- —
Personal DTI + credit; lowest rate.
DSCR
20% down · 8.5% · 30yr
- Down + closing
- —
- Monthly P&I
- —
- Monthly cashflow
- —
- DSCR
- —
- Eligible?
- —
No personal income docs; deal must DSCR.
Hard money
10% down · 12.0% · 12mo
- Down + closing
- —
- Monthly P&I
- —
- Monthly cashflow
- —
- DSCR
- —
- Eligible?
- —
Short-term bridge; refi at stabilization.
Rent comps 1 comps
| Address | Beds | Baths | Sqft | Rent | $/sqft | DOM | Units | Dist |
|---|---|---|---|---|---|---|---|---|
| 8705 Quietwood Ln Cleves, OH | 4.0 | 2.5 | 3708 | $4,500 | $1.21 | 45d | 1 | 0.23mi |
Listing history 17 events
-
2026-06-21days on market $449,000 Active 48 DOM
-
2026-06-21days on market $449,000 Active 47 DOM
-
2026-06-18days on market $449,000 Active 45 DOM
-
2026-06-17days on market $449,000 Active 44 DOM
-
2026-06-16days on market $449,000 Active 43 DOM
-
2026-06-15days on market $449,000 Active 42 DOM
-
2026-06-13days on market $449,000 Active 40 DOM
-
2026-06-12days on market $449,000 Active 39 DOM
-
2026-06-09days on market $449,000 Active 36 DOM
-
2026-06-08days on market $449,000 Active 35 DOM
-
2026-06-08days on market $449,000 Active 34 DOM
-
2026-06-04days on market $449,000 Active 30 DOM
-
2026-06-02days on market $449,000 Active 29 DOM
-
2026-06-01days on market $449,000 Active 28 DOM
-
2026-05-31days on market $449,000 Active 27 DOM
-
2026-05-06price $449,000 1178-char remark
-
2026-05-04$448,300 Active 1178-char remark
ⓘ Source: listings_history table (triggers on properties + properties_extension) + one-shot
backfill from property_details.listing_events for pre-trigger history.
Nearby sold comps map
Loading sold comps map…
Walkable amenities ~0.75 mi
Loading nearby amenities…
Taxation est. · year 1
- Rental income
- $54,000
- − Mortgage interest
- −$28,315
- − Property taxes
- −$7,582
- − Insurance
- −$2,527
- − Repairs & maintenance
- −$4,320
- − Management
- −$4,320
- − Depreciation
- −$14,705
- Taxable loss
- −$7,769
- Est. tax savings @ 24.0%
- +$1,865
- After-tax cash flow
- $2,606/yr
For passive investors: Depreciation is non-cash, so a rental often shows a tax loss while cash-flowing — sheltering income. Rental losses are passive: they offset passive income freely, and up to $25,000/yr can offset ordinary (W-2) income if you actively participate and your MAGI is under $100k (phasing out to $0 by $150k); unused losses carry forward. On sale, claimed depreciation is recaptured at up to 25%, and gains may owe capital-gains tax (a 1031 exchange can defer both). Figures are a year-1 estimate at your 24.0% rate — not tax advice; consult a CPA.
Condition & rehab AI · 2 photos
This home requires extensive repairs and maintenance, including roof, exterior siding, and landscaping. Immediate action is needed to improve its condition and increase its value.
Repairs flagged
- Major roof — Significant damage and potential leaks.
- Major exterior siding — Severe wear and peeling paint.
- Major interior walls/paint — No visible condition assessment, but likely in poor condition based on exterior.
- Major landscaping — Sparse and in need of maintenance.
- Major HVAC/mechanicals — No visible condition assessment, but likely in poor condition based on exterior.
- Major foundation/structure — No visible condition assessment, but likely in poor condition based on exterior.
Value-add opportunities
- Both roof repair — Fixing the roof will address a major issue and improve both resale and rental value.
- Both exterior siding repair — Repairing the siding will improve the home's curb appeal and increase its value.
- Both painting — Painting the exterior will improve the home's appearance and increase its value.
- Both landscaping — Improving the landscaping will enhance the home's curb appeal and increase its value.
- Both HVAC/mechanical upgrades — Upgrading the HVAC system will improve comfort and energy efficiency, increasing both resale and rental value.
Renovation cost estimate screening
| Repair item | Severity | Est. cost |
|---|---|---|
| roof · Significant damage and potential leaks. | Major | $15,000–50,000 |
| exterior siding · Severe wear and peeling paint. | Major | $15,000–50,000 |
| interior walls/paint · No visible condition assessment, but likely in poor condition based on exterior. | Major | $15,000–50,000 |
| landscaping · Sparse and in need of maintenance. | Major | $15,000–50,000 |
| HVAC/mechanicals · No visible condition assessment, but likely in poor condition based on exterior. | Major | $15,000–50,000 |
| foundation/structure · No visible condition assessment, but likely in poor condition based on exterior. | Major | $15,000–50,000 |
| Total estimated repair cost · 6 items | $90,000–300,000 |
Value-add ROI direction
- Both roof repair — Fixing the roof will address a major issue and improve both resale and rental value. ↑
- Both exterior siding repair — Repairing the siding will improve the home's curb appeal and increase its value. ↑
- Both painting — Painting the exterior will improve the home's appearance and increase its value. ↑
- Both landscaping — Improving the landscaping will enhance the home's curb appeal and increase its value. ↑
- Both HVAC/mechanical upgrades — Upgrading the HVAC system will improve comfort and energy efficiency, increasing both resale and rental value. ↑
ⓘ Cost ranges are severity-bucket heuristics (US national rule-of-thumb). Get contractor quotes + a written scope before underwriting a rehab budget.
Schools (NCES district)
- District
- Three Rivers Local
- NCES district ID
- 3904739
- Math proficiency
- 58% ▼ -9.00%
- Reading proficiency
- 61% ▼ -10.00%
- Median HH income
- $72,973
- Composite
- 52.85/100
- National rank
- #1533
- State rank
- #256 of 656 in OH
Livability — Miami Heights
- Score
- 65/100
- State rank
- #752
- US rank
- #13562
Category grades
Schools grade is shown separately in the Schools card above.
Census & demographics
- Census place
- Miami Heights, OH
- County
- Hamilton · 838,887 people
- Metro
- Cincinnati, OH-KY-IN
- Population (ZIP)
- 14,647
- Household income
- $84,597
- Rent vs Own
- Severe rent burden
- 12.0
Population outlook (Hamilton County) Hauer SSP2
- Today (2025)
- 826,054 people
- By 2030
- 830,947 · +0.6%
- By 2040
- 832,319 · +0.8%
- By 2050
- 822,428 · -0.4%
- By 2075
- 788,688 · -4.5%
- By 2100
- 710,674 · -14.0%
Race, ethnicity, and origin ACS 2023
- Neighborhood character
- Predominantly White (93%)
- Race & ethnicity
- White 93% Two or more races 6% Hispanic / Latino 2%
- Common ancestry
- Romanian 2% Slovak 2% Italian 2%
- Foreign-born
- 1%
- Languages at home
- 98% English-only · Spanish 1%
Political lean MEDSL · Hamilton
- 2024 margin
- D (+14.9) · D 57.0% · R 42.1%
- 2008→2024 swing
- +7.9pp toward D · 2008: 7.0pp · 2024: 14.9pp
- All cycles
- 2024: D+14.9 2020: D+15.9 2016: D+9.5 2012: D+4.9 2008: D+7.0
Not yet ingested
- Civics
- —
Market trends
- HPI YoY
- ▼ -85.62%
- Current HPI
- 210.9397
- Rent YoY
- —
- Metro
- —
- State GDP YoY
- ▲ 1.98%
- F500 in state
- 48
Industry mix (Fortune 500 HQ in OH)
| Industry | F500 HQs | Revenue |
|---|---|---|
| Insurance | 3 | $145B |
|
||
| Industrial Machinery | 3 | $49B |
|
||
| Financial Services | 3 | $24B |
|
||
| Consumer Goods | 2 | $93B |
|
||
| Aerospace / Defense | 2 | $47B |
|
||
| Utilities | 2 | $33B |
|
||
Cash-flow waterfall
monthlySold comps — $/sqft
last 12 mo · ≤1 miLoading sold comps…