 24-Plex
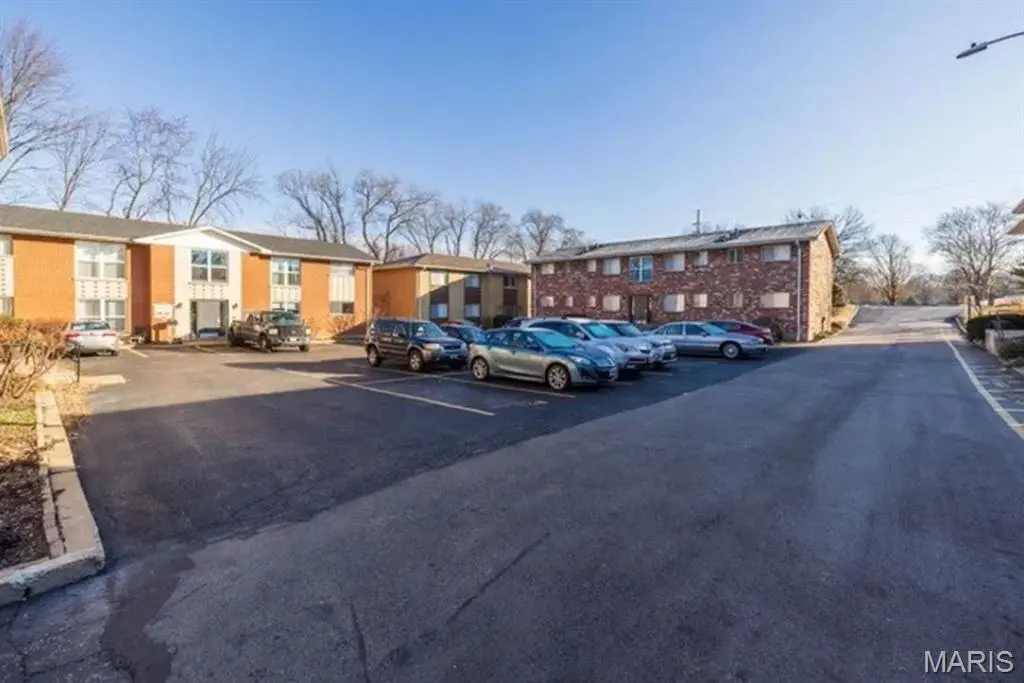
9310 Shirley Gardens Dr · St. John, MO
Flood risk 1/10 · Minimal
- FEMA flood zone
- X (unshaded)
- Chance of flooding over 30 yrs
- 0.0%
- Est. flood insurance / yr
- $507 – $1,088
Fire risk 1/10 · Minimal
- Est. fire insurance / yr
- $1,054 – $1,958
Heat risk 5/10 · Moderate
- Hot days now (above 106°F)
- 7 days/yr
- Hot days in 30 yrs
- 22 days/yr
Wind risk 2/10 · Minimal
- Chance of severe wind over 30 yrs
- 1.0%
Air-quality risk 2/10 · Minimal
- Unhealthy air days now
- 1 days/yr
- Unhealthy air days in 30 yrs
- 3 days/yr
Risk factors via First Street. Map © Google.
Why this score? — see what drove the C grade
The composite is a weighted blend of 9 inputs, each scored 0–100. Each bar is that input's sub-score; the figure is the points it added to the 100-point composite (weight × sub-score).
- Cash flow +25.2/30.0
- DSCR +8.3/10.0
- ARV discount +7.5/15.0
- 1% rule +6.6/10.0
- Rent growth +3.0/5.0
- Livability +2.5/5.0
- Condition / age +2.5/5.0
- Schools +1.7/10.0
- Appreciation +0.0/10.0
$2,399,999
🖨 Deal sheet 📄 Offer letter ✓ Due diligence
Multi-family units
County records classify this as Multi-Family (5+ Unit). Listing-text estimate: 24 units. confirmed
5+ unit building — per-unit beds/baths from public records are typically unavailable; the breakdown below (if shown) is an estimate from the listing text.
Listing remarks MLS
Exceptional opportunity to acquire a well-maintained 24-unit multifamily community in St. John. This property offers an idea unit mix consisting of 24 spacious 2-bedroom, 1-bathroom units. Each unit features a large living room, an eat-in kitchen, and two generously sized bedrooms, providing comfortable and functional layouts that appeal to long-term tenants. The units have been consistently maintained and the property is in great shape for the next buyer. The property also has washer and dryer hookups and additional storage in the basement for tenant use. Current rents are below market, presenting a clear value-add opportunity for the next investor to increase cash flow. With a strong history of rental demand and being fully occupied, 2-bedroom units and limited availability in this area, this asset offers both stability and upside potential.
Key facts
- Large living room
- Eat-in kitchen
- Additional storage
Tags
Neighborhood map
What this means for you Summary
Snapshot
- This is a 24 × 2-bed/1-bath units multifamily listed at $2.40M.
Deal economics
- At list price, monthly cash flow is $5k ($65k/yr) — positive. Per door: $225/mo.
- The deal already cash-flows at list — no discount required.
- Meets the 1% rule at list price ($28k rent vs $2.40M).
- Recommended offer: $2.26M (6.0% below list) — sets the bar for market timing.
Location & tenants
- Location reads: area grade C — affects rentability + tenant quality, not the cash-flow math above.
- Ritenour (suburban): math 13% / reading 27% proficiency, ranked #304 of 324 in MO (top 94%) — low school quality limits family demand, transient renter base, plan for 1-2y turnover; 66% free/reduced lunch — lower-income household profile, screen leases tightly.
- Market conditions: Rents rising (+2.0%/yr); 118 active listings in the ZIP; 1 comparable units currently listed for rent nearby; 920 units permitted in St. Louis County in 2024 (250 in 5+ unit buildings).
- At $27,823/mo this rent would consume 598% of the median local household income ($56k/yr) (locally 1595% of renters already pay >50% of income on rent) — very limited rent-growth headroom before tenants either downsize or default.
Forward outlook
- Local home prices are declining (-3.0%/yr); year-one equity from $17k of loan paydown is wiped out by about $72k of value loss. Plan a longer hold.
Negotiation context
- It's been on market 77 days — a 6% lower offer ($2.26M) is reasonable based on typical stale-listing flexibility.
- 10 sale attempts since 3y ago with the ask held roughly flat each time — persistent listings suggest the price (not the market) is what's stuck; bring a comps-based counter.
- Current owner paid $720k; list at $2.40M implies a 233% gain — meaningful room to come down on a strong offer.
Risks & watch-outs
- Climate carrying-cost: extreme-heat days projected 7→22/yr by 2055 (HVAC capex compounding) — expect insurance premiums to compound above CPI over the hold.
Questions for the listing agent
- It's been on market 77 days. Have you received any prior offers? Is the seller open to a 6% concession, seller financing, or rate buy-down credit?
- Can we see the unit-by-unit rent roll, current vacancy, and any below-market leases? What's the average tenancy length?
- What capital expenditures (roof, boiler, parking lot, exteriors) have been made in the last 5 years, and what's planned in the next 2?
- Built in 1960 — when were the roof, HVAC, electrical panel, plumbing, and water heater last replaced?
- Why hasn't it sold? Are there any deal-killer items the seller is aware of (foundation, flood, title, zoning, code violations)?
- Is there a deadline driving the sale (1031 exchange, divorce, estate, relocation)? That informs how much negotiation room exists.
- What's the average days-on-market for RENTAL listings here right now (not sales)? A rising rental-DOM trend means longer vacancies and softer asking-rent achievability than the comps imply.
- What's the recent tenant-quality profile in this submarket — average credit score on applications, eviction rate, late-payment / NSF rate, and stable-employment percentage? A property-management company in the area should have these aggregated.
- How much new apartment / multifamily construction is in the pipeline within 1–3 miles? Heavy new supply (>2% of stock underway) typically softens rents 12–24 months out; light construction supports rent growth.
Investment metrics
- 1% rule
- 1.16% ✓
- Cap rate
- 8.99%
- Cash-on-cash
- 9.63%
- DSCR
- 1.43
- GRM
- 7.2
CMA / ARV
No comps found within radius.
Projected returns pro-forma
-3.0% appreciation · 2.04% rent growth · sell at horizon
- IRR
- -2.9%
- Equity multiple
- 0.89×
- Total profit
- $-71,538
- Equity at exit
- $357,848
- IRR
- 5.8%
- Equity multiple
- 1.41×
- Total profit
- $274,662
- Equity at exit
- $207,508
Cash invested: $672,000 (down + closing). Projections, not guarantees.
Landlord ↔ Tenant lean methodology
- Overall (STATE)
- 81 Strongly Landlord-Friendly
- State Missouri
- 81 Strongly Landlord-Friendly · R+10
- County
- — inherits STATE
- City
- — inherits STATE
ZIP-level market 63114
- Rents YoY
- 2.0%
- Active inventory
- 118
- Price-to-rent
- 172.5×
Monthly cashflow live
- Estimated rent
- $27,823 medium interval (Pro) →
- Mortgage (P&I)
- −$12,586
- Tax est. 1.5%
- −$3,000 /mo · $36,000/yr
- Insurance
- −$1,000
- HOA
- −$0
- Vacancy / Maint / Mgmt
- −$5,843
- Net cashflow
- $5,394
Break-even live
24-unit breakdown (identical units grouped — click to expand)
| Units | Beds | Baths | Est. rent |
|---|---|---|---|
| 24× units | 2 | 1 | $27,816 |
| #1 | 2 | 1 | $1,159 |
| #2 | 2 | 1 | $1,159 |
| #3 | 2 | 1 | $1,159 |
| #4 | 2 | 1 | $1,159 |
| #5 | 2 | 1 | $1,159 |
| #6 | 2 | 1 | $1,159 |
| #7 | 2 | 1 | $1,159 |
| #8 | 2 | 1 | $1,159 |
| #9 | 2 | 1 | $1,159 |
| #10 | 2 | 1 | $1,159 |
| #11 | 2 | 1 | $1,159 |
| #12 | 2 | 1 | $1,159 |
| #13 | 2 | 1 | $1,159 |
| #14 | 2 | 1 | $1,159 |
| #15 | 2 | 1 | $1,159 |
| #16 | 2 | 1 | $1,159 |
| #17 | 2 | 1 | $1,159 |
| #18 | 2 | 1 | $1,159 |
| #19 | 2 | 1 | $1,159 |
| #20 | 2 | 1 | $1,159 |
| #21 | 2 | 1 | $1,159 |
| #22 | 2 | 1 | $1,159 |
| #23 | 2 | 1 | $1,159 |
| #24 | 2 | 1 | $1,159 |
| Total (24 units) | $27,823 | ||
UW: 25.0% down · 7.5% · 30yr · 1.5% tax · 5.0% vac · 8.0% maint · 8.0% mgmt
Financing live
Cash to close
- Down payment
- $600,000
- Closing costs
- $72,000
- Reserves months
- —
- Total cash needed
- —
Loan-product check · same deal, 3 products live
Conventional
25% down · 7.5% · 30yr
- Down + closing
- —
- Monthly P&I
- —
- Monthly cashflow
- —
- DSCR
- —
- Eligible?
- —
Personal DTI + credit; lowest rate.
DSCR
20% down · 8.5% · 30yr
- Down + closing
- —
- Monthly P&I
- —
- Monthly cashflow
- —
- DSCR
- —
- Eligible?
- —
No personal income docs; deal must DSCR.
Hard money
10% down · 12.0% · 12mo
- Down + closing
- —
- Monthly P&I
- —
- Monthly cashflow
- —
- DSCR
- —
- Eligible?
- —
Short-term bridge; refi at stabilization.
Rent comps 1 comps
| Address | Beds | Baths | Sqft | Rent | $/sqft | DOM | Units | Dist |
|---|---|---|---|---|---|---|---|---|
| 8634 Burton Ave St. Louis, MO | 2.0 | 1.0 | 5760 | $995 | $0.17 | 12d | 1 | 1.19mi |
Listing history 28 events
-
2026-05-17status Pending 855-char remark
Show marketing remark (855 chars)
Exceptional opportunity to acquire a well-maintained 24-unit multifamily community in St. John. This property offers an idea unit mix consisting of 24 spacious 2-bedroom, 1-bathroom units. Each unit features a large living room, an eat-in kitchen, and two generously sized bedrooms, providing comfortable and functional layouts that appeal to long-term tenants. The units have been consistently maintained and the property is in great shape for the next buyer. The property also has washer and dryer hookups and additional storage in the basement for tenant use. Current rents are below market, presenting a clear value-add opportunity for the next investor to increase cash flow. With a strong history of rental demand and being fully occupied, 2-bedroom units and limited availability in this area, this asset offers both stability and upside potential.
-
2026-04-21price $2,399,999 855-char remark
Show marketing remark (855 chars)
Exceptional opportunity to acquire a well-maintained 24-unit multifamily community in St. John. This property offers an idea unit mix consisting of 24 spacious 2-bedroom, 1-bathroom units. Each unit features a large living room, an eat-in kitchen, and two generously sized bedrooms, providing comfortable and functional layouts that appeal to long-term tenants. The units have been consistently maintained and the property is in great shape for the next buyer. The property also has washer and dryer hookups and additional storage in the basement for tenant use. Current rents are below market, presenting a clear value-add opportunity for the next investor to increase cash flow. With a strong history of rental demand and being fully occupied, 2-bedroom units and limited availability in this area, this asset offers both stability and upside potential.
-
2026-03-01$2,450,000 Active 855-char remark
Show marketing remark (855 chars)
Exceptional opportunity to acquire a well-maintained 24-unit multifamily community in St. John. This property offers an idea unit mix consisting of 24 spacious 2-bedroom, 1-bathroom units. Each unit features a large living room, an eat-in kitchen, and two generously sized bedrooms, providing comfortable and functional layouts that appeal to long-term tenants. The units have been consistently maintained and the property is in great shape for the next buyer. The property also has washer and dryer hookups and additional storage in the basement for tenant use. Current rents are below market, presenting a clear value-add opportunity for the next investor to increase cash flow. With a strong history of rental demand and being fully occupied, 2-bedroom units and limited availability in this area, this asset offers both stability and upside potential.
-
2025-08-22historical $1,000
-
2025-07-25$1,000
-
2025-03-27historical $925
-
2025-03-07price $925
-
2025-03-07historical $975
-
2025-02-06$975
-
2024-12-05$950
-
2024-12-05historical $950
-
2024-11-26price $950
-
2024-11-22$925
-
2024-05-30historical $1,000
-
2024-05-23$1,000
-
2024-04-07historical $965
-
2024-03-26price $965
-
2024-03-13$975
-
2023-11-13historical $975
-
2023-11-10$975
-
2023-10-22historical $975
-
2023-10-07$975
-
2023-09-17historical $975
-
2023-08-11price $975
-
2023-07-28$1,000
-
2022-12-28soldstatus $720,000
-
2007-05-01soldstatus $164,000
-
1999-01-14soldstatus
ⓘ Source: listings_history table (triggers on properties + properties_extension) + one-shot
backfill from property_details.listing_events for pre-trigger history.
Climate risk First Street
- Flood 1/10 Low FEMA zone X (unshaded) · 0% chance over 30 yrs
- Wildfire 1/10 Low
- Heat 5/10 Major 7 d/yr ≥106°F today · 22 d/yr by 30 yrs out
- Wind 2/10 Low 100% chance of damaging wind over 30 yrs
- Air quality 2/10 Low 1 unhealthy d/yr today · 3 by 30 yrs out
Nearby sold comps map
Loading sold comps map…
Walkable amenities ~0.75 mi
Loading nearby amenities…
Taxation est. · year 1
- Rental income
- $333,876
- − Mortgage interest
- −$134,437
- − Property taxes
- −$36,000
- − Insurance
- −$12,000
- − Repairs & maintenance
- −$26,710
- − Management
- −$26,710
- − Depreciation
- −$69,818
- Taxable income
- $28,200
- Est. tax owed @ 24.0%
- −$6,768
- After-tax cash flow
- $57,964/yr
For passive investors: Depreciation is non-cash, so a rental often shows a tax loss while cash-flowing — sheltering income. Rental losses are passive: they offset passive income freely, and up to $25,000/yr can offset ordinary (W-2) income if you actively participate and your MAGI is under $100k (phasing out to $0 by $150k); unused losses carry forward. On sale, claimed depreciation is recaptured at up to 25%, and gains may owe capital-gains tax (a 1031 exchange can defer both). Figures are a year-1 estimate at your 24.0% rate — not tax advice; consult a CPA.
Schools (NCES district)
- District
- Ritenour
- NCES district ID
- 2926640
- Math proficiency
- 13% ▼ -14.00%
- Reading proficiency
- 27% ▼ -7.00%
- Median HH income
- $41,410
- Composite
- 17.04/100
- National rank
- #9125
- State rank
- #304 of 324 in MO
Livability — St. John
No livability data for this city. (Only ~50 U.S. cities are tracked.)
Census & demographics
- Census place
- St. John, MO
- County
- Saint Louis County · 888,823 people
- Metro
- St. Louis, MO-IL
- Population (ZIP)
- 33,969
- Household income
- $55,870
- Rent vs Own
- Severe rent burden
- 1595.0
Population outlook (St. Louis County) Hauer SSP2
- Today (2025)
- 1,025,227 people
- By 2030
- 1,028,023 · +0.3%
- By 2040
- 1,020,940 · -0.4%
- By 2050
- 1,007,280 · -1.8%
- By 2075
- 987,277 · -3.7%
- By 2100
- 921,984 · -10.1%
Race, ethnicity, and origin ACS 2023
- Neighborhood character
- Diverse neighborhood (Simpson 0.64)
- Race & ethnicity
- White 50% Black 30% Hispanic / Latino 11% Two or more races 6% Asian 2%
- Hispanic origin (detail)
- Mexican 7%
- Common ancestry
- Lithuanian 3% Italian 2% Romanian 1%
- Foreign-born
- 9% · Canada, Vietnam
- Languages at home
- 84% English-only · Spanish 10% French/Haitian/Cajun 2% Tagalog/Filipino 1%
Political lean MEDSL · St. Louis
- 2024 margin
- Strong D (+23.4) · D 60.8% · R 37.4% · Other 1.7%
- 2008→2024 swing
- +3.5pp toward D · 2008: 19.9pp · 2024: 23.4pp
- All cycles
- 2024: D+23.4 2020: D+24.0 2016: D+16.2 2012: D+13.7 2008: D+19.9
Not yet ingested
- Civics
- —
Market trends
- HPI YoY
- ▼ -276.62%
- Current HPI
- 223.9305
- Rent YoY
- ▲ 2.04%
- Metro
- St. Louis, MO-IL
- State GDP YoY
- ▲ 1.84%
- F500 in state
- 20
Industry mix (Fortune 500 HQ in MO)
| Industry | F500 HQs | Revenue |
|---|---|---|
| Healthcare | 1 | $163B |
|
||
| Insurance | 1 | $21B |
|
||
| Industrial Technology | 1 | $17B |
|
||
| Retail | 1 | $16B |
|
||
| Industrial Distribution | 1 | $10B |
|
||
| Utilities | 1 | $9B |
|
||
Price history
+1363.4% since first listed28 events — show timeline
- 2026-05-17 Pending — MARIS as Distributed by MLS Grid
- 2026-04-21 Price Changed $2,399,999 MARIS as Distributed by MLS Grid
- 2026-03-01 Listed $2,450,000 MARIS as Distributed by MLS Grid
- 2025-08-22 Rental Removed $1,000 APPFOLIO
- 2025-07-25 Listed for Rent $1,000 APPFOLIO
- 2025-03-27 Rental Removed $925 APPFOLIO
- 2025-03-07 Price Changed $925 APPFOLIO
- 2025-03-07 Rental Removed $975 APPFOLIO
- 2025-02-06 Listed for Rent $975 APPFOLIO
- 2024-12-05 Listed for Rent $950 APPFOLIO
- 2024-12-05 Rental Removed $950 APPFOLIO
- 2024-11-26 Price Changed $950 APPFOLIO
- 2024-11-22 Listed for Rent $925 APPFOLIO
- 2024-05-30 Rental Removed $1,000 APPFOLIO
- 2024-05-23 Listed for Rent $1,000 APPFOLIO
- 2024-04-07 Rental Removed $965 APPFOLIO
- 2024-03-26 Price Changed $965 APPFOLIO
- 2024-03-13 Listed for Rent $975 APPFOLIO
- 2023-11-13 Rental Removed $975 APPFOLIO
- 2023-11-10 Listed for Rent $975 APPFOLIO
- 2023-10-22 Rental Removed $975 APPFOLIO
- 2023-10-07 Listed for Rent $975 APPFOLIO
- 2023-09-17 Rental Removed $975 APPFOLIO
- 2023-08-11 Price Changed $975 APPFOLIO
- 2023-07-28 Listed for Rent $1,000 APPFOLIO
- 2022-12-28 Sold (Public Records) $720,000 Public Records
- 2007-05-01 Sold (Public Records) $164,000 Public Records
- 1999-01-14 Sold (Public Records) — Public Records
Property tax history
+4.0%/yrLatest (2022): $3,938 · +0.0% YoY. Source: county tax records.
Cash-flow waterfall
monthlySold comps — $/sqft
last 12 mo · ≤1 miLoading sold comps…