820 Gabriella Ct · Mattituck, NY
Flood risk 1/10 · Minimal
- FEMA flood zone
- X (unshaded)
- Chance of flooding over 30 yrs
- 0.0%
- Est. flood insurance / yr
- $473 – $860
Fire risk 1/10 · Minimal
- Est. fire insurance / yr
- $691 – $1,283
Heat risk 5/10 · Moderate
- Hot days now (above 91°F)
- 7 days/yr
- Hot days in 30 yrs
- 19 days/yr
Wind risk 8/10 · Major
- Chance of severe wind over 30 yrs
- 80.0%
Air-quality risk 3/10 · Minor
- Unhealthy air days now
- 2 days/yr
- Unhealthy air days in 30 yrs
- 3 days/yr
Risk factors via First Street. Map © Google.
Why this score? — see what drove the C grade
The composite is a weighted blend of 9 inputs, each scored 0–100. Each bar is that input's sub-score; the figure is the points it added to the 100-point composite (weight × sub-score).
- Cash flow +27.2/30.0
- DSCR +9.5/10.0
- 1% rule +6.4/10.0
- Schools +6.1/10.0
- Livability +3.5/5.0
- Rent growth +2.5/5.0
- Condition / age +2.5/5.0
- ARV discount +0.0/15.0
- Appreciation +0.0/10.0
$1,425,000
🖨 Deal sheet 📄 Offer letter ✓ Due diligence
Listing remarks MLS
Oh the privacy. Move right into the open concept cape. Bedroom on the first floor and 2 additional bedrooms on the second with attic room to expand. Walk out the back sliders to an acre of secluded land with Evergreen's surrounding the entire property., Additional information: Appearance:good
Key facts
- 0.92 acre lot
- 2 garage spots
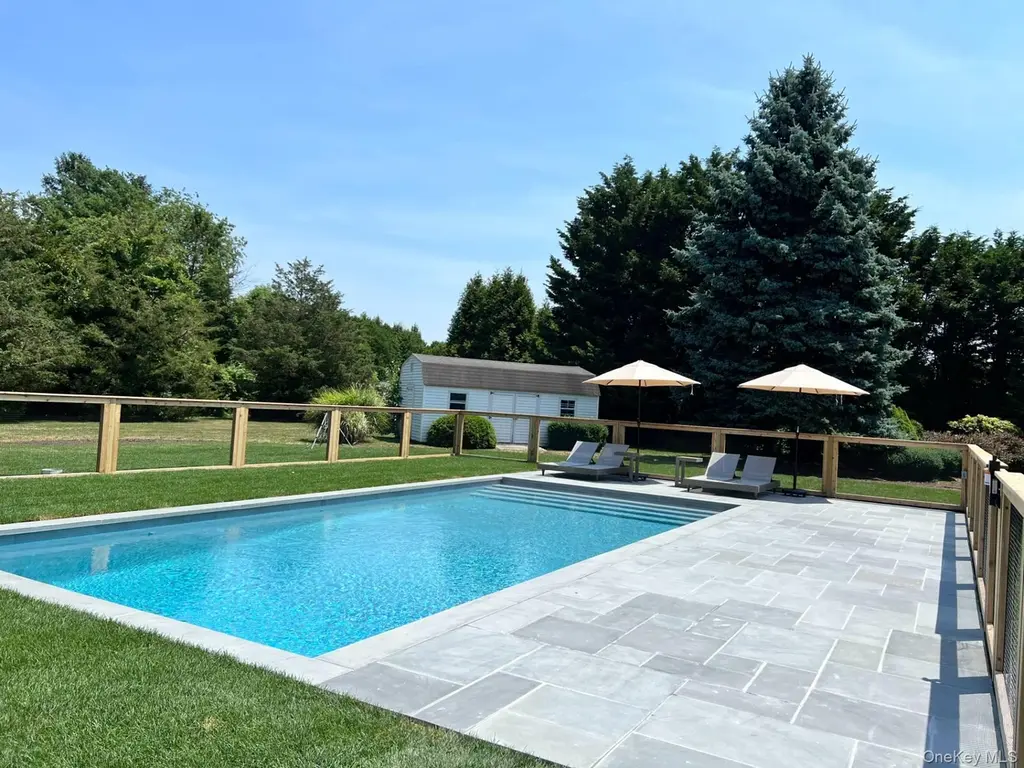
- Pool
Property features AI
Finance
- HOA & community: Community park; Additional fee for utilities
Exterior
- Parking: Attached garage; 2-car garage; Driveway; No carport
- Utilities: Septic tank; Cable available; Electricity connected; Phone available; Private trash collection; Underground utilities; Water connected
- Home design: Single family residence; Updated/remodeled; Two levels
- Construction: Frame construction
- Exterior features: Deck; Patio; Porch; Back yard fencing; Outbuilding/shed; Private in-ground pool; Located on waterfront; Sprinklers front and rear; Cul-de-sac lot; Near public transit, schools, and shops; Cleared, level lot
Interior
- Kitchen: Eat-in kitchen
- Bedrooms: Two-level home with rooms across two floors
- Flooring: Other
- Bathrooms: 2 full bathrooms
- Heating & cooling: Central air (electric); Forced air heating; Heat pump; Hot air
- Interior features: Eat-in kitchen; Entrance foyer; Primary bedroom on main floor; First-floor bedroom; Primary bathroom
- Laundry & utility: Washer hookup; Electric dryer hookup; Laundry in basement; Oil water heater
Neighborhood map
What this means for you Summary
Snapshot
- This is a 3-bed/2.0-bath single-family listed at $1.43M.
Deal economics
- At list price, monthly cash flow is $4k ($49k/yr) — positive.
- The deal already cash-flows at list — no discount required.
- Meets the 1% rule at list price ($16k rent vs $1.43M).
- Recommended offer: $1.40M (1.5% below list) — sets the bar for market timing.
- Cap rate 9.7% vs local median 4.0% in Mattituck — top-decile yield for the area; either an underpriced asset or a hidden risk that comps aren't pricing in. Stress-test before assuming the spread holds.
Location & tenants
- Location reads 70/100 on livability (#461 in NY) — a middle-class / working-renter tenant base. Strengths: crime A+, employment A+, health & safety B+; Watch: housing C-, amenities F, commute F.
- Mattituck-Cutchogue Union Free School District (suburban): math 69% / reading 68% proficiency, ranked #127 of 590 in NY (top 22%) — acceptable for families but not a draw, mixed tenant base, ~2y average lease; only 16% free/reduced lunch — higher-income household profile.
- Zoned schools: Mattituck-Cutchogue Elementary School (math 65% / reading 68%, grade B+, #575 of 2,108 statewide, top 27%, 453 students, 37% FRL); Mattituck Junior-Senior High School (math 74% / reading 72%, grade B+, #670 of 1,100 statewide, top 61%, 548 students, 0% FRL) — zoned schools at 18% FRL track the district average.
- Market conditions: 49 active listings in the ZIP; 4 comparable units currently listed for rent nearby; rentals lingering (median 44d on market — plan ~5-8 weeks vacancy on turnover, expect pricing pressure); 75% of comp listings sitting > 30 days — soft ceiling on asking rent; 1,366 units permitted in Suffolk County in 2024 (216 in 5+ unit buildings).
Forward outlook
- Local home prices are declining (-3.0%/yr); year-one equity from $10k of loan paydown is wiped out by about $43k of value loss. Plan a longer hold.
- Suffolk County population projected to shrink 5% by 2050 — rents likely to lag national; underwrite the cash flow, not the appreciation.
- At projected returns (-3.0% appreciation + 3.0% rent growth), your $399k cash investment doubles in ~10 years — after that, you're playing with house money.
Negotiation context
- It's been on market 30 days — a 2% lower offer ($1.40M) is reasonable based on typical stale-listing flexibility.
- 2 sale attempts since 3y ago with the ask held roughly flat each time — persistent listings suggest the price (not the market) is what's stuck; bring a comps-based counter.
- Current owner paid $819k; list at $1.43M implies a 74% gain — meaningful room to come down on a strong offer.
Risks & watch-outs
- Climate carrying-cost: severe wind risk, 80% chance of damaging wind over 30y; extreme-heat days projected 7→19/yr by 2055 (HVAC capex compounding) — expect insurance premiums to compound above CPI over the hold.
Questions for the listing agent
- Is there a deadline driving the sale (1031 exchange, divorce, estate, relocation)? That informs how much negotiation room exists.
- Schools are A-rated — typically a magnet for longer-tenancy family renters. What's the average tenant stay here, and is there a school-zone premium baked into asking?
- What's the average days-on-market for RENTAL listings here right now (not sales)? A rising rental-DOM trend means longer vacancies and softer asking-rent achievability than the comps imply.
- What's the recent tenant-quality profile in this submarket — average credit score on applications, eviction rate, late-payment / NSF rate, and stable-employment percentage? A property-management company in the area should have these aggregated.
- How much new for-sale + rental construction is in the pipeline within 1–3 miles? Heavy new supply typically softens prices + rents 12–24 months out; constrained supply supports both.
Investment metrics
- 1% rule
- 1.14% ✓
- Cap rate
- 9.73%
- Cash-on-cash
- 12.26%
- DSCR
- 1.55
- GRM
- 7.3
CMA / ARV
- ARV (median comp)
- $1,112,747
- List price
- $1,425,000
- Delta
- 28.06%
- Verdict
- OVERPRICED
- Comps
- 19 within 1.0 mi
Show comp detail 3 sales within ~0.75 mi
| Address | Dist | Beds/Ba | Sqft | Sold | Price | $/sf | Match |
|---|---|---|---|---|---|---|---|
| 770 Meadow Ln | 0.47mi | 3/2.0 | 1,600 (-11%) | 4mo | $822,000 | $514 | 56 |
| 925 Theresa Dr | 0.71mi | 3/2.5 | 1,900 (+6%) | 8mo | $895,000 | $471 | 49 |
| 17905 Main Rd | 0.25mi | 4/3.0 (+1) | 1,640 (-9%) | 22mo | $1,400,000 | $854 | 46 |
Match score weights: distance 35% · size 25% · config 20% · recency 20%. Top-matched comps best support the ARV.
Projected returns pro-forma
-3.0% appreciation · 3.0% rent growth · sell at horizon
- IRR
- 1.9%
- Equity multiple
- 1.07×
- Total profit
- $28,316
- Equity at exit
- $212,472
- IRR
- 11.4%
- Equity multiple
- 1.90×
- Total profit
- $357,237
- Equity at exit
- $123,208
Cash invested: $399,000 (down + closing). Projections, not guarantees.
Landlord ↔ Tenant lean methodology
- Overall (STATE)
- 15 Strongly Tenant-Friendly
- State New York
- 15 Strongly Tenant-Friendly · D+10
- County
- — inherits STATE
- City
- — inherits STATE
ZIP-level market 11952
- Home prices YoY
- -17.2%
- Active inventory
- 49
- Price-to-rent
- 7.3×
Monthly cashflow live
- Estimated rent
- $16,220 medium interval (Pro) →
- Mortgage (P&I)
- −$7,473
- Tax from tax record
- −$670 /mo · $8,038/yr
- Insurance
- −$594
- HOA
- −$0
- Vacancy / Maint / Mgmt
- −$3,406
- Net cashflow
- $4,077
Break-even live
UW: 25.0% down · 7.5% · 30yr · 1.5% tax · 5.0% vac · 8.0% maint · 8.0% mgmt
Financing live
Cash to close
- Down payment
- $356,250
- Closing costs
- $42,750
- Reserves months
- —
- Total cash needed
- —
Loan-product check · same deal, 3 products live
Conventional
25% down · 7.5% · 30yr
- Down + closing
- —
- Monthly P&I
- —
- Monthly cashflow
- —
- DSCR
- —
- Eligible?
- —
Personal DTI + credit; lowest rate.
DSCR
20% down · 8.5% · 30yr
- Down + closing
- —
- Monthly P&I
- —
- Monthly cashflow
- —
- DSCR
- —
- Eligible?
- —
No personal income docs; deal must DSCR.
Hard money
10% down · 12.0% · 12mo
- Down + closing
- —
- Monthly P&I
- —
- Monthly cashflow
- —
- DSCR
- —
- Eligible?
- —
Short-term bridge; refi at stabilization.
Rent comps 4 comps
| Address | Beds | Baths | Sqft | Rent | $/sqft | DOM | Units | Dist |
|---|---|---|---|---|---|---|---|---|
| 19000 Main Rd Mattituck, NY | 4.0 | 2.5 | 2000 | $15,000 | $7.50 | 43d | 1 | 0.20mi |
| 1100 Alvahs Ln Cutchogue, NY | 4.0 | 4.0 | 2400 | $24,200 | $10.08 | 43d | 1 | 1.12mi |
| 610 Park Ave Mattituck, NY | 4.0 | 2.0 | 1900 | $44,000 | $23.16 | 24d | 1 | 1.21mi |
| 705 Maple Ln Mattituck, NY | 3.0 | 2.0 | 1800 | $3,700 | $2.06 | 43d | 1 | 1.28mi |
Listing history 19 events
-
2026-06-18days on market $1,425,000 Active 30 DOM
-
2026-06-17days on market $1,425,000 Active 29 DOM
-
2026-06-16days on market $1,425,000 Active 28 DOM
-
2026-06-15days on market $1,425,000 Active 27 DOM
-
2026-06-13days on market $1,425,000 Active 25 DOM
-
2026-06-12days on market $1,425,000 Active 24 DOM
-
2026-06-09days on market $1,425,000 Active 21 DOM
-
2026-06-08days on market $1,425,000 Active 20 DOM
-
2026-06-07days on market $1,425,000 Active 19 DOM
-
2026-06-04days on market $1,425,000 Active 15 DOM
-
2026-06-02days on market $1,425,000 Active 14 DOM
-
2026-06-01days on market $1,425,000 Active 13 DOM
-
2026-05-31days on market $1,425,000 Active 12 DOM
-
2026-05-12historical $1,425,000 2662-char remark
-
2024-01-05soldstatus $818,750
-
2023-05-16soldstatus $805,000 Closed 296-char remark
Show marketing remark (296 chars)
Oh the privacy. Move right into the open concept cape. Bedroom on the first floor and 2 additional bedrooms on the second with attic room to expand. Walk out the back sliders to an acre of secluded land with Evergreen's surrounding the entire property., Additional information: Appearance:good
-
2023-03-23status Pending 296-char remark
Show marketing remark (296 chars)
Oh the privacy. Move right into the open concept cape. Bedroom on the first floor and 2 additional bedrooms on the second with attic room to expand. Walk out the back sliders to an acre of secluded land with Evergreen's surrounding the entire property., Additional information: Appearance:good
-
2023-03-01$849,000 Active 296-char remark
Show marketing remark (296 chars)
Oh the privacy. Move right into the open concept cape. Bedroom on the first floor and 2 additional bedrooms on the second with attic room to expand. Walk out the back sliders to an acre of secluded land with Evergreen's surrounding the entire property., Additional information: Appearance:good
-
1997-03-10soldstatus $920,000
ⓘ Source: listings_history table (triggers on properties + properties_extension) + one-shot
backfill from property_details.listing_events for pre-trigger history.
Tax reassessment forecast NY · Partial reset (capped growth)
- Current annual tax
- $8,038 · $670/mo
- Projected year-2 tax
- $16,060 · $1,338/mo
- Expected delta
- +$8,022/yr (+$669/mo · 99.8%)
ⓘ Screening estimate from a state-policy table — verify with the county assessor before closing.
Climate risk First Street
- Flood 1/10 Low FEMA zone X (unshaded) · 0% chance over 30 yrs
- Wildfire 1/10 Low
- Heat 5/10 Major 7 d/yr ≥91°F today · 19 d/yr by 30 yrs out
- Wind 8/10 Severe 80% chance of damaging wind over 30 yrs
- Air quality 3/10 Moderate 2 unhealthy d/yr today · 3 by 30 yrs out
Nearby sold comps map
Loading sold comps map…
Walkable amenities ~0.75 mi
Loading nearby amenities…
Taxation est. · year 1
- Rental income
- $194,635
- − Mortgage interest
- −$79,822
- − Property taxes
- −$8,038
- − Insurance
- −$7,125
- − Repairs & maintenance
- −$15,571
- − Management
- −$15,571
- − Depreciation
- −$41,455
- Taxable income
- $27,053
- Est. tax owed @ 24.0%
- −$6,493
- After-tax cash flow
- $42,431/yr
For passive investors: Depreciation is non-cash, so a rental often shows a tax loss while cash-flowing — sheltering income. Rental losses are passive: they offset passive income freely, and up to $25,000/yr can offset ordinary (W-2) income if you actively participate and your MAGI is under $100k (phasing out to $0 by $150k); unused losses carry forward. On sale, claimed depreciation is recaptured at up to 25%, and gains may owe capital-gains tax (a 1031 exchange can defer both). Figures are a year-1 estimate at your 24.0% rate — not tax advice; consult a CPA.
Schools (NCES district)
- District
- Mattituck-Cutchogue Union Free School District
- NCES district ID
- 3600021
- Math proficiency
- 69% ▼ -3.00%
- Reading proficiency
- 68% ▲ 4.00%
- Median HH income
- $84,164
- Composite
- 61.4/100
- National rank
- #765
- State rank
- #127 of 590 in NY
Livability — Mattituck
- Score
- 70/100
- State rank
- #461
- US rank
- #8015
Category grades
Schools grade is shown separately in the Schools card above.
Census & demographics
- Census place
- Mattituck, NY
- City population
- 4,749
- Population (ZIP)
- 4,749
Population outlook (Suffolk County) Hauer SSP2
- Today (2025)
- 1,505,262 people
- By 2030
- 1,498,318 · -0.5%
- By 2040
- 1,471,101 · -2.3%
- By 2050
- 1,424,848 · -5.3%
- By 2075
- 1,337,157 · -11.2%
- By 2100
- 1,217,720 · -19.1%
Race, ethnicity, and origin ACS 2023
- Neighborhood character
- Predominantly White (92%)
- Race & ethnicity
- White 92% Hispanic / Latino 7% Two or more races 2%
- Hispanic origin (detail)
- Mexican 2%
- Common ancestry
- Romanian 16% Subsaharan African 5% Scotch-Irish 3%
- Foreign-born
- 12% · Canada
- Languages at home
- 84% English-only · Russian/Polish/Slavic 6% Spanish 5% French/Haitian/Cajun 2%
Political lean MEDSL · Suffolk
- 2024 margin
- Lean R (+10.0) · D 45.0% · R 55.0%
- 2008→2024 swing
- -16.0pp toward R · 2008: 6.0pp · 2024: -10.0pp
- All cycles
- 2024: R+10.0 2020: R+0.0 2016: R+8.2 2012: D+2.9 2008: D+6.0
Not yet ingested
- Civics
- —
Market trends
- HPI YoY
- ▼ -94.04%
- Current HPI
- 453.8895
- Rent YoY
- —
- Metro
- —
- State GDP YoY
- ▲ 2.60%
- F500 in state
- 92
Industry mix (Fortune 500 HQ in NY)
| Industry | F500 HQs | Revenue |
|---|---|---|
| Financial Services | 10 | $950B |
|
||
| Consumer Goods | 9 | $162B |
|
||
| Insurance | 4 | $225B |
|
||
| Telecommunications | 2 | $144B |
|
||
| Pharmaceuticals | 2 | $112B |
|
||
| Media / Entertainment | 2 | $69B |
|
||
Price history
+54.9% since first listed7 events — show timeline
- 2026-05-20 Listed $1,425,000 OneKey® MLS as Distributed by MLS Grid
- 2026-05-12 Coming Soon $1,425,000 OneKey® MLS as Distributed by MLS Grid
- 2024-01-05 Sold (Public Records) $818,750 Public Records
- 2023-05-16 Sold (MLS) $805,000 OneKey® MLS as Distributed by MLS Grid
- 2023-03-23 Pending — OneKey® MLS as Distributed by MLS Grid
- 2023-03-01 Listed $849,000 OneKey® MLS as Distributed by MLS Grid
- 1997-03-10 Sold (Public Records) $920,000 Public Records
Property tax history
+2.7%/yrLatest (2025): $8,038 · +0.0% YoY. Source: county tax records.
Cash-flow waterfall
monthlySold comps — $/sqft
last 12 mo · ≤1 miLoading sold comps…