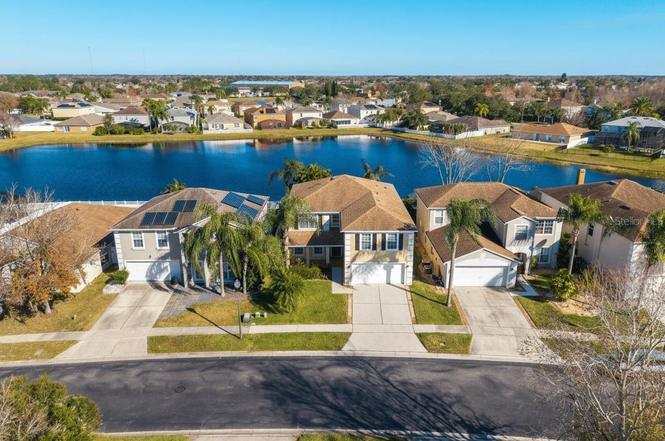
1015 Seneca Falls Dr · Alafaya, FL
Flood risk 1/10 · Minimal
- FEMA flood zone
- X (unshaded)
- Chance of flooding over 30 yrs
- 0.0%
- Est. flood insurance / yr
- $507 – $1,088
Fire risk 3/10 · Minor
- Est. fire insurance / yr
- $947 – $1,759
Heat risk 9/10 · Severe
- Hot days now (above 108°F)
- 7 days/yr
- Hot days in 30 yrs
- 23 days/yr
Wind risk 9/10 · Severe
- Chance of severe wind over 30 yrs
- 99.0%
Air-quality risk 2/10 · Minimal
- Unhealthy air days now
- 1 days/yr
- Unhealthy air days in 30 yrs
- 1 days/yr
Risk factors via First Street. Map © Google.
Why this score? — see what drove the D+ grade
The composite is a weighted blend of 9 inputs, each scored 0–100. Each bar is that input's sub-score; the figure is the points it added to the 100-point composite (weight × sub-score).
- ARV discount +15.0/15.0
- Cash flow +8.6/30.0
- Appreciation +4.8/10.0
- Schools +4.1/10.0
- Livability +4.1/5.0
- Rent growth +2.7/5.0
- Condition / age +2.5/5.0
- DSCR +2.4/10.0
- 1% rule +2.3/10.0
$564,900
🖨 Deal sheet (PDF) 📄 Offer letter ✓ Due diligence
Listing remarks MLS
This is a beautiful well maintained large single family home with six bedrooms, 4 full baths and a beautiful covered lanai with a lovely pond view. It has a well manicured yard front and back with flowering plants and fruit trees. Acessible are elementary, middle and high schools. Near to Waterford shopping vicinity with restaurants, shopping, supermarkets, cinema and entertainment. This is a well sought after area and a price that is too good to miss. Make an appointment to view the house soon!
Key facts
- Gated community
- Premium pond lot
- Generator hookup
Tags
Neighborhood map
What this means for you Summary
Snapshot
- This is a 6-bed/4.0-bath single-family listed at $565k.
Deal economics
- At list price, monthly cash flow is $-485 ($-6k/yr) — negative.
- To cash-flow at today's rent, offer at most $479k (15.2% below list).
- To meet the 1% rule (rent ≥ 1% of price), the offer needs to be $411k (27.2% below list).
- Recommended offer: $411k (27.2% below list) — sets the bar for 1% rule.
- Cap rate 5.3% vs local median 3.4% in Alafaya — top-decile yield for the area; either an underpriced asset or a hidden risk that comps aren't pricing in. Stress-test before assuming the spread holds.
Location & tenants
- Location reads 82/100 on livability (#60 in FL, #1,076 nationally) — a professional / high-income tenant draw. Strengths: housing A+, health & safety A+, crime A; Watch: cost of living C-.
- Orange (suburban): math 46% / reading 51% proficiency, ranked #43 of 73 in FL (top 59%) — families likely to look elsewhere, expect single-tenant / working-renter base with shorter leases.
- Zoned schools: Camelot Elementary (math 54% / reading 58%, grade C+, #832 of 2,144 statewide, top 40%, 609 students, 51% FRL); Avalon Middle (math 70% / reading 69%, grade A, #66 of 571 statewide, top 12%, 911 students, 29% FRL); Timber Creek High (math 46% / reading 72%, grade C+, #113 of 667 statewide, top 17%, 3,573 students, 33% FRL) — zoned schools average 37% FRL vs 56% district-wide (19 pts lower); this property's tenant base skews higher-income than the district average.
- Zoned-school proficiency averages 62% at this address vs 48% district-wide (+13 pts) — the actual schools serving this property are materially stronger than the Orange average implies; a family-tenant draw the district grade alone would hide.
- Market conditions: Rents flat; 329 active listings in the ZIP; 4 comparable units currently listed for rent nearby; rentals at typical pace (median 18d on market — plan ~3-4 weeks tenant-placement turnaround); solid renter incomes; 8,053 units permitted in Orange County in 2024 (3,133 in 5+ unit buildings).
Forward outlook
- In year one you build about $2k of equity ($4k loan paydown + $-2k appreciation (-0.4% local appreciation)).
- Orange County population projected at +52% by 2050 — long-run rental-demand tailwind backs the buy-and-hold thesis.
- By year 9, paydown + projected appreciation supports a ~$35k cash-out refi (75% LTV) — recoverable capital for the next deal without selling this one.
Negotiation context
- It's been on market 71 days — a 6% lower offer ($531k) is reasonable based on typical stale-listing flexibility.
- 13 sale attempts since 21y ago with the ask held roughly flat each time — persistent listings suggest the price (not the market) is what's stuck; bring a comps-based counter.
- Current owner paid $280k; list at $565k implies a 102% gain — meaningful room to come down on a strong offer.
Risks & watch-outs
- Climate carrying-cost: severe wind risk, 99% chance of damaging wind over 30y; extreme-heat days projected 7→23/yr by 2055 (HVAC capex compounding) — expect insurance premiums to compound above CPI over the hold.
Questions for the listing agent
- What do current leases actually rent for vs. the listed asking? Can we see a recent rent roll and the last 12 months of T-12 income?
- It's been on market 71 days. Have you received any prior offers? Is the seller open to a 27% concession, seller financing, or rate buy-down credit?
- What does the HOA fee cover, when was the last increase, and are there any pending special assessments or reserve-fund shortfalls?
- Why hasn't it sold? Are there any deal-killer items the seller is aware of (foundation, flood, title, zoning, code violations)?
- Is there a deadline driving the sale (1031 exchange, divorce, estate, relocation)? That informs how much negotiation room exists.
- Schools are D-rated, which usually means shorter tenancies and higher turnover. Who's the typical renter profile here, and what's been the actual vacancy rate?
- The area grade is low — what's the realistic commute time and amenity access for the typical tenant pool here? Any planned neighborhood developments (good or bad) we should know about?
- What's the average days-on-market for RENTAL listings here right now (not sales)? A rising rental-DOM trend means longer vacancies and softer asking-rent achievability than the comps imply.
- What's the recent tenant-quality profile in this submarket — average credit score on applications, eviction rate, late-payment / NSF rate, and stable-employment percentage? A property-management company in the area should have these aggregated.
- How much new for-sale + rental construction is in the pipeline within 1–3 miles? Heavy new supply typically softens prices + rents 12–24 months out; constrained supply supports both.
Investment metrics
- 1% rule
- 0.73% ✗
- Cap rate
- 5.26%
- Cash-on-cash
- -3.68%
- DSCR
- 0.84
- GRM
- 11.5
CMA / ARV
- ARV (on-the-fly)
- $716,793
- Comps found
- 2
Show comp detail 2 sales within ~0.75 mi
| Address | Dist | Beds/Ba | Sqft | Sold | Price | $/sf | Match |
|---|---|---|---|---|---|---|---|
| 821 Eastcliffe Ct | 0.17mi | 6/4.0 | 3,457 (-2%) | 4mo | $575,000 | $166 | 85 |
| 12218 Shadowbrook Ln | 0.69mi | 5/4.0 (-1) | 3,645 (+3%) | 14mo | $740,000 | $203 | 46 |
Match score weights: distance 35% · size 25% · config 20% · recency 20%. Top-matched comps best support the ARV.
Projected returns pro-forma
-0.37% appreciation · 0.82% rent growth · sell at horizon
- IRR
- -9.3%
- Equity multiple
- 0.58×
- Total profit
- $-65,968
- Equity at exit
- $153,739
- IRR
- -4.5%
- Equity multiple
- 0.57×
- Total profit
- $-68,710
- Equity at exit
- $176,779
Cash invested: $158,172 (down + closing). Projections, not guarantees.
Landlord ↔ Tenant lean methodology
- Overall (STATE)
- 87 Strongly Landlord-Friendly
- State Florida
- 87 Strongly Landlord-Friendly · R+3
- County
- — inherits STATE
- City
- — inherits STATE
ZIP-level market 32828
- Home prices YoY
- -0.1%
- Rents YoY
- 0.8%
- Active inventory
- 329
- Price-to-rent
- 11.5×
Monthly cashflow live
- Estimated rent
- $4,110 medium interval (Pro) →
- Mortgage (P&I)
- −$2,962
- Tax from tax record
- −$444 /mo · $5,323/yr
- Insurance
- −$235
- HOA
- −$91
- Vacancy / Maint / Mgmt
- −$863
- Net cashflow
- $-485
Break-even live
Sensitivity live
| Price | -10% $-165 | -5% $-325 | +0% $-485 | +5% $-645 | +10% $-805 |
|---|---|---|---|---|---|
| Rent | -10% $-810 | -5% $-648 | +0% $-485 | +5% $-323 | +10% $-160 |
| Rate | -1.0pp $-201 | -0.5pp $-342 | base $-485 | +0.5pp $-632 | +1.0pp $-781 |
UW: 25.0% down · 7.5% · 30yr · 1.5% tax · 5.0% vac · 8.0% maint · 8.0% mgmt
Financing live
Cash to close
- Down payment
- $141,225
- Closing costs
- $16,947
- Reserves months
- —
- Total cash needed
- —
Loan-product check · same deal, 3 products live
Conventional
25% down · 7.5% · 30yr
- Down + closing
- —
- Monthly P&I
- —
- Monthly cashflow
- —
- DSCR
- —
- Eligible?
- —
Personal DTI + credit; lowest rate.
DSCR
20% down · 8.5% · 30yr
- Down + closing
- —
- Monthly P&I
- —
- Monthly cashflow
- —
- DSCR
- —
- Eligible?
- —
No personal income docs; deal must DSCR.
Hard money
10% down · 12.0% · 12mo
- Down + closing
- —
- Monthly P&I
- —
- Monthly cashflow
- —
- DSCR
- —
- Eligible?
- —
Short-term bridge; refi at stabilization.
Rent comps 4 comps
| Address | Beds | Baths | Sqft | Rent | $/sqft | DOM | Units | Dist |
|---|---|---|---|---|---|---|---|---|
| 14332 Abington Heights Dr Orlando, FL | 7.0 | 4.0 | 4236 | $4,540 | $1.07 | 0d | 1 | 0.13mi |
| 14912 Faberge Dr Orlando, FL | 5.0 | 4.0 | 3439 | $3,640 | $1.06 | 19d | 1 | 0.95mi |
| 14912 Faberge Dr Orlando, FL | 5.0 | 4.0 | 3439 | $3,640 | $1.06 | 14d | 1 | 0.95mi |
| 13668 Crystal River Dr Orlando, FL | 5.0 | 2.5 | 2874 | $3,750 | $1.30 | 18d | 1 | 0.97mi |
HOA detail
- Monthly dues
- $91 · $1,092/yr
- Likely covers
- water
Listing history 29 events
-
2026-04-23status Pending
-
2026-04-21price $564,900
-
2026-03-26price $569,000
-
2026-02-19status Active
-
2026-02-11status Pending
-
2026-02-03$575,000 Active
-
2014-05-05soldstatus $280,000
-
2014-05-02soldstatus $279,500 Sold 500-char remark
Show marketing remark (500 chars)
This is a beautiful well maintained large single family home with six bedrooms, 4 full baths and a beautiful covered lanai with a lovely pond view. It has a well manicured yard front and back with flowering plants and fruit trees. Acessible are elementary, middle and high schools. Near to Waterford shopping vicinity with restaurants, shopping, supermarkets, cinema and entertainment. This is a well sought after area and a price that is too good to miss. Make an appointment to view the house soon!
-
2014-03-14$280,000 500-char remark
Show marketing remark (500 chars)
This is a beautiful well maintained large single family home with six bedrooms, 4 full baths and a beautiful covered lanai with a lovely pond view. It has a well manicured yard front and back with flowering plants and fruit trees. Acessible are elementary, middle and high schools. Near to Waterford shopping vicinity with restaurants, shopping, supermarkets, cinema and entertainment. This is a well sought after area and a price that is too good to miss. Make an appointment to view the house soon!
-
2010-10-07soldstatus $213,000 341-char remark
Show marketing remark (341 chars)
Wow!! What a beautiful location. NOT A SHORT SALE OR BANK OWNED. Close & move in quickly without 3rd party hassles. Newly painted inside & out. New carpet up stairs, open kitchen looks out to pond. Master & 2nd bedrooms great view of pond. Gated Community. Just reduced $10K Hurry this property will not last at this price.
-
2010-10-06soldstatus $213,000
-
2010-07-10$219,900 341-char remark
Show marketing remark (341 chars)
Wow!! What a beautiful location. NOT A SHORT SALE OR BANK OWNED. Close & move in quickly without 3rd party hassles. Newly painted inside & out. New carpet up stairs, open kitchen looks out to pond. Master & 2nd bedrooms great view of pond. Gated Community. Just reduced $10K Hurry this property will not last at this price.
-
2010-04-29soldstatus $160,000
-
2010-02-23$160,000
-
2010-02-23historical
-
2009-06-30$209,000
-
2008-07-30$338,000
-
2008-07-25historical
-
2008-06-16$338,000
-
2007-04-17soldstatus $340,000
-
2007-04-16soldstatus $340,000
-
2007-01-09historical
-
2007-01-08$360,000
-
2006-06-19$399,900
-
2006-03-26historical
-
2006-01-12$424,770
-
2005-09-12$429,500
-
2005-09-12historical
-
2005-07-23$435,000
ⓘ Source: listings_history table (triggers on properties + properties_extension) + one-shot
backfill from property_details.listing_events for pre-trigger history.
Tax reassessment forecast FL · Resets to sale price
- Current annual tax
- $5,323 · $444/mo
- Projected year-2 tax
- $5,323 · $444/mo
- Expected delta
- $0/yr ($0/mo · 0.0%)
ⓘ Screening estimate from a state-policy table — verify with the county assessor before closing.
Climate risk First Street
- Flood 1/10 Low FEMA zone X (unshaded) · 0% chance over 30 yrs
- Wildfire 3/10 Moderate
- Heat 9/10 Extreme 7 d/yr ≥108°F today · 23 d/yr by 30 yrs out
- Wind 9/10 Extreme 99% chance of damaging wind over 30 yrs
- Air quality 2/10 Low 1 unhealthy d/yr today · 1 by 30 yrs out
Nearby sold comps map
Loading sold comps map…
Walkable amenities ~0.75 mi
Loading nearby amenities…
Taxation est. · year 1
- Rental income
- $49,324
- − Mortgage interest
- −$31,643
- − Property taxes
- −$5,323
- − Insurance
- −$2,824
- − Repairs & maintenance
- −$3,946
- − Management
- −$3,946
- − HOA
- −$1,092
- − Depreciation
- −$16,433
- Taxable loss
- −$15,884
- Est. tax savings @ 24.0%
- +$3,812
- After-tax cash flow
- $-2,010/yr
For passive investors: Depreciation is non-cash, so a rental often shows a tax loss while cash-flowing — sheltering income. Rental losses are passive: they offset passive income freely, and up to $25,000/yr can offset ordinary (W-2) income if you actively participate and your MAGI is under $100k (phasing out to $0 by $150k); unused losses carry forward. On sale, claimed depreciation is recaptured at up to 25%, and gains may owe capital-gains tax (a 1031 exchange can defer both). Figures are a year-1 estimate at your 24.0% rate — not tax advice; consult a CPA.
Schools (NCES district)
- District
- Orange
- NCES district ID
- 1201440
- Math proficiency
- 46% ▼ -9.00%
- Reading proficiency
- 51% ▼ -2.00%
- Median HH income
- $49,350
- Composite
- 41.47/100
- National rank
- #3461
- State rank
- #43 of 73 in FL
Livability — Alafaya
- Score
- 82/100
- State rank
- #60
- US rank
- #1076
Category grades
Schools grade is shown separately in the Schools card above.
Census & demographics
- Census place
- Alafaya, FL
- County
- Orange County · 1,471,359 people
- City population
- 131,972
- Metro
- Orlando-Kissimmee-Sanford, FL
- Population (ZIP)
- 69,202
- Household income
- $101,767
- Rent vs Own
- Severe rent burden
- 2213.0
Population outlook (Orange County) Hauer SSP2
- Today (2025)
- 1,618,226 people
- By 2030
- 1,787,404 · +10.5%
- By 2040
- 2,125,621 · +31.4%
- By 2050
- 2,454,016 · +51.6%
- By 2075
- 3,173,711 · +96.1%
- By 2100
- 3,607,781 · +122.9%
Race, ethnicity, and origin ACS 2023
- Neighborhood character
- Diverse neighborhood (Simpson 0.67)
- Race & ethnicity
- White 42% Hispanic / Latino 37% Two or more races 23% Black 9% Asian 7%
- Hispanic origin (detail)
- Mexican 1% Puerto Rican 19% Cuban 4% Dominican 3%
- Common ancestry
- Slovak 2% Romanian 1% Lithuanian 1%
- Foreign-born
- 20% · Canada, Jamaica, Vietnam
- Languages at home
- 63% English-only · Spanish 27% Other Indo-European 3% Arabic 1%
Political lean MEDSL · Orange
- 2024 margin
- D (+13.6) · D 56.1% · R 42.5% · Other 1.3%
- 2008→2024 swing
- -5.0pp toward R · 2008: 18.6pp · 2024: 13.6pp
- All cycles
- 2024: D+13.6 2020: D+23.1 2016: D+24.6 2012: D+18.2 2008: D+18.6
Not yet ingested
- Civics
- —
Market trends
- HPI YoY
- ▼ -0.37%
- Current HPI
- 284.5182
- Rent YoY
- ▲ 0.82%
- Metro
- Orlando-Kissimmee-Sanford, FL
- State GDP YoY
- ▲ 3.28%
- F500 in state
- 36
Industry mix (Fortune 500 HQ in FL)
| Industry | F500 HQs | Revenue |
|---|---|---|
| Industrial Technology | 2 | $29B |
|
||
| Insurance | 2 | $17B |
|
||
| Retail | 1 | $60B |
|
||
| Technology Distribution | 1 | $58B |
|
||
| Homebuilding | 1 | $35B |
|
||
| Technology Manufacturing | 1 | $35B |
|
||
Price history
+29.9% since first listed29 events — show timeline
- 2026-04-23 Pending — Stellar MLS as Distributed by MLS Grid
- 2026-04-21 Price Changed $564,900 Stellar MLS as Distributed by MLS Grid
- 2026-03-26 Price Changed $569,000 Stellar MLS as Distributed by MLS Grid
- 2026-02-19 Relisted — Stellar MLS as Distributed by MLS Grid
- 2026-02-11 Pending — Stellar MLS as Distributed by MLS Grid
- 2026-02-03 Listed $575,000 Stellar MLS as Distributed by MLS Grid
- 2014-05-05 Sold (Public Records) $280,000 Public Records
- 2014-05-02 Sold (MLS) $279,500 Stellar MLS as Distributed by MLS Grid
- 2014-03-14 Listed $280,000 Stellar MLS as Distributed by MLS Grid
- 2010-10-07 Sold (MLS) $213,000 Stellar MLS as Distributed by MLS Grid
- 2010-10-06 Sold (Public Records) $213,000 Public Records
- 2010-07-10 Listed $219,900 Stellar MLS as Distributed by MLS Grid
- 2010-04-29 Sold (MLS) $160,000 Stellar MLS as Distributed by MLS Grid
- 2010-02-23 Listing Removed — Stellar MLS as Distributed by MLS Grid
- 2010-02-23 Listed $160,000 Stellar MLS as Distributed by MLS Grid
- 2009-06-30 Listed $209,000 Stellar MLS as Distributed by MLS Grid
- 2008-07-30 Listed $338,000 Stellar MLS as Distributed by MLS Grid
- 2008-07-25 Listing Removed — Stellar MLS as Distributed by MLS Grid
- 2008-06-16 Listed $338,000 Stellar MLS as Distributed by MLS Grid
- 2007-04-17 Sold (Public Records) $340,000 Public Records
- 2007-04-16 Sold (MLS) $340,000 Stellar MLS as Distributed by MLS Grid
- 2007-01-09 Listing Removed — Stellar MLS as Distributed by MLS Grid
- 2007-01-08 Listed $360,000 Stellar MLS as Distributed by MLS Grid
- 2006-06-19 Listed $399,900 Stellar MLS as Distributed by MLS Grid
- 2006-03-26 Listing Removed — Stellar MLS as Distributed by MLS Grid
- 2006-01-12 Listed $424,770 Stellar MLS as Distributed by MLS Grid
- 2005-09-12 Listing Removed — Stellar MLS as Distributed by MLS Grid
- 2005-09-12 Listed $429,500 Stellar MLS as Distributed by MLS Grid
- 2005-07-23 Listed $435,000 Stellar MLS as Distributed by MLS Grid
Property tax history
+4.6%/yrLatest (2025): $5,323 · +4.8% YoY. Source: county tax records.
Cash-flow waterfall
monthlySold comps — $/sqft
last 12 mo · ≤1 miLoading sold comps…