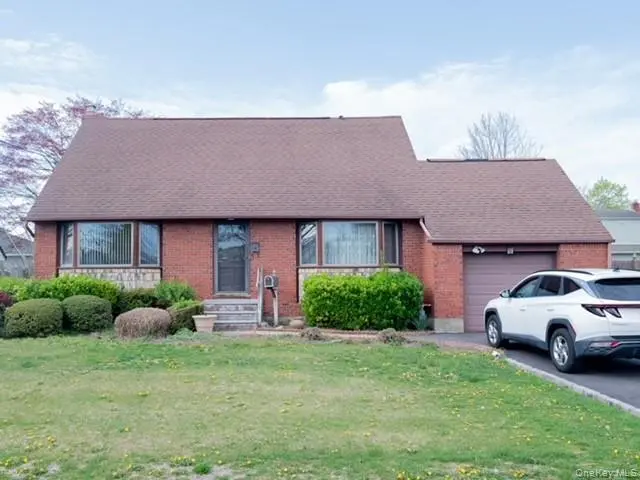
9 Goshen St · Deer Park, NY
Flood risk 1/10 · Minimal
- FEMA flood zone
- X (unshaded)
- Chance of flooding over 30 yrs
- 0.0%
- Est. flood insurance / yr
- $473 – $860
Fire risk 3/10 · Minor
- Est. fire insurance / yr
- $691 – $1,283
Heat risk 5/10 · Moderate
- Hot days now (above 94°F)
- 7 days/yr
- Hot days in 30 yrs
- 16 days/yr
Wind risk 6/10 · Moderate
- Chance of severe wind over 30 yrs
- 65.0%
Air-quality risk 4/10 · Minor
- Unhealthy air days now
- 4 days/yr
- Unhealthy air days in 30 yrs
- 6 days/yr
Risk factors via First Street. Map © Google.
Why this score? — see what drove the C- grade
The composite is a weighted blend of 9 inputs, each scored 0–100. Each bar is that input's sub-score; the figure is the points it added to the 100-point composite (weight × sub-score).
- ARV discount +15.0/15.0
- Cash flow +14.7/30.0
- Schools +5.5/10.0
- DSCR +4.5/10.0
- Livability +3.8/5.0
- 1% rule +3.2/10.0
- Rent growth +2.5/5.0
- Condition / age +2.5/5.0
- Appreciation +0.0/10.0
$639,000
🖨 Deal sheet 📄 Offer letter ✓ Due diligence
Listing remarks
Property being sold as.
Key facts
- 7,492 sq ft lot
- Built 1968
- Listed 14 days
Property features AI
Finance
- HOA & community: Association fees (if any) include heat and hot water
Exterior
- Parking: Off-street parking
- Utilities: Public sewer; No listed utilities
- Home design: Single family residence; Two levels
- Construction: Vinyl siding construction; Full basement
- Exterior features: Vinyl siding; Not waterfront
Interior
- Kitchen: Includes appliances (other)
- Flooring: Hardwood floors
- Bathrooms: 2 full bathrooms
- Heating & cooling: Natural gas heating; Wall/window air conditioning units
- Interior features: Eat-in kitchen; Full basement
Neighborhood map
What this means for you Summary
Snapshot
- This is a 3-bed/1.0-bath single-family listed at $639k.
Deal economics
- At list price, monthly cash flow is $159 ($2k/yr) — positive.
- The deal already cash-flows at list — no discount required.
- To meet the 1% rule (rent ≥ 1% of price), the offer needs to be $522k (18.3% below list).
- Recommended offer: $522k (18.3% below list) — sets the bar for 1% rule.
- Cap rate 6.6% vs local median 3.0% in Deer Park — top-decile yield for the area; either an underpriced asset or a hidden risk that comps aren't pricing in. Stress-test before assuming the spread holds.
Location & tenants
- Location reads 76/100 on livability (#216 in NY, #3,358 nationally) — a middle-class / working-renter tenant base. Strengths: employment A+, housing A+, health & safety A+; Watch: amenities D, commute F, cost of living F.
- Deer Park Union Free School District (suburban): math 63% / reading 60% proficiency, ranked #181 of 590 in NY (top 31%) — acceptable for families but not a draw, mixed tenant base, ~2y average lease.
- Zoned schools: John F Kennedy Intermediate School (math 64% / reading 61%, grade B, #671 of 2,108 statewide, top 32%, 830 students, 44% FRL); Robert Frost Middle School (math 30% / reading 60%, grade D, #342 of 729 statewide, top 48%, 903 students, 49% FRL); Deer Park High School (math 95% / reading 57%, grade A-, #616 of 1,100 statewide, top 57%, 1,314 students, 45% FRL) — zoned schools average 46% FRL vs 28% district-wide (17 pts higher); higher-poverty schools than district average — tighter screening recommended.
- Market conditions: 117 active listings in the ZIP; 4 comparable units currently listed for rent nearby; rentals at typical pace (median 16d on market — plan ~3-4 weeks tenant-placement turnaround); 1,366 units permitted in Suffolk County in 2024 (216 in 5+ unit buildings).
Forward outlook
- Local home prices are declining (-3.0%/yr); year-one equity from $4k of loan paydown is wiped out by about $19k of value loss. Plan a longer hold.
- Suffolk County population projected to shrink 5% by 2050 — rents likely to lag national; underwrite the cash flow, not the appreciation.
Negotiation context
- Only 14 days on market — expect competitive offers; lowballing is unlikely to land.
- 2 sale attempts since 2y ago with the ask held roughly flat each time — persistent listings suggest the price (not the market) is what's stuck; bring a comps-based counter.
Risks & watch-outs
- Climate carrying-cost: major wind risk, 65% chance of damaging wind over 30y; extreme-heat days projected 7→16/yr by 2055 (HVAC capex compounding) — expect insurance premiums to compound above CPI over the hold.
Questions for the listing agent
- Built in 1968 — when were the roof, HVAC, electrical panel, plumbing, and water heater last replaced?
- Is there a deadline driving the sale (1031 exchange, divorce, estate, relocation)? That informs how much negotiation room exists.
- Schools are A-rated — typically a magnet for longer-tenancy family renters. What's the average tenant stay here, and is there a school-zone premium baked into asking?
- What's the average days-on-market for RENTAL listings here right now (not sales)? A rising rental-DOM trend means longer vacancies and softer asking-rent achievability than the comps imply.
- What's the recent tenant-quality profile in this submarket — average credit score on applications, eviction rate, late-payment / NSF rate, and stable-employment percentage? A property-management company in the area should have these aggregated.
- How much new for-sale + rental construction is in the pipeline within 1–3 miles? Heavy new supply typically softens prices + rents 12–24 months out; constrained supply supports both.
Investment metrics
- 1% rule
- 0.82% ✗
- Cap rate
- 6.59%
- Cash-on-cash
- 1.06%
- DSCR
- 1.05
- GRM
- 10.2
CMA / ARV
- ARV (median comp)
- $807,964
- List price
- $639,000
- Delta
- -20.91%
- Verdict
- UNDERPRICED
- Comps
- 20 within 1.0 mi
Show comp detail 12 sales within ~0.75 mi
| Address | Dist | Beds/Ba | Sqft | Sold | Price | $/sf | Match |
|---|---|---|---|---|---|---|---|
| 17 Hawthorne St | 0.05mi | 4/2.0 (+1) | 2,020 (+2%) | 5mo | $750,000 | $371 | 81 |
| 109 Westwood Ave | 0.30mi | 3/2.0 | 1,962 (-1%) | 5mo | $730,000 | $372 | 77 |
| 22 Jersey St | 0.17mi | 4/2.0 (+1) | 1,881 (-5%) | 1mo | $781,500 | $415 | 74 |
| 207 Eastwood Ave | 0.15mi | 3/2.5 | 1,854 (-6%) | 6mo | $675,000 | $364 | 72 |
| 118 Wright Ave | 0.27mi | 4/2.0 (+1) | 1,992 (+1%) | 8mo | $680,000 | $341 | 71 |
| 14 Osceola Ave | 0.39mi | 3/2.0 | 2,000 (+1%) | 6mo | $750,000 | $375 | 70 |
| 190 Burlington Ave | 0.42mi | 3/2.0 | 1,874 (-5%) | 1mo | $552,500 | $295 | 67 |
| 149 Osceola Ave | 0.26mi | 4/2.5 (+1) | 2,184 (+10%) | 7mo | $742,500 | $340 | 54 |
| 4 Susan Ct | 0.50mi | 4/2.5 (+1) | 2,045 (+4%) | 9mo | $729,000 | $356 | 52 |
| 2 Smith St | 0.65mi | 4/3.0 (+1) | 1,880 (-5%) | 2mo | $793,000 | $422 | 47 |
| 163 Albany St | 0.40mi | 4/2.5 (+1) | 1,746 (-12%) | 8mo | $718,000 | $411 | 44 |
| 47 Pearsall Pl | 0.57mi | 3/3.0 | 1,738 (-12%) | 4mo | $704,000 | $405 | 42 |
Match score weights: distance 35% · size 25% · config 20% · recency 20%. Top-matched comps best support the ARV.
Projected returns pro-forma
-3.0% appreciation · 3.0% rent growth · sell at horizon
- IRR
- -14.6%
- Equity multiple
- 0.48×
- Total profit
- $-93,638
- Equity at exit
- $95,277
- IRR
- -6.0%
- Equity multiple
- 0.61×
- Total profit
- $-69,328
- Equity at exit
- $55,249
Cash invested: $178,920 (down + closing). Projections, not guarantees.
Landlord ↔ Tenant lean methodology
- Overall (STATE)
- 15 Strongly Tenant-Friendly
- State New York
- 15 Strongly Tenant-Friendly · D+10
- County
- — inherits STATE
- City
- — inherits STATE
ZIP-level market 11729
- Active inventory
- 117
- Price-to-rent
- 10.2×
Monthly cashflow live
- Estimated rent
- $5,223 medium interval (Pro) →
- Mortgage (P&I)
- −$3,351
- Tax from tax record
- −$350 /mo · $4,199/yr
- Insurance
- −$266
- HOA
- −$0
- Vacancy / Maint / Mgmt
- −$1,097
- Net cashflow
- $159
Break-even live
UW: 25.0% down · 7.5% · 30yr · 1.5% tax · 5.0% vac · 8.0% maint · 8.0% mgmt
Financing live
Cash to close
- Down payment
- $159,750
- Closing costs
- $19,170
- Reserves months
- —
- Total cash needed
- —
Loan-product check · same deal, 3 products live
Conventional
25% down · 7.5% · 30yr
- Down + closing
- —
- Monthly P&I
- —
- Monthly cashflow
- —
- DSCR
- —
- Eligible?
- —
Personal DTI + credit; lowest rate.
DSCR
20% down · 8.5% · 30yr
- Down + closing
- —
- Monthly P&I
- —
- Monthly cashflow
- —
- DSCR
- —
- Eligible?
- —
No personal income docs; deal must DSCR.
Hard money
10% down · 12.0% · 12mo
- Down + closing
- —
- Monthly P&I
- —
- Monthly cashflow
- —
- DSCR
- —
- Eligible?
- —
Short-term bridge; refi at stabilization.
Rent comps 4 comps
| Address | Beds | Baths | Sqft | Rent | $/sqft | DOM | Units | Dist |
|---|---|---|---|---|---|---|---|---|
| 290 Eastwood Ave Deer Park, NY | 4.0 | 2.5 | 2400 | $7,000 | $2.92 | 44d | 1 | 0.28mi |
| 601 Old Country Rd Deer Park, NY | 4.0 | 1.0 | 1945 | $4,000 | $2.06 | 15d | 1 | 0.48mi |
| 335 Gillette St Dix Hills, NY | 3.0 | 1.0 | 1400 | $3,650 | $2.61 | 11d | 1 | 0.58mi |
| 23 Seaman Neck Rd Dix Hills, NY | 3.0 | 1.0 | 1400 | $3,800 | $2.71 | 1d | 1 | 1.25mi |
Listing history 5 events
-
2026-05-14status Pending 23-char remark
-
2026-05-01$639,000 Active 23-char remark
-
2026-04-27historical $639,000 23-char remark
-
2024-03-19historical $1,850
-
2024-02-17$1,850
ⓘ Source: listings_history table (triggers on properties + properties_extension) + one-shot
backfill from property_details.listing_events for pre-trigger history.
Tax reassessment forecast NY · Partial reset (capped growth)
- Current annual tax
- $4,199 · $350/mo
- Projected year-2 tax
- $7,499 · $625/mo
- Expected delta
- +$3,300/yr (+$275/mo · 78.6%)
ⓘ Screening estimate from a state-policy table — verify with the county assessor before closing.
Climate risk First Street
- Flood 1/10 Low FEMA zone X (unshaded) · 0% chance over 30 yrs
- Wildfire 3/10 Moderate
- Heat 5/10 Major 7 d/yr ≥94°F today · 16 d/yr by 30 yrs out
- Wind 6/10 Major 65% chance of damaging wind over 30 yrs
- Air quality 4/10 Moderate 4 unhealthy d/yr today · 6 by 30 yrs out
Nearby sold comps map
Loading sold comps map…
Walkable amenities ~0.75 mi
Loading nearby amenities…
Taxation est. · year 1
- Rental income
- $62,671
- − Mortgage interest
- −$35,794
- − Property taxes
- −$4,199
- − Insurance
- −$3,195
- − Repairs & maintenance
- −$5,014
- − Management
- −$5,014
- − Depreciation
- −$18,589
- Taxable loss
- −$9,134
- Est. tax savings @ 24.0%
- +$2,192
- After-tax cash flow
- $4,096/yr
For passive investors: Depreciation is non-cash, so a rental often shows a tax loss while cash-flowing — sheltering income. Rental losses are passive: they offset passive income freely, and up to $25,000/yr can offset ordinary (W-2) income if you actively participate and your MAGI is under $100k (phasing out to $0 by $150k); unused losses carry forward. On sale, claimed depreciation is recaptured at up to 25%, and gains may owe capital-gains tax (a 1031 exchange can defer both). Figures are a year-1 estimate at your 24.0% rate — not tax advice; consult a CPA.
Schools (NCES district)
- District
- Deer Park Union Free School District
- NCES district ID
- 3608880
- Math proficiency
- 63% ▼ -3.00%
- Reading proficiency
- 60% ▼ -5.00%
- Median HH income
- $80,561
- Composite
- 55.26/100
- National rank
- #1268
- State rank
- #181 of 590 in NY
Livability — Deer Park
- Score
- 76/100
- State rank
- #216
- US rank
- #3358
Category grades
Schools grade is shown separately in the Schools card above.
Census & demographics
- Census place
- Deer Park, NY
- City population
- 26,647
- Population (ZIP)
- 26,647
Population outlook (Suffolk County) Hauer SSP2
- Today (2025)
- 1,505,262 people
- By 2030
- 1,498,318 · -0.5%
- By 2040
- 1,471,101 · -2.3%
- By 2050
- 1,424,848 · -5.3%
- By 2075
- 1,337,157 · -11.2%
- By 2100
- 1,217,720 · -19.1%
Race, ethnicity, and origin ACS 2023
- Neighborhood character
- Diverse neighborhood (Simpson 0.67)
- Race & ethnicity
- White 51% Hispanic / Latino 23% Two or more races 13% Black 12% Asian 11%
- Hispanic origin (detail)
- Mexican 1% Puerto Rican 7% Dominican 4%
- Common ancestry
- Hispanic 4% Romanian 3% Armenian 1%
- Foreign-born
- 21% · Canada, China, Jamaica
- Languages at home
- 72% English-only · Spanish 13% Other Indo-European 7% Chinese 3%
Political lean MEDSL · Suffolk
- 2024 margin
- Lean R (+10.0) · D 45.0% · R 55.0%
- 2008→2024 swing
- -16.0pp toward R · 2008: 6.0pp · 2024: -10.0pp
- All cycles
- 2024: R+10.0 2020: R+0.0 2016: R+8.2 2012: D+2.9 2008: D+6.0
Not yet ingested
- Civics
- —
Market trends
- HPI YoY
- ▼ -669.80%
- Current HPI
- 285.3175
- Rent YoY
- —
- Metro
- —
- State GDP YoY
- ▲ 2.60%
- F500 in state
- 92
Industry mix (Fortune 500 HQ in NY)
| Industry | F500 HQs | Revenue |
|---|---|---|
| Financial Services | 10 | $950B |
|
||
| Consumer Goods | 9 | $162B |
|
||
| Insurance | 4 | $225B |
|
||
| Telecommunications | 2 | $144B |
|
||
| Pharmaceuticals | 2 | $112B |
|
||
| Media / Entertainment | 2 | $69B |
|
||
Price history
+34440.5% since first listed5 events — show timeline
- 2026-05-14 Pending — OneKey® MLS as Distributed by MLS Grid
- 2026-05-01 Listed $639,000 OneKey® MLS as Distributed by MLS Grid
- 2026-04-27 Coming Soon $639,000 OneKey® MLS as Distributed by MLS Grid
- 2024-03-19 Rental Removed $1,850 ONEKEY
- 2024-02-17 Listed for Rent $1,850 ONEKEY
Property tax history
+2.9%/yrLatest (2025): $4,199 · +0.0% YoY. Source: county tax records.
Cash-flow waterfall
monthlySold comps — $/sqft
last 12 mo · ≤1 miLoading sold comps…