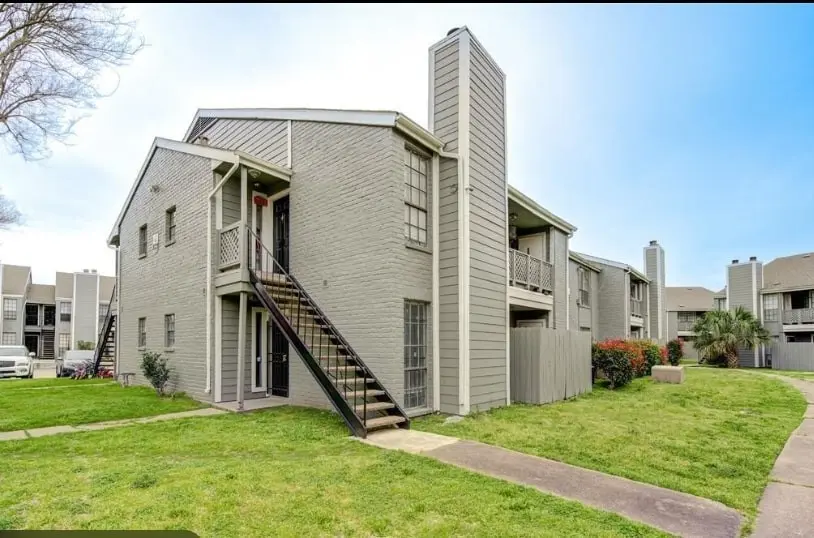
12500 Sandpiper Dr #179 · Houston, TX
Flood risk 7/10 · Major
- FEMA flood zone
- X (shaded)
- Chance of flooding over 30 yrs
- 0.99%
- Est. flood insurance / yr
- $507 – $1,088
Fire risk 1/10 · Minimal
- Est. fire insurance / yr
- $1,222 – $2,270
Heat risk 9/10 · Severe
- Hot days now (above 110°F)
- 7 days/yr
- Hot days in 30 yrs
- 24 days/yr
Wind risk 9/10 · Severe
- Chance of severe wind over 30 yrs
- 99.0%
Air-quality risk 3/10 · Minor
- Unhealthy air days now
- 2 days/yr
- Unhealthy air days in 30 yrs
- 3 days/yr
Risk factors via First Street. Map © Google.
Why this score? — see what drove the D+ grade
The composite is a weighted blend of 9 inputs, each scored 0–100. Each bar is that input's sub-score; the figure is the points it added to the 100-point composite (weight × sub-score).
- ARV discount +14.7/15.0
- 1% rule +10.0/10.0
- Cash flow +8.7/30.0
- Livability +3.7/5.0
- Schools +2.7/10.0
- Rent growth +2.5/5.0
- Condition / age +2.5/5.0
- DSCR +2.4/10.0
- Appreciation +0.0/10.0
$49,000
🖨 Deal sheet (PDF) 📄 Offer letter ✓ Due diligence
Listing remarks MLS
Tenant Occupied Invastor Deal- No Tour
Key facts
- $462 HOA
- Built 1981
- Listed 259 days
Neighborhood map
What this means for you Summary
Snapshot
- This is a 2-bed/1.0-bath condo listed at $49k.
Deal economics
- At list price, monthly cash flow is $-108 ($-1k/yr) — negative.
- To cash-flow at today's rent, offer at most $30k (38.8% below list).
- Meets the 1% rule at list price ($1k rent vs $49k).
- Recommended offer: $30k (38.8% below list) — sets the bar for cash-flow.
- Cap rate 5.3% vs local median 3.2% in Houston — top-decile yield for the area; either an underpriced asset or a hidden risk that comps aren't pricing in. Stress-test before assuming the spread holds.
Location & tenants
- Location reads 74/100 on livability (#184 in TX, #4,771 nationally) — a middle-class / working-renter tenant base. Strengths: amenities A+, cost of living A+, housing A+; Watch: crime F.
- Houston ISD (urban): math 27% / reading 35% proficiency, ranked #593 of 826 in TX (top 72%) — families likely to look elsewhere, expect single-tenant / working-renter base with shorter leases; 71% free/reduced lunch — lower-income household profile, screen leases tightly.
- Zoned schools: Foerster El (math 14% / reading 21%, grade F, #3,805 of 4,322 statewide, top 89%, 617 students, 98% FRL); Fondren Middle (math 13% / reading 20%, grade F, #1,536 of 1,662 statewide, top 93%, 840 students, 99% FRL); Westbury H S (math 19% / reading 31%, grade F, #1,250 of 1,632 statewide, top 77%, 2,243 students, 92% FRL) — zoned schools average 96% FRL vs 71% district-wide (25 pts higher); higher-poverty schools than district average — tighter screening recommended.
- Market conditions: Rents flat; 203 active listings in the ZIP; 40 comparable units currently listed for rent nearby; rentals at typical pace (median 23d on market — plan ~3-4 weeks tenant-placement turnaround); 29,883 units permitted in Harris County in 2024 (8,621 in 5+ unit buildings).
Forward outlook
- Local home prices are declining (-3.0%/yr); year-one equity from $339 of loan paydown is wiped out by about $1k of value loss. Plan a longer hold.
- Harris County population projected at +47% by 2050 — long-run rental-demand tailwind backs the buy-and-hold thesis.
Negotiation context
- It's been on market 259 days — a 12% lower offer ($43k) is reasonable based on typical stale-listing flexibility.
- 6 sale attempts since 2y ago; this cycle's ask is 4355% above the opening price — seller raised mid-cycle; expect resistance to lowballs.
Risks & watch-outs
- Watch-outs: flood insurance adds $66/mo; HOA is 46% of rent.
- Climate carrying-cost: major flood risk; severe wind risk, 99% chance of damaging wind over 30y; extreme-heat days projected 7→24/yr by 2055 (HVAC capex compounding) — expect insurance premiums to compound above CPI over the hold.
Questions for the listing agent
- What do current leases actually rent for vs. the listed asking? Can we see a recent rent roll and the last 12 months of T-12 income?
- It's been on market 259 days. Have you received any prior offers? Is the seller open to a 39% concession, seller financing, or rate buy-down credit?
- What's the actual annual flood-insurance premium (NFIP or private), and is the property in a SFHA with mandatory coverage?
- What does the HOA fee cover, when was the last increase, and are there any pending special assessments or reserve-fund shortfalls?
- Any open or pending special assessments — roof, HVAC, plumbing, elevator, façade? What's the per-unit balance and payoff schedule, and is the seller paying it off at close or rolling it to the buyer?
- Why hasn't it sold? Are there any deal-killer items the seller is aware of (foundation, flood, title, zoning, code violations)?
- Is there a deadline driving the sale (1031 exchange, divorce, estate, relocation)? That informs how much negotiation room exists.
- Schools are D-rated, which usually means shorter tenancies and higher turnover. Who's the typical renter profile here, and what's been the actual vacancy rate?
- Crime grade is F in this area — have there been break-ins, vandalism, or insurance claims at this property in the last 3 years? What carrier currently insures it and at what premium?
- The area grade is low — what's the realistic commute time and amenity access for the typical tenant pool here? Any planned neighborhood developments (good or bad) we should know about?
- What's the average days-on-market for RENTAL listings here right now (not sales)? A rising rental-DOM trend means longer vacancies and softer asking-rent achievability than the comps imply.
- What's the recent tenant-quality profile in this submarket — average credit score on applications, eviction rate, late-payment / NSF rate, and stable-employment percentage? A property-management company in the area should have these aggregated.
- How much new apartment / multifamily construction is in the pipeline within 1–3 miles? Heavy new supply (>2% of stock underway) typically softens rents 12–24 months out; light construction supports rent growth.
Investment metrics
- 1% rule
- 2.06% ✓
- Cap rate
- 5.28%
- Cash-on-cash
- -3.61%
- DSCR
- 0.84
- GRM
- 4.0
CMA / ARV
- ARV (median comp)
- $58,310
- List price
- $49,000
- Delta
- -15.97%
- Verdict
- UNDERPRICED
- Comps
- 20 within 1.0 mi
Projected returns pro-forma
-3.0% appreciation · 0.02% rent growth · sell at horizon
- IRR
- -44.3%
- Equity multiple
- -0.27×
- Total profit
- $-17,379
- Equity at exit
- $7,306
- IRR
- —
- Equity multiple
- -1.47×
- Total profit
- $-33,869
- Equity at exit
- $4,237
Cash invested: $13,720 (down + closing). Projections, not guarantees.
Landlord ↔ Tenant lean methodology
- Overall (STATE)
- 87 Strongly Landlord-Friendly
- State Texas
- 87 Strongly Landlord-Friendly · R+5
- County
- — inherits STATE
- City
- — inherits STATE
ZIP-level market 77035
- Rents YoY
- 0.0%
- Active inventory
- 203
- Price-to-rent
- 4.0×
Monthly cashflow live
- Estimated rent
- $1,011 high interval (Pro) →
- Mortgage (P&I)
- −$257
- Tax from tax record
- −$101 /mo · $1,209/yr
- Insurance
- −$20
- Flood insurance flood zone
- −$66 /mo · $798/yr
- HOA
- −$462
- Vacancy / Maint / Mgmt
- −$212
- Net cashflow
- $-108
Break-even live
Sensitivity live
| Price | -10% $-80 | -5% $-94 | +0% $-108 | +5% $-122 | +10% $-135 |
|---|---|---|---|---|---|
| Rent | -10% $-188 | -5% $-148 | +0% $-108 | +5% $-68 | +10% $-28 |
| Rate | -1.0pp $-83 | -0.5pp $-95 | base $-108 | +0.5pp $-120 | +1.0pp $-133 |
UW: 25.0% down · 7.5% · 30yr · 1.5% tax · 5.0% vac · 8.0% maint · 8.0% mgmt
Financing live
Cash to close
- Down payment
- $12,250
- Closing costs
- $1,470
- Reserves months
- —
- Total cash needed
- —
Loan-product check · same deal, 3 products live
Conventional
25% down · 7.5% · 30yr
- Down + closing
- —
- Monthly P&I
- —
- Monthly cashflow
- —
- DSCR
- —
- Eligible?
- —
Personal DTI + credit; lowest rate.
DSCR
20% down · 8.5% · 30yr
- Down + closing
- —
- Monthly P&I
- —
- Monthly cashflow
- —
- DSCR
- —
- Eligible?
- —
No personal income docs; deal must DSCR.
Hard money
10% down · 12.0% · 12mo
- Down + closing
- —
- Monthly P&I
- —
- Monthly cashflow
- —
- DSCR
- —
- Eligible?
- —
Short-term bridge; refi at stabilization.
Rent comps 40 comps
| Address | Beds | Baths | Sqft | Rent | $/sqft | DOM | Units | Dist |
|---|---|---|---|---|---|---|---|---|
| 12500 Sandpiper Dr Houston, TX | 2.0 | 1.0–2.0 | 1018 | $1,094 | $1.07 | 45d | 6 | 0.02mi |
| 6363 W Airport Blvd Unit 622 Houston, TX | 2.0 | 2.0 | 946 | $974 | $1.03 | 19d | 1 | 0.16mi |
| 6633 W Airport Blvd Houston, TX | 1.0–2.0 | 1.5–2.0 | 1063 | $1,200 | $1.13 | 45d | 2 | 0.17mi |
| 14550 Fonmeadow Dr Houston, TX | 1.0–2.0 | 1.0–2.0 | 1057 | $1,350 | $1.28 | 45d | 2 | 0.18mi |
| 6363 W Airport Blvd Houston, TX | 2.0 | 1.0–2.0 | 744 | $985 | $1.32 | 9d | 1 | 0.21mi |
| 6633 W Airport Blvd #902 Houston, TX | 2.0 | 2.0 | 1063 | $1,200 | $1.13 | 1d | 1 | 0.21mi |
| 6363 W Airport Blvd Apt 721 Houston, TX | 2.0 | 1.0 | 940 | $875 | $0.93 | 45d | 1 | 0.22mi |
| 6363 W Airport Blvd Unit 2224 Houston, TX | 2.0 | 2.0 | 1033 | $985 | $0.95 | 19d | 1 | 0.22mi |
| 6363 W Airport Blvd Apt 2123 Houston, TX | 2.0 | 1.0 | 794 | $695 | $0.88 | 45d | 1 | 0.22mi |
| 6363 W Airport Blvd Unit 1021 Houston, TX | 1.0 | 1.0 | 550 | $595 | $1.08 | 22d | 1 | 0.22mi |
| 6363 W Airport Blvd Unit 528 Houston, TX | 1.0 | 1.0 | 728 | $650 | $0.89 | 19d | 1 | 0.22mi |
| 6363 W Airport Blvd Unit 321 Houston, TX | 1.0 | 1.0 | 533 | $495 | $0.93 | 19d | 1 | 0.22mi |
| 6363 W Airport Blvd Apt 1823 Houston, TX | 2.0 | 1.0 | 875 | $790 | $0.90 | 45d | 1 | 0.22mi |
| 6363 W Airport Blvd Unit 4204 Houston, TX | 1.0 | 1.0 | 550 | $595 | $1.08 | 26d | 1 | 0.22mi |
| 12247 Sunset Meadow Ln Houston, TX | 1.0–3.0 | 1.0–2.0 | 990 | $1,392 | $1.41 | 5d | 1 | 0.25mi |
| 12351 Bob White Dr Houston, TX | 2.0 | 2.0 | 1000 | $987 | $0.99 | 45d | 1 | 0.27mi |
| 12351 Bob White Dr Houston, TX | 1.0 | 1.0 | 601 | $750 | $1.25 | 22d | 1 | 0.27mi |
| 12351 Bob White Dr Houston, TX | 1.0 | 1.0 | 601 | $750 | $1.25 | 19d | 1 | 0.27mi |
| 12351 Bob White Dr Houston, TX | 2.0 | 2.0 | 1000 | $987 | $0.99 | 16d | 1 | 0.27mi |
| 12345 Bob White Dr Unit 17-1710 Houston, TX | 1.0 | 1.0 | 661 | $875 | $1.32 | 5d | 1 | 0.31mi |
| 12271 Fondren Rd Houston, TX | 1.0 | 1.0 | 680 | $835 | $1.23 | 14d | 1 | 0.35mi |
| 12271 Fondren Rd Houston, TX | 2.0 | 2.0 | 1007 | $1,050 | $1.04 | 24d | 1 | 0.35mi |
| 12271 Fondren Rd Houston, TX | 1.0 | 1.0 | 680 | $835 | $1.23 | 45d | 1 | 0.35mi |
| 12271 Fondren Rd Houston, TX | 2.0 | 2.0 | 1007 | $1,050 | $1.04 | 20d | 1 | 0.35mi |
| 14430 Minetta St Unit 8 Houston, TX | 1.0 | 1.0 | 600 | $1,025 | $1.71 | 45d | 1 | 0.35mi |
| 12211 Fondren Rd Houston, TX | 1.0–2.0 | 1.0–2.0 | 817 | $1,235 | $1.51 | 0d | 21 | 0.40mi |
| 12261 Fondren Rd Houston, TX | 2.0 | 2.0 | 1066 | $1,200 | $1.13 | 45d | 1 | 0.48mi |
| 12500 Dunlap St Houston, TX | 1.0–3.0 | 1.0–2.0 | 907 | $965 | $1.06 | 0d | 59 | 0.49mi |
| 12107 Fondren Rd Houston, TX | 1.0 | 1.0 | 635 | $925 | $1.46 | 45d | 1 | 0.50mi |
| 12107 Fondren Rd Houston, TX | 2.0 | 2.0 | 990 | $1,125 | $1.14 | 26d | 1 | 0.50mi |
| 12107 Fondren Rd Houston, TX | 1.0 | 1.0 | 635 | $925 | $1.46 | 24d | 1 | 0.50mi |
| 6319 Southwood Ct N Houston, TX | 3.0 | 1.0 | 1102 | $1,450 | $1.32 | 45d | 1 | 0.51mi |
| 7706 W Airport Blvd Houston, TX | 1.0 | 1.0 | 575 | $865 | $1.50 | 13d | 1 | 0.57mi |
| 7706 W Airport Blvd Houston, TX | 2.0 | 1.0 | 875 | $1,080 | $1.23 | 45d | 1 | 0.57mi |
| 7700 W Airport Blvd Unit 7774 Houston, TX | 1.0 | 1.0 | 575 | $735 | $1.28 | 16d | 1 | 0.59mi |
| 7700 W Airport Blvd Unit 7774 Houston, TX | 1.0 | 1.0 | 575 | $752 | $1.31 | 0d | 1 | 0.59mi |
| 7700 W Airport Blvd Unit 7751 Houston, TX | 1.0 | 1.0 | 575 | $701 | $1.22 | 14d | 1 | 0.59mi |
| 7700 W Airport Blvd Unit 7757 Houston, TX | 2.0 | 2.0 | 1005 | $1,232 | $1.23 | 16d | 1 | 0.59mi |
| 20 Alvarado Dr Houston, TX | 1.0 | 1.0 | 667 | $870 | $1.30 | 26d | 1 | 0.60mi |
| 20 Alvarado Dr Houston, TX | 2.0 | 2.0 | 938 | $997 | $1.06 | 22d | 1 | 0.60mi |
HOA detail condo
- Monthly dues
- $462 · $5,544/yr
- Assessments
- None detected in remarks — confirm with the listing agent.
Listing history 33 events
-
2026-06-21days on market $49,000 Active 259 DOM
-
2026-06-18days on market $49,000 Active 256 DOM
-
2026-06-17days on market $49,000 Active 255 DOM
-
2026-06-16days on market $49,000 Active 254 DOM
-
2026-06-15days on market $49,000 Active 253 DOM
-
2026-06-13days on market $49,000 Active 251 DOM
-
2026-06-10days on market $49,000 Active 247 DOM
-
2026-06-08days on market $49,000 Active 246 DOM
-
2026-06-07days on market $49,000 Active 245 DOM
-
2026-06-04days on market $49,000 Active 242 DOM
-
2026-06-01days on market $49,000 Active 239 DOM
-
2026-05-31days on market $49,000 Active 238 DOM
-
2026-03-03historical $990
-
2026-02-17price $990
Show marketing remark (38 chars)
Tenant Occupied Invastor Deal- No Tour
-
2026-02-17status Active 38-char remark
Show marketing remark (38 chars)
Tenant Occupied Invastor Deal- No Tour
-
2026-02-16price $49,000 38-char remark
Show marketing remark (38 chars)
Tenant Occupied Invastor Deal- No Tour
-
2026-02-16historical 38-char remark
Show marketing remark (38 chars)
Tenant Occupied Invastor Deal- No Tour
-
2026-02-05price $59,000 38-char remark
Show marketing remark (38 chars)
Tenant Occupied Invastor Deal- No Tour
-
2025-11-14price $1,350
-
2025-11-05price $69,000 38-char remark
Show marketing remark (38 chars)
Tenant Occupied Invastor Deal- No Tour
-
2025-11-05price $59,000 38-char remark
Show marketing remark (38 chars)
Tenant Occupied Invastor Deal- No Tour
-
2025-10-16price $990
-
2025-10-09$1,100
-
2025-10-07status Active 38-char remark
Show marketing remark (38 chars)
Tenant Occupied Invastor Deal- No Tour
-
2025-10-05historical 38-char remark
Show marketing remark (38 chars)
Tenant Occupied Invastor Deal- No Tour
-
2025-10-02status Active 38-char remark
Show marketing remark (38 chars)
Tenant Occupied Invastor Deal- No Tour
-
2025-09-24historical 38-char remark
Show marketing remark (38 chars)
Tenant Occupied Invastor Deal- No Tour
-
2025-09-24$78,000 Active 38-char remark
Show marketing remark (38 chars)
Tenant Occupied Invastor Deal- No Tour
-
2024-04-29soldstatus
-
2024-04-26soldstatus Sold 441-char remark
Show marketing remark (441 chars)
Look at this soft gray walls new carpet, new blinds, freshly painted walls, ceilings and all trim. . Two large bedrooms, comes with stack washer and dryer, refrigerator, dishwasher and beautiful counter tops. Has a private patio area with storage, a corner fireplace, ceiling fans through out and parking right outside the door. Also a down stairs unit. .. Just so cute in and out. Just needs you to call it home. Room sizes are estitmated.
-
2024-04-24status Pending 441-char remark
Show marketing remark (441 chars)
Look at this soft gray walls new carpet, new blinds, freshly painted walls, ceilings and all trim. . Two large bedrooms, comes with stack washer and dryer, refrigerator, dishwasher and beautiful counter tops. Has a private patio area with storage, a corner fireplace, ceiling fans through out and parking right outside the door. Also a down stairs unit. .. Just so cute in and out. Just needs you to call it home. Room sizes are estitmated.
-
2024-04-09$55,000 Active 441-char remark
Show marketing remark (441 chars)
Look at this soft gray walls new carpet, new blinds, freshly painted walls, ceilings and all trim. . Two large bedrooms, comes with stack washer and dryer, refrigerator, dishwasher and beautiful counter tops. Has a private patio area with storage, a corner fireplace, ceiling fans through out and parking right outside the door. Also a down stairs unit. .. Just so cute in and out. Just needs you to call it home. Room sizes are estitmated.
-
1988-01-02soldstatus
ⓘ Source: listings_history table (triggers on properties + properties_extension) + one-shot
backfill from property_details.listing_events for pre-trigger history.
Tax reassessment forecast TX · Resets to sale price
- Current annual tax
- $1,209 · $101/mo
- Projected year-2 tax
- $1,209 · $101/mo
- Expected delta
- $0/yr ($0/mo · 0.0%)
ⓘ Screening estimate from a state-policy table — verify with the county assessor before closing.
Climate risk First Street
- Flood 7/10 Severe FEMA zone X (shaded) · 99% chance over 30 yrs
- Wildfire 1/10 Low
- Heat 9/10 Extreme 7 d/yr ≥110°F today · 24 d/yr by 30 yrs out
- Wind 9/10 Extreme 99% chance of damaging wind over 30 yrs
- Air quality 3/10 Moderate 2 unhealthy d/yr today · 3 by 30 yrs out
Nearby sold comps map
Loading sold comps map…
Walkable amenities ~0.75 mi
Loading nearby amenities…
Taxation est. · year 1
- Rental income
- $12,136
- − Mortgage interest
- −$2,745
- − Property taxes
- −$1,209
- − Insurance
- −$1,042
- − Repairs & maintenance
- −$971
- − Management
- −$971
- − HOA
- −$5,544
- − Depreciation
- −$1,425
- Taxable loss
- −$1,772
- Est. tax savings @ 24.0%
- +$425
- After-tax cash flow
- $-867/yr
For passive investors: Depreciation is non-cash, so a rental often shows a tax loss while cash-flowing — sheltering income. Rental losses are passive: they offset passive income freely, and up to $25,000/yr can offset ordinary (W-2) income if you actively participate and your MAGI is under $100k (phasing out to $0 by $150k); unused losses carry forward. On sale, claimed depreciation is recaptured at up to 25%, and gains may owe capital-gains tax (a 1031 exchange can defer both). Figures are a year-1 estimate at your 24.0% rate — not tax advice; consult a CPA.
Schools (NCES district)
- District
- Houston ISD
- NCES district ID
- 4823640
- Math proficiency
- 27% ▼ -18.00%
- Reading proficiency
- 35% ▼ -6.00%
- Median HH income
- $46,054
- Composite
- 26.63/100
- National rank
- #7173
- State rank
- #593 of 826 in TX
Livability — Houston
- Score
- 74/100
- State rank
- #184
- US rank
- #4771
Category grades
Schools grade is shown separately in the Schools card above.
Census & demographics
- Census place
- Houston, TX
- County
- Harris County · 4,702,590 people
- City population
- 3,226,434
- Metro
- Houston-The Woodlands-Sugar Land, TX
- Population (ZIP)
- 36,019
- Household income
- $58,686
- Rent vs Own
- Severe rent burden
- 2844.0
Population outlook (Harris County) Hauer SSP2
- Today (2025)
- 5,571,493 people
- By 2030
- 6,089,821 · +9.3%
- By 2040
- 7,142,806 · +28.2%
- By 2050
- 8,185,864 · +46.9%
- By 2075
- 10,574,329 · +89.8%
- By 2100
- 12,109,958 · +117.4%
Race, ethnicity, and origin ACS 2023
- Neighborhood character
- Diverse neighborhood (Simpson 0.68)
- Race & ethnicity
- Hispanic / Latino 42% Black 29% White 23% Two or more races 19% Asian 2%
- Hispanic origin (detail)
- Mexican 26%
- Common ancestry
- Lithuanian 2% Italian 1% Serbian 1%
- Foreign-born
- 26% · Canada, China
- Languages at home
- 56% English-only · Spanish 37% French/Haitian/Cajun 1% Other Asian/Pacific 1%
Political lean MEDSL · Harris
- 2024 margin
- Lean D (+5.5) · D 52.0% · R 46.4% · Other 1.6%
- 2008→2024 swing
- +3.9pp toward D · 2008: 1.6pp · 2024: 5.5pp
- All cycles
- 2024: D+5.5 2020: D+13.3 2016: D+12.4 2012: D+0.1 2008: D+1.6
Not yet ingested
- Civics
- —
Market trends
- HPI YoY
- ▼ -145.44%
- Current HPI
- 266.5195
- Rent YoY
- ▬ 0.02%
- Metro
- Houston-The Woodlands-Sugar Land, TX
- State GDP YoY
- ▲ 3.95%
- F500 in state
- 110
Industry mix (Fortune 500 HQ in TX)
| Industry | F500 HQs | Revenue |
|---|---|---|
| Energy | 16 | $1,198B |
|
||
| Technology | 5 | $198B |
|
||
| Engineering / Construction | 4 | $72B |
|
||
| Energy Services | 3 | $60B |
|
||
| Utilities | 3 | $41B |
|
||
| Healthcare | 2 | $330B |
|
||
Price history
-10.9% since first listed21 events — show timeline
- 2026-03-03 Rental Removed $990 HARMLS
- 2026-02-17 Price Changed $990 HARMLS
- 2026-02-17 Relisted — HARMLS
- 2026-02-16 Price Changed $49,000 HARMLS
- 2026-02-16 Listing Removed — HARMLS
- 2026-02-05 Price Changed $59,000 HARMLS
- 2025-11-14 Price Changed $1,350 HARMLS
- 2025-11-05 Price Changed $69,000 HARMLS
- 2025-11-05 Price Changed $59,000 HARMLS
- 2025-10-16 Price Changed $990 HARMLS
- 2025-10-09 Listed for Rent $1,100 HARMLS
- 2025-10-07 Relisted — HARMLS
- 2025-10-05 Listing Removed — HARMLS
- 2025-10-02 Relisted — HARMLS
- 2025-09-24 Listed $78,000 HARMLS
- 2025-09-24 Listing Removed — HARMLS
- 2024-04-29 Sold (Public Records) — Public Records
- 2024-04-26 Sold (MLS) — HARMLS
- 2024-04-24 Pending — HARMLS
- 2024-04-09 Listed $55,000 HARMLS
- 1988-01-02 Sold (Public Records) — Public Records
Property tax history
+9.6%/yrLatest (2025): $1,209 · -20.8% YoY. Source: county tax records.
Cash-flow waterfall
monthlySold comps — $/sqft
last 12 mo · ≤1 miLoading sold comps…