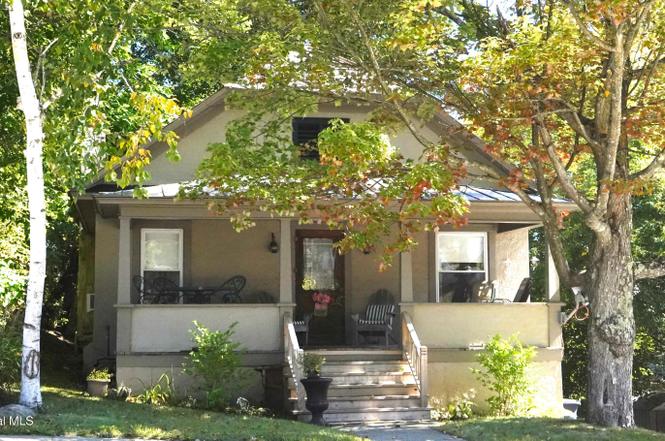
240 Main St · North Creek, NY
Flood risk 1/10 · Minimal
- FEMA flood zone
- X
- Chance of flooding over 30 yrs
- 0.0%
- Est. flood insurance / yr
- $473 – $860
Fire risk 3/10 · Minor
- Est. fire insurance / yr
- $691 – $1,283
Heat risk 2/10 · Minimal
- Hot days now (above 90°F)
- 8 days/yr
- Hot days in 30 yrs
- 18 days/yr
Wind risk 2/10 · Minimal
- Chance of severe wind over 30 yrs
- 2.0%
Air-quality risk 1/10 · Minimal
- Unhealthy air days now
- 0 days/yr
- Unhealthy air days in 30 yrs
- 0 days/yr
Risk factors via First Street. Map © Google.
Why this score? — see what drove the D+ grade
The composite is a weighted blend of 9 inputs, each scored 0–100. Each bar is that input's sub-score; the figure is the points it added to the 100-point composite (weight × sub-score).
- Cash flow +15.0/30.0
- Appreciation +10.0/10.0
- 1% rule +5.0/10.0
- DSCR +5.0/10.0
- Schools +4.2/10.0
- Livability +3.2/5.0
- Rent growth +2.5/5.0
- Condition / age +2.5/5.0
- ARV discount +0.0/15.0
$275,000
🖨 Deal sheet (PDF) 📄 Offer letter ✓ Due diligence
Listing remarks
Perfect Gore Mountain ski house on Main Street in North Creek! Ready to move right-in, all fully furnished and equipped with comfortable furnishing, kitchen items, w/ d, ect. Excellent primary residence in the Johnsburg School District: students have complimentary ski privileges!
Key facts
- Fully furnished
- 3,920 sq ft lot
- 3 parking spots
Tags
Neighborhood map
What this means for you Summary
Snapshot
- This is a 4-bed/2.0-bath single-family listed at $275k.
Deal economics
- At list price, monthly cash flow is $26k ($307k/yr) — positive.
- The deal already cash-flows at list — no discount required.
- Meets the 1% rule at list price ($35k rent vs $275k).
- Recommended offer: $258k (6.0% below list) — sets the bar for market timing.
- Cap rate 117.8% vs local median 2.3% in North Creek — top-decile yield for the area; either an underpriced asset or a hidden risk that comps aren't pricing in. Stress-test before assuming the spread holds.
Location & tenants
- Location reads 65/100 on livability (#683 in NY) — a middle-class / working-renter tenant base. Strengths: housing A+, health & safety A+, cost of living B; Watch: schools D+, crime F, amenities F.
- Johnsburg Central School District (rural): math 50% / reading 45% proficiency, ranked #521 of 755 in NY (top 69%) — families likely to look elsewhere, expect single-tenant / working-renter base with shorter leases.
- Market conditions: 33 active listings in the ZIP; 1 comparable units currently listed for rent nearby; 180 units permitted in Warren County in 2024 (40 in 5+ unit buildings).
Forward outlook
- In year one you build about $29k of equity ($2k loan paydown + $28k appreciation (10.0% local appreciation)).
- Warren County population projected at -19% by 2050 — secular population decline; favor cash flow + early exit over multi-decade hold.
- At projected returns (10.0% appreciation + 3.0% rent growth), your $77k cash investment doubles in ~1 year — after that, you're playing with house money.
- By year 2, paydown + projected appreciation supports a ~$47k cash-out refi (75% LTV) — recoverable capital for the next deal without selling this one.
Negotiation context
- It's been on market 85 days — a 6% lower offer ($258k) is reasonable based on typical stale-listing flexibility.
- Current owner paid $125k; list at $275k implies a 120% gain — meaningful room to come down on a strong offer.
Risks & watch-outs
- Watch-outs: built in 1939 — expect roof / HVAC / electrical / plumbing capex.
Questions for the listing agent
- It's been on market 85 days. Have you received any prior offers? Is the seller open to a 6% concession, seller financing, or rate buy-down credit?
- Built in 1939 — when were the roof, HVAC, electrical panel, plumbing, and water heater last replaced?
- Why hasn't it sold? Are there any deal-killer items the seller is aware of (foundation, flood, title, zoning, code violations)?
- Is there a deadline driving the sale (1031 exchange, divorce, estate, relocation)? That informs how much negotiation room exists.
- Schools are D-rated, which usually means shorter tenancies and higher turnover. Who's the typical renter profile here, and what's been the actual vacancy rate?
- Crime grade is F in this area — have there been break-ins, vandalism, or insurance claims at this property in the last 3 years? What carrier currently insures it and at what premium?
- The area grade is low — what's the realistic commute time and amenity access for the typical tenant pool here? Any planned neighborhood developments (good or bad) we should know about?
- What's the average days-on-market for RENTAL listings here right now (not sales)? A rising rental-DOM trend means longer vacancies and softer asking-rent achievability than the comps imply.
- What's the recent tenant-quality profile in this submarket — average credit score on applications, eviction rate, late-payment / NSF rate, and stable-employment percentage? A property-management company in the area should have these aggregated.
- How much new for-sale + rental construction is in the pipeline within 1–3 miles? Heavy new supply typically softens prices + rents 12–24 months out; constrained supply supports both.
Investment metrics
- 1% rule
- 12.65% ✓
- Cap rate
- 117.80%
- Cash-on-cash
- 398.26%
- DSCR
- 18.72
- GRM
- 0.7
CMA / ARV
- ARV (on-the-fly)
- $229,362
- Comps found
- 6
Show comp detail 6 sales within ~0.75 mi
| Address | Dist | Beds/Ba | Sqft | Sold | Price | $/sf | Match |
|---|---|---|---|---|---|---|---|
| 23 Marion Ave | 0.32mi | 4/1.5 | 1,788 (+1%) | 4mo | $235,000 | $131 | 79 |
| 259 Main St | 0.09mi | 4/2.0 | 1,649 (-7%) | 7mo | $210,000 | $127 | 78 |
| 12 Ordway Ln | 0.09mi | 4/3.0 | 1,900 (+7%) | 12mo | $245,000 | $129 | 70 |
| 25 Fairview Ave | 0.26mi | 4/2.0 | 1,968 (+11%) | 15mo | $300,002 | $152 | 58 |
| 8 Byrd Pond Rd | 0.36mi | 4/1.0 | 1,883 (+6%) | 20mo | $83,000 | $44 | 52 |
| 74 Main St | 0.73mi | 3/2.0 (-1) | 1,680 (-6%) | 3mo | $182,500 | $109 | 49 |
Match score weights: distance 35% · size 25% · config 20% · recency 20%. Top-matched comps best support the ARV.
Projected returns pro-forma
10.0% appreciation · 3.0% rent growth · sell at horizon
- IRR
- —
- Equity multiple
- 24.09×
- Total profit
- $1,777,914
- Equity at exit
- $247,742
- IRR
- —
- Equity multiple
- 52.39×
- Total profit
- $3,956,824
- Equity at exit
- $534,265
Cash invested: $77,000 (down + closing). Projections, not guarantees.
Landlord ↔ Tenant lean methodology
- Overall (STATE)
- 15 Strongly Tenant-Friendly
- State New York
- 15 Strongly Tenant-Friendly · D+10
- County
- — inherits STATE
- City
- — inherits STATE
ZIP-level market 12853
- Home prices YoY
- 3.4%
- Active inventory
- 33
- Price-to-rent
- 0.7×
Monthly cashflow live
- Estimated rent
- $34,800 medium interval (Pro) →
- Mortgage (P&I)
- −$1,442
- Tax from tax record
- −$381 /mo · $4,567/yr
- Insurance
- −$115
- HOA
- −$0
- Vacancy / Maint / Mgmt
- −$7,308
- Net cashflow
- $25,555
Break-even live
Sensitivity live
| Price | -10% $25,710 | -5% $25,633 | +0% $25,555 | +5% $25,477 | +10% $25,399 |
|---|---|---|---|---|---|
| Rent | -10% $22,806 | -5% $24,180 | +0% $25,555 | +5% $26,929 | +10% $28,304 |
| Rate | -1.0pp $25,693 | -0.5pp $25,625 | base $25,555 | +0.5pp $25,483 | +1.0pp $25,411 |
UW: 25.0% down · 7.5% · 30yr · 1.5% tax · 5.0% vac · 8.0% maint · 8.0% mgmt
Financing live
Cash to close
- Down payment
- $68,750
- Closing costs
- $8,250
- Reserves months
- —
- Total cash needed
- —
Loan-product check · same deal, 3 products live
Conventional
25% down · 7.5% · 30yr
- Down + closing
- —
- Monthly P&I
- —
- Monthly cashflow
- —
- DSCR
- —
- Eligible?
- —
Personal DTI + credit; lowest rate.
DSCR
20% down · 8.5% · 30yr
- Down + closing
- —
- Monthly P&I
- —
- Monthly cashflow
- —
- DSCR
- —
- Eligible?
- —
No personal income docs; deal must DSCR.
Hard money
10% down · 12.0% · 12mo
- Down + closing
- —
- Monthly P&I
- —
- Monthly cashflow
- —
- DSCR
- —
- Eligible?
- —
Short-term bridge; refi at stabilization.
Rent comps 1 comps
| Address | Beds | Baths | Sqft | Rent | $/sqft | DOM | Units | Dist |
|---|---|---|---|---|---|---|---|---|
| 12 Ordway Ln North Creek, NY | 4.0 | 3.0 | 1900 | $34,800 | $18.32 | 45d | 1 | 0.07mi |
Listing history 4 events
-
2025-12-11status Pending
-
2025-10-14historical Contingent
-
2025-09-16$275,000 Active
-
2017-06-27soldstatus $125,000
ⓘ Source: listings_history table (triggers on properties + properties_extension) + one-shot
backfill from property_details.listing_events for pre-trigger history.
Tax reassessment forecast NY · Partial reset (capped growth)
- Current annual tax
- $4,567 · $381/mo
- Projected year-2 tax
- $4,607 · $384/mo
- Expected delta
- +$40/yr (+$3/mo · 0.9%)
ⓘ Screening estimate from a state-policy table — verify with the county assessor before closing.
Climate risk First Street
- Flood 1/10 Low FEMA zone X · 0% chance over 30 yrs
- Wildfire 3/10 Moderate
- Heat 2/10 Low 8 d/yr ≥90°F today · 18 d/yr by 30 yrs out
- Wind 2/10 Low 2% chance of damaging wind over 30 yrs
- Air quality 1/10 Low 0 unhealthy d/yr today · 0 by 30 yrs out
Nearby sold comps map
Loading sold comps map…
Walkable amenities ~0.75 mi
Loading nearby amenities…
Taxation est. · year 1
- Rental income
- $417,600
- − Mortgage interest
- −$15,404
- − Property taxes
- −$4,567
- − Insurance
- −$1,375
- − Repairs & maintenance
- −$33,408
- − Management
- −$33,408
- − Depreciation
- −$8,000
- Taxable income
- $321,438
- Est. tax owed @ 24.0%
- −$77,145
- After-tax cash flow
- $229,512/yr
For passive investors: Depreciation is non-cash, so a rental often shows a tax loss while cash-flowing — sheltering income. Rental losses are passive: they offset passive income freely, and up to $25,000/yr can offset ordinary (W-2) income if you actively participate and your MAGI is under $100k (phasing out to $0 by $150k); unused losses carry forward. On sale, claimed depreciation is recaptured at up to 25%, and gains may owe capital-gains tax (a 1031 exchange can defer both). Figures are a year-1 estimate at your 24.0% rate — not tax advice; consult a CPA.
Schools (NCES district)
- District
- Johnsburg Central School District
- NCES district ID
- 3615870
- Math proficiency
- 50% ▬ 0.00%
- Reading proficiency
- 45% ▼ -5.00%
- Median HH income
- $45,308
- Composite
- 42.4/100
- National rank
- #6915
- State rank
- #521 of 755 in NY
Livability — North Creek
- Score
- 65/100
- State rank
- #683
- US rank
- #12939
Category grades
Schools grade is shown separately in the Schools card above.
Census & demographics
- Census place
- North Creek, NY
- Population (ZIP)
- 1,384
Population outlook (Warren County) Hauer SSP2
- Today (2025)
- 62,372 people
- By 2030
- 60,491 · -3.0%
- By 2040
- 55,616 · -10.8%
- By 2050
- 50,437 · -19.1%
- By 2075
- 40,843 · -34.5%
- By 2100
- 31,159 · -50.0%
Race, ethnicity, and origin ACS 2023
- Neighborhood character
- Predominantly White (92%)
- Race & ethnicity
- White 92% Asian 3% Two or more races 2% Hispanic / Latino 2%
- Common ancestry
- Lithuanian 11% Slovak 5% Iranian 4%
- Foreign-born
- 1%
- Languages at home
- 99% English-only · Korean 1%
Political lean MEDSL · Warren
- 2024 margin
- Toss-up / Even · D 47.9% · R 52.1%
- 2008→2024 swing
- -6.9pp toward R · 2008: 2.6pp · 2024: -4.2pp
- All cycles
- 2024: R+4.2 2020: R+0.2 2016: R+10.6 2012: D+2.1 2008: D+2.6
Not yet ingested
- Civics
- —
Market trends
- HPI YoY
- ▲ 10.16%
- Current HPI
- 310.7228
- Rent YoY
- —
- Metro
- —
- State GDP YoY
- ▲ 2.60%
- F500 in state
- 92
Industry mix (Fortune 500 HQ in NY)
| Industry | F500 HQs | Revenue |
|---|---|---|
| Financial Services | 10 | $950B |
|
||
| Consumer Goods | 9 | $162B |
|
||
| Insurance | 4 | $225B |
|
||
| Telecommunications | 2 | $144B |
|
||
| Pharmaceuticals | 2 | $112B |
|
||
| Media / Entertainment | 2 | $69B |
|
||
Price history
+120.0% since first listed4 events — show timeline
- 2025-12-11 Pending — Global MLS
- 2025-10-14 Contingent — Global MLS
- 2025-09-16 Listed $275,000 Global MLS
- 2017-06-27 Sold (Public Records) $125,000 Public Records
Property tax history
+5.0%/yrLatest (2025): $4,567 · +61.3% YoY. Source: county tax records.
Cash-flow waterfall
monthlySold comps — $/sqft
last 12 mo · ≤1 miLoading sold comps…