8286 Lockman St · Winona, MO
Flood risk 7/10 · Major
- FEMA flood zone
- —
- Chance of flooding over 30 yrs
- 0.99%
- Est. flood insurance / yr
- —
Fire risk 7/10 · Major
- Est. fire insurance / yr
- $1,054 – $1,958
Heat risk 6/10 · Moderate
- Hot days now (above 106°F)
- 7 days/yr
- Hot days in 30 yrs
- 21 days/yr
Wind risk 2/10 · Minimal
- Chance of severe wind over 30 yrs
- 2.0%
Air-quality risk 1/10 · Minimal
- Unhealthy air days now
- 0 days/yr
- Unhealthy air days in 30 yrs
- 0 days/yr
Risk factors via First Street. Map © Google.
Why this score? — see what drove the C+ grade
The composite is a weighted blend of 9 inputs, each scored 0–100. Each bar is that input's sub-score; the figure is the points it added to the 100-point composite (weight × sub-score).
- Cash flow +24.0/30.0
- Appreciation +7.9/10.0
- DSCR +7.7/10.0
- ARV discount +7.5/15.0
- 1% rule +5.0/10.0
- Schools +3.5/10.0
- Livability +2.7/5.0
- Rent growth +2.5/5.0
- Condition / age +2.5/5.0
$129,900
🖨 Deal sheet 📄 Offer letter ✓ Due diligence
Listing remarks
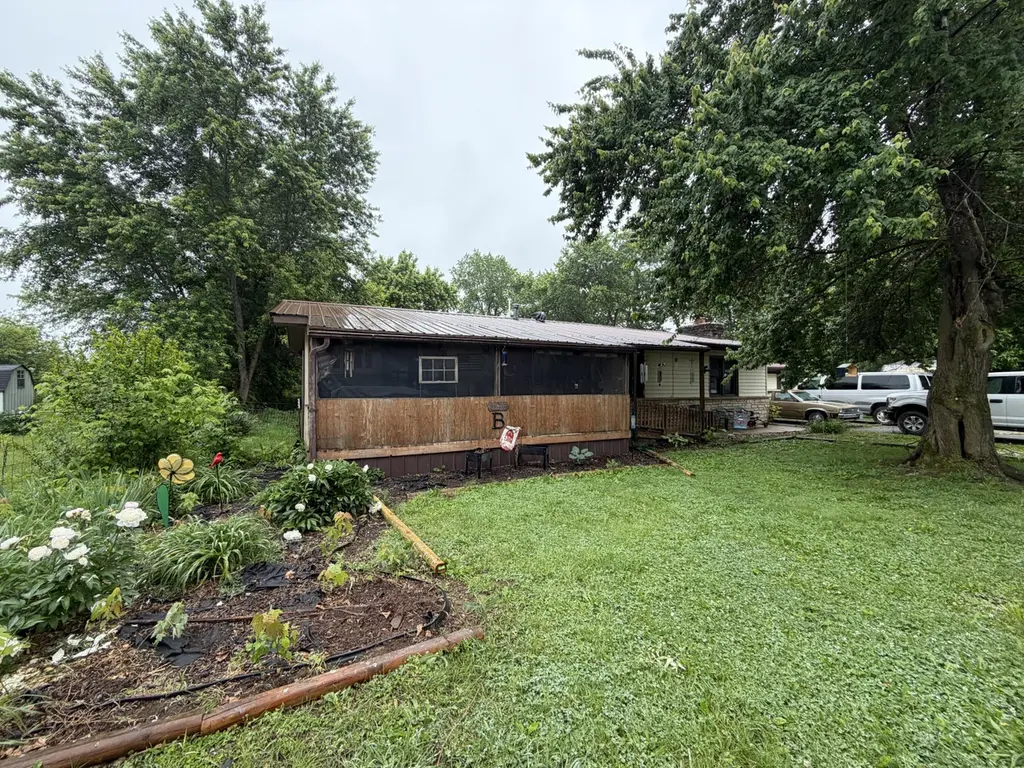
3/4 Bedroom, 2 Bath Home on Corner Lot in Winona, MissouriCharming and spacious home located within walking distance of Winona Schools. This property features original hardwood floors in several rooms, a large family room or optional fourth bedroom, central AC and propane heat, and a fireplace for added comfort. The screened front porch with handicap ramp, back patio, and large fenced backyard offer great outdoor living spaces. Additional highlights include a metal roof, stainless steel side-by-side refrigerator, stove, large utility room with a cellar, and a beautifully landscaped front yard with mature flowers. Situated on a fenced in corner lot. Just ten minutes from Rocky Falls, a beaut
Key facts
- Screened front porch
- Large family room
- Corner lot
Tags
Property features AI
Exterior
- Utilities: Public water; Public sewer; Propane available for utilities
- Home design: Single-family residence; One level
- Construction: Vinyl siding; Block construction; Metal roof
- Exterior features: Patio; Front porch; Screened porch; Chain link fencing; Corner lot; Has view; Asphalt road frontage on a public maintained city street
Interior
- Kitchen: Electric oven; Free-standing electric oven; Refrigerator; Gas water heater
- Flooring: Hardwood floors; Laminate floors
- Bathrooms: 2 full bathrooms
- Heating & cooling: Propane heating; Central heating; Fireplace(s); Central air conditioning; Ceiling fan(s)
- Interior features: Living room fireplace; Ceiling fans; Has central air
- Laundry & utility: Laundry on main level
Neighborhood map
What this means for you Summary
Snapshot
- This is a 4-bed/2.0-bath other listed at $130k.
Deal economics
- At list price, monthly cash flow is $254 ($3k/yr) — positive.
- The deal already cash-flows at list — no discount required.
- Meets the 1% rule at list price ($1k rent vs $130k).
- Recommended offer: $126k (3.0% below list) — sets the bar for market timing.
Location & tenants
- Location reads 53/100 on livability (#808 in MO) — a working-class tenant base; expect higher turnover. Strengths: cost of living A+, housing A+; Watch: crime F, amenities F, commute F.
- Winona R-III (rural): math 37% / reading 48% proficiency, ranked #131 of 324 in MO (top 40%) — families likely to look elsewhere, expect single-tenant / working-renter base with shorter leases; 77% free/reduced lunch — lower-income household profile, screen leases tightly.
- Zoned schools: Winona Elem. (math 41% / reading 47%, grade F, #469 of 1,115 statewide, top 42%, 299 students, 78% FRL); Winona High (math 15% / reading 54%, grade F, #318 of 521 statewide, top 61%, 142 students, 72% FRL) — zoned schools at 75% FRL track the district average.
- Market conditions: 26 active listings in the ZIP.
Forward outlook
- In year one you build about $8k of equity ($898 loan paydown + $7k appreciation (5.7% local appreciation)).
- Shannon County population projected at -23% by 2050 — secular population decline; favor cash flow + early exit over multi-decade hold.
- At projected returns (5.7% appreciation + 3.0% rent growth), your $36k cash investment doubles in ~3 years — after that, you're playing with house money.
- By year 5, paydown + projected appreciation supports a ~$37k cash-out refi (75% LTV) — recoverable capital for the next deal without selling this one.
Negotiation context
- It's been on market 44 days — a 3% lower offer ($126k) is reasonable based on typical stale-listing flexibility.
Risks & watch-outs
- Climate carrying-cost: major flood risk; major wildfire risk; extreme-heat days projected 7→21/yr by 2055 (HVAC capex compounding) — expect insurance premiums to compound above CPI over the hold.
Questions for the listing agent
- It's been on market 44 days. Have you received any prior offers? Is the seller open to a 3% concession, seller financing, or rate buy-down credit?
- Built in 1960 — when were the roof, HVAC, electrical panel, plumbing, and water heater last replaced?
- Is there a deadline driving the sale (1031 exchange, divorce, estate, relocation)? That informs how much negotiation room exists.
- Schools are D-rated, which usually means shorter tenancies and higher turnover. Who's the typical renter profile here, and what's been the actual vacancy rate?
- Crime grade is F in this area — have there been break-ins, vandalism, or insurance claims at this property in the last 3 years? What carrier currently insures it and at what premium?
- What's the average days-on-market for RENTAL listings here right now (not sales)? A rising rental-DOM trend means longer vacancies and softer asking-rent achievability than the comps imply.
- What's the recent tenant-quality profile in this submarket — average credit score on applications, eviction rate, late-payment / NSF rate, and stable-employment percentage? A property-management company in the area should have these aggregated.
- How much new for-sale + rental construction is in the pipeline within 1–3 miles? Heavy new supply typically softens prices + rents 12–24 months out; constrained supply supports both.
Investment metrics
- 1% rule
- 1.00% ✓
- Cap rate
- 8.64%
- Cash-on-cash
- 8.39%
- DSCR
- 1.37
- GRM
- 8.3
CMA / ARV
No comps found within radius.
Projected returns pro-forma
5.74% appreciation · 3.0% rent growth · sell at horizon
- IRR
- 21.7%
- Equity multiple
- 2.42×
- Total profit
- $51,625
- Equity at exit
- $79,515
- IRR
- 20.8%
- Equity multiple
- 4.84×
- Total profit
- $139,621
- Equity at exit
- $142,380
Cash invested: $36,372 (down + closing). Projections, not guarantees.
Landlord ↔ Tenant lean methodology
- Overall (STATE)
- 81 Strongly Landlord-Friendly
- State Missouri
- 81 Strongly Landlord-Friendly · R+10
- County
- — inherits STATE
- City
- — inherits STATE
ZIP-level market 65588
- Home prices YoY
- 3.7%
- Active inventory
- 26
- Price-to-rent
- 8.3×
Monthly cashflow live
- Estimated rent
- $1,299 medium interval (Pro) →
- Mortgage (P&I)
- −$681
- Tax from tax record
- −$37 /mo · $444/yr
- Insurance
- −$54
- HOA
- −$0
- Vacancy / Maint / Mgmt
- −$273
- Net cashflow
- $254
Break-even live
UW: 25.0% down · 7.5% · 30yr · 1.5% tax · 5.0% vac · 8.0% maint · 8.0% mgmt
Financing live
Cash to close
- Down payment
- $32,475
- Closing costs
- $3,897
- Reserves months
- —
- Total cash needed
- —
Loan-product check · same deal, 3 products live
Conventional
25% down · 7.5% · 30yr
- Down + closing
- —
- Monthly P&I
- —
- Monthly cashflow
- —
- DSCR
- —
- Eligible?
- —
Personal DTI + credit; lowest rate.
DSCR
20% down · 8.5% · 30yr
- Down + closing
- —
- Monthly P&I
- —
- Monthly cashflow
- —
- DSCR
- —
- Eligible?
- —
No personal income docs; deal must DSCR.
Hard money
10% down · 12.0% · 12mo
- Down + closing
- —
- Monthly P&I
- —
- Monthly cashflow
- —
- DSCR
- —
- Eligible?
- —
Short-term bridge; refi at stabilization.
Listing history 15 events
-
2026-06-18days on market $129,900 Active 44 DOM
-
2026-06-17days on market $129,900 Active 43 DOM
-
2026-06-16days on market $129,900 Active 42 DOM
-
2026-06-15days on market $129,900 Active 41 DOM
-
2026-06-13days on market $129,900 Active 39 DOM
-
2026-06-12days on market $129,900 Active 38 DOM
-
2026-06-09days on market $129,900 Active 35 DOM
-
2026-06-08days on market $129,900 Active 34 DOM
-
2026-06-07days on market $129,900 Active 33 DOM
-
2026-06-07days on market $129,900 Active 32 DOM
-
2026-06-04days on market $129,900 Active 29 DOM
-
2026-06-02days on market $129,900 Active 28 DOM
-
2026-06-01days on market $129,900 Active 27 DOM
-
2026-05-31days on market $129,900 Active 26 DOM
-
2026-05-05$129,900 Active 1035-char remark
ⓘ Source: listings_history table (triggers on properties + properties_extension) + one-shot
backfill from property_details.listing_events for pre-trigger history.
Tax reassessment forecast MO · Resets to sale price
- Current annual tax
- $444 · $37/mo
- Projected year-2 tax
- $1,260 · $105/mo
- Expected delta
- +$816/yr (+$68/mo · 183.8%)
ⓘ Screening estimate from a state-policy table — verify with the county assessor before closing.
Climate risk First Street
- Flood 7/10 Severe 99% chance over 30 yrs
- Wildfire 7/10 Severe
- Heat 6/10 Major 7 d/yr ≥106°F today · 21 d/yr by 30 yrs out
- Wind 2/10 Low 2% chance of damaging wind over 30 yrs
- Air quality 1/10 Low 0 unhealthy d/yr today · 0 by 30 yrs out
Nearby sold comps map
Loading sold comps map…
Walkable amenities ~0.75 mi
Loading nearby amenities…
Taxation est. · year 1
- Rental income
- $15,594
- − Mortgage interest
- −$7,276
- − Property taxes
- −$444
- − Insurance
- −$650
- − Repairs & maintenance
- −$1,248
- − Management
- −$1,248
- − Depreciation
- −$3,779
- Taxable income
- $950
- Est. tax owed @ 24.0%
- −$228
- After-tax cash flow
- $2,823/yr
For passive investors: Depreciation is non-cash, so a rental often shows a tax loss while cash-flowing — sheltering income. Rental losses are passive: they offset passive income freely, and up to $25,000/yr can offset ordinary (W-2) income if you actively participate and your MAGI is under $100k (phasing out to $0 by $150k); unused losses carry forward. On sale, claimed depreciation is recaptured at up to 25%, and gains may owe capital-gains tax (a 1031 exchange can defer both). Figures are a year-1 estimate at your 24.0% rate — not tax advice; consult a CPA.
Schools (NCES district)
- District
- Winona R-III
- NCES district ID
- 2932220
- Math proficiency
- 37% ▼ -16.00%
- Reading proficiency
- 48% ▬ 0.00%
- Median HH income
- $31,522
- Composite
- 34.76/100
- National rank
- #5128
- State rank
- #131 of 324 in MO
Livability — Winona
- Score
- 53/100
- State rank
- #808
- US rank
- #24256
Category grades
Schools grade is shown separately in the Schools card above.
Census & demographics
- Census place
- Winona, MO
- Population (ZIP)
- 2,025
Population outlook (Shannon County) Hauer SSP2
- Today (2025)
- 7,703 people
- By 2030
- 7,355 · -4.5%
- By 2040
- 6,637 · -13.8%
- By 2050
- 5,898 · -23.4%
- By 2075
- 4,407 · -42.8%
- By 2100
- 3,037 · -60.6%
Race, ethnicity, and origin ACS 2023
- Neighborhood character
- Predominantly White (88%)
- Race & ethnicity
- White 88% Two or more races 9% Hispanic / Latino 2% Asian 1%
- Common ancestry
- Serbian 3% Lithuanian 2% Romanian 1%
- Foreign-born
- 2% · Vietnam
- Languages at home
- 98% English-only · Vietnamese 1%
Political lean MEDSL · Shannon
- 2024 margin
- Solid R (+68.3) · D 15.6% · R 83.8%
- 2008→2024 swing
- -56.9pp toward R · 2008: -11.4pp · 2024: -68.3pp
- All cycles
- 2024: R+68.3 2020: R+63.0 2016: R+56.1 2012: R+26.0 2008: R+11.4
Not yet ingested
- Civics
- —
Market trends
- HPI YoY
- ▲ 5.74%
- Current HPI
- 160.0993
- Rent YoY
- —
- Metro
- —
- State GDP YoY
- ▲ 1.84%
- F500 in state
- 20
Industry mix (Fortune 500 HQ in MO)
| Industry | F500 HQs | Revenue |
|---|---|---|
| Healthcare | 1 | $163B |
|
||
| Insurance | 1 | $21B |
|
||
| Industrial Technology | 1 | $17B |
|
||
| Retail | 1 | $16B |
|
||
| Industrial Distribution | 1 | $10B |
|
||
| Utilities | 1 | $9B |
|
||
Price history
1 event — show timeline
- 2026-05-05 Listed $129,900 SOMO
Property tax history
+2.4%/yrLatest (2024): $444 · +0.0% YoY. Source: county tax records.
Cash-flow waterfall
monthlySold comps — $/sqft
last 12 mo · ≤1 miLoading sold comps…