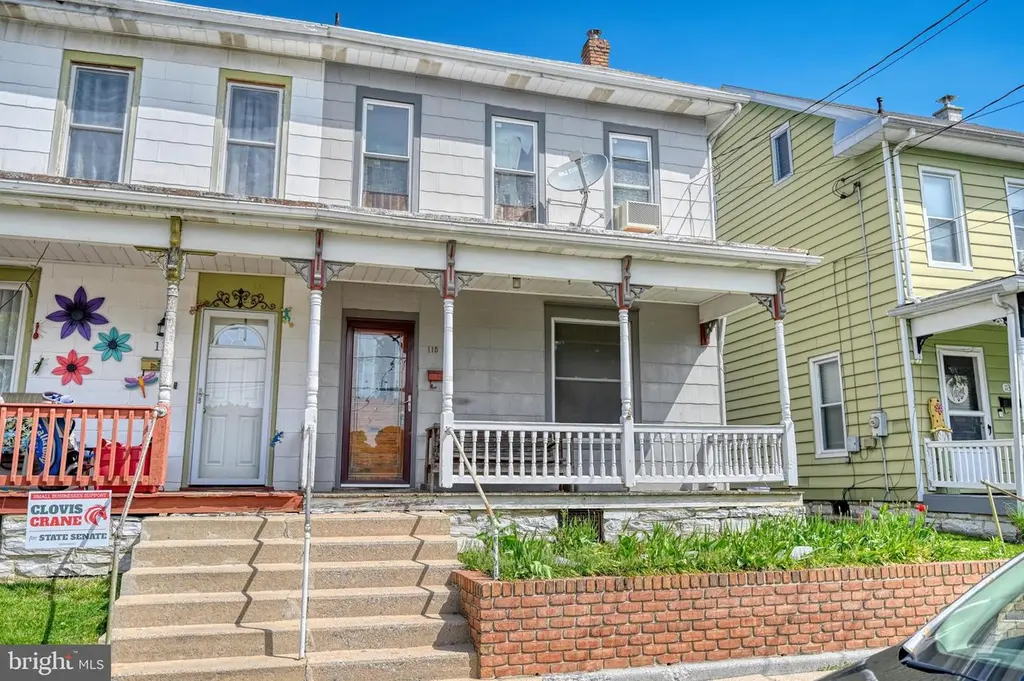
115 W Carpenter Ave · Myerstown, PA
Flood risk 1/10 · Minimal
- FEMA flood zone
- X (unshaded)
- Chance of flooding over 30 yrs
- 0.0%
- Est. flood insurance / yr
- $473 – $860
Fire risk 1/10 · Minimal
- Est. fire insurance / yr
- $511 – $949
Heat risk 5/10 · Moderate
- Hot days now (above 99°F)
- 7 days/yr
- Hot days in 30 yrs
- 15 days/yr
Wind risk 4/10 · Minor
- Chance of severe wind over 30 yrs
- 11.0%
Air-quality risk 2/10 · Minimal
- Unhealthy air days now
- 1 days/yr
- Unhealthy air days in 30 yrs
- 3 days/yr
Risk factors via First Street. Map © Google.
Why this score? — see what drove the B- grade
The composite is a weighted blend of 9 inputs, each scored 0–100. Each bar is that input's sub-score; the figure is the points it added to the 100-point composite (weight × sub-score).
- Cash flow +30.0/30.0
- 1% rule +10.0/10.0
- DSCR +10.0/10.0
- ARV discount +7.5/15.0
- Livability +3.7/5.0
- Schools +3.4/10.0
- Rent growth +2.5/5.0
- Condition / age +2.5/5.0
- Appreciation +0.0/10.0
$69,999
🖨 Deal sheet 📄 Offer letter ✓ Due diligence
Listing remarks
PUBLIC AUCTION to be held ON-SITE Tuesday, May 12th at 5PM! Potential abound! Calling all investors! 3 BR, 1.5 Bath home with detached garage. Kleinfelter's Auction Terms - 10% Down Day of Sale. Buyer to pay for the Deed Prep, Both Sides of Transfer Tax and a 10% Buyers Premium. Being Sold AS-IS. Please call to schedule your showing today!
Key facts
- Garage
- Built 1904
- Listed 28 days
Property features AI
Exterior
- Parking: Detached rear-entry oversized garage (1 car); Off-street parking
- Utilities: Public water; Public sewer; 200+ amp electric service; Domestic hot water with oil and S/W changeover
- Home design: Semi-detached property
- Construction: Mixed construction materials; Permanent foundation; Above-grade and below-grade structures
- Exterior features: Not in a federal flood zone
Interior
- Kitchen: Kitchen (appliances not specified in data)
- Bedrooms: Three bedrooms on the upper level
- Flooring: Wood flooring; Tile/brick flooring
- Bathrooms: One full bathroom (upper level); One half bathroom (main level)
- Heating & cooling: Hot water heating; Oil-fired heating fuel; Window air conditioning units; Electric cooling power (window units)
- Interior features: Full basement with interior access and outside entrance; Assessor-listed living area source
- Laundry & utility: Main-floor laundry
Neighborhood map
What this means for you Summary
Snapshot
- This is a 3-bed/1.5-bath townhouse listed at $70k.
Deal economics
- At list price, monthly cash flow is $790 ($9k/yr) — positive.
- The deal already cash-flows at list — no discount required.
- Meets the 1% rule at list price ($2k rent vs $70k).
- Recommended offer: $69k (1.5% below list) — sets the bar for market timing.
Location & tenants
- Location reads 74/100 on livability (#491 in PA, #4,518 nationally) — a middle-class / working-renter tenant base. Strengths: crime A+, cost of living A+, housing A+; Watch: amenities F, commute F, employment D-.
- Eastern Lebanon County SD (rural): math 27% / reading 50% proficiency, ranked #360 of 539 in PA (top 67%) — families likely to look elsewhere, expect single-tenant / working-renter base with shorter leases.
- Market conditions: 65 active listings in the ZIP; 315 units permitted in Lebanon County in 2024 (36 in 5+ unit buildings).
Forward outlook
- Local home prices are declining (-3.0%/yr); year-one equity from $484 of loan paydown is wiped out by about $2k of value loss. Plan a longer hold.
- Lebanon County population projected at +10% by 2050 — modest demand growth; plan on rents tracking national, not racing it.
- At projected returns (-3.0% appreciation + 3.0% rent growth), your $20k cash investment doubles in ~3 years — after that, you're playing with house money.
Negotiation context
- It's been on market 28 days — a 2% lower offer ($69k) is reasonable based on typical stale-listing flexibility.
Risks & watch-outs
- Watch-outs: property tax is 3.8% of price; built in 1904 — expect roof / HVAC / electrical / plumbing capex.
- Climate carrying-cost: extreme-heat days projected 7→15/yr by 2055 (HVAC capex compounding) — expect insurance premiums to compound above CPI over the hold.
Questions for the listing agent
- Built in 1904 — when were the roof, HVAC, electrical panel, plumbing, and water heater last replaced?
- Property tax is high relative to price — has the assessment been appealed recently, and will the sale trigger a re-assessment?
- Is there a deadline driving the sale (1031 exchange, divorce, estate, relocation)? That informs how much negotiation room exists.
- What's the average days-on-market for RENTAL listings here right now (not sales)? A rising rental-DOM trend means longer vacancies and softer asking-rent achievability than the comps imply.
- What's the recent tenant-quality profile in this submarket — average credit score on applications, eviction rate, late-payment / NSF rate, and stable-employment percentage? A property-management company in the area should have these aggregated.
- How much new for-sale + rental construction is in the pipeline within 1–3 miles? Heavy new supply typically softens prices + rents 12–24 months out; constrained supply supports both.
Investment metrics
- 1% rule
- 2.55% ✓
- Cap rate
- 19.83%
- Cash-on-cash
- 48.36%
- DSCR
- 3.15
- GRM
- 3.3
CMA / ARV
- ARV (median comp)
- $181,462
- List price
- $69,999
- Delta
- -61.42%
- Verdict
- UNDERPRICED
- Comps
- 20 within 1.0 mi
Show comp detail 12 sales within ~0.75 mi
| Address | Dist | Beds/Ba | Sqft | Sold | Price | $/sf | Match |
|---|---|---|---|---|---|---|---|
| 314 W Main Ave | 0.26mi | 3/1.5 | 1,368 (-2%) | 4mo | $200,000 | $146 | 81 |
| 312 W Main Ave | 0.26mi | 3/1.5 | 1,464 (+5%) | 6mo | $180,500 | $123 | 75 |
| 306 S Cherry St | 0.38mi | 3/1.5 | 1,415 (+1%) | 12mo | $218,000 | $154 | 70 |
| 324 S Broad St | 0.48mi | 3/1.5 | 1,372 (-2%) | 6mo | $280,000 | $204 | 70 |
| 20 E Carpenter Ave | 0.29mi | 3/2.0 | 1,396 (-0%) | 20mo | $200,000 | $143 | 67 |
| 16 W Maple Ave | 0.27mi | 3/1.5 | 1,290 (-8%) | 10mo | $180,000 | $140 | 66 |
| 136 W Washington Ave | 0.16mi | 3/1.0 | 1,494 (+7%) | 19mo | $133,888 | $90 | 63 |
| 109 E Mill Ave | 0.46mi | 2/1.5 (-1) | 1,380 (-1%) | 11mo | $220,000 | $159 | 62 |
| 317 S Broad St | 0.45mi | 3/1.5 | 1,200 (-14%) | 5mo | $199,900 | $167 | 51 |
| 8 E Richland Ave | 0.57mi | 3/1.0 | 1,318 (-6%) | 13mo | $175,000 | $133 | 51 |
| 309 S Railroad St | 0.28mi | 4/2.0 (+1) | 1,578 (+13%) | 19mo | $210,000 | $133 | 42 |
| 229 E Main Ave | 0.47mi | 2/1.5 (-1) | 1,584 (+13%) | 16mo | $196,000 | $124 | 38 |
Match score weights: distance 35% · size 25% · config 20% · recency 20%. Top-matched comps best support the ARV.
Projected returns pro-forma
-3.0% appreciation · 3.0% rent growth · sell at horizon
- IRR
- 45.9%
- Equity multiple
- 2.99×
- Total profit
- $39,077
- Equity at exit
- $10,437
- IRR
- 51.8%
- Equity multiple
- 6.06×
- Total profit
- $99,255
- Equity at exit
- $6,052
Cash invested: $19,600 (down + closing). Projections, not guarantees.
Landlord ↔ Tenant lean methodology
- Overall (STATE)
- 62 Landlord-Friendly
- State Pennsylvania
- 62 Landlord-Friendly · EVEN
- County
- — inherits STATE
- City
- — inherits STATE
ZIP-level market 17067
- Active inventory
- 65
- Price-to-rent
- 3.3×
Monthly cashflow live
- Estimated rent
- $1,783 medium interval (Pro) →
- Mortgage (P&I)
- −$367
- Tax from tax record
- −$222 /mo · $2,668/yr
- Insurance
- −$29
- HOA
- −$0
- Vacancy / Maint / Mgmt
- −$374
- Net cashflow
- $790
Break-even live
UW: 25.0% down · 7.5% · 30yr · 1.5% tax · 5.0% vac · 8.0% maint · 8.0% mgmt
Financing live
Cash to close
- Down payment
- $17,500
- Closing costs
- $2,100
- Reserves months
- —
- Total cash needed
- —
Loan-product check · same deal, 3 products live
Conventional
25% down · 7.5% · 30yr
- Down + closing
- —
- Monthly P&I
- —
- Monthly cashflow
- —
- DSCR
- —
- Eligible?
- —
Personal DTI + credit; lowest rate.
DSCR
20% down · 8.5% · 30yr
- Down + closing
- —
- Monthly P&I
- —
- Monthly cashflow
- —
- DSCR
- —
- Eligible?
- —
No personal income docs; deal must DSCR.
Hard money
10% down · 12.0% · 12mo
- Down + closing
- —
- Monthly P&I
- —
- Monthly cashflow
- —
- DSCR
- —
- Eligible?
- —
Short-term bridge; refi at stabilization.
Listing history 1 events
-
2026-05-01$69,999 Active 343-char remark
ⓘ Source: listings_history table (triggers on properties + properties_extension) + one-shot
backfill from property_details.listing_events for pre-trigger history.
Tax reassessment forecast PA · Partial reset (capped growth)
- Current annual tax
- $2,668 · $222/mo
- Projected year-2 tax
- $2,668 · $222/mo
- Expected delta
- $0/yr ($0/mo · 0.0%)
ⓘ Screening estimate from a state-policy table — verify with the county assessor before closing.
Climate risk First Street
- Flood 1/10 Low FEMA zone X (unshaded) · 0% chance over 30 yrs
- Wildfire 1/10 Low
- Heat 5/10 Major 7 d/yr ≥99°F today · 15 d/yr by 30 yrs out
- Wind 4/10 Moderate 11% chance of damaging wind over 30 yrs
- Air quality 2/10 Low 1 unhealthy d/yr today · 3 by 30 yrs out
Nearby sold comps map
Loading sold comps map…
Walkable amenities ~0.75 mi
Loading nearby amenities…
Taxation est. · year 1
- Rental income
- $21,394
- − Mortgage interest
- −$3,921
- − Property taxes
- −$2,668
- − Insurance
- −$350
- − Repairs & maintenance
- −$1,712
- − Management
- −$1,712
- − Depreciation
- −$2,036
- Taxable income
- $8,996
- Est. tax owed @ 24.0%
- −$2,159
- After-tax cash flow
- $7,320/yr
For passive investors: Depreciation is non-cash, so a rental often shows a tax loss while cash-flowing — sheltering income. Rental losses are passive: they offset passive income freely, and up to $25,000/yr can offset ordinary (W-2) income if you actively participate and your MAGI is under $100k (phasing out to $0 by $150k); unused losses carry forward. On sale, claimed depreciation is recaptured at up to 25%, and gains may owe capital-gains tax (a 1031 exchange can defer both). Figures are a year-1 estimate at your 24.0% rate — not tax advice; consult a CPA.
Schools (NCES district)
- District
- Eastern Lebanon County SD
- NCES district ID
- 4208460
- Math proficiency
- 27% ▼ -14.00%
- Reading proficiency
- 50% ▼ -9.00%
- Median HH income
- $56,026
- Composite
- 33.74/100
- National rank
- #5371
- State rank
- #360 of 539 in PA
Livability — Myerstown
- Score
- 74/100
- State rank
- #491
- US rank
- #4518
Category grades
Schools grade is shown separately in the Schools card above.
Census & demographics
- Census place
- Myerstown, PA
- Population (ZIP)
- 15,985
Population outlook (Lebanon County) Hauer SSP2
- Today (2025)
- 144,806 people
- By 2030
- 147,534 · +1.9%
- By 2040
- 152,952 · +5.6%
- By 2050
- 159,406 · +10.1%
- By 2075
- 181,736 · +25.5%
- By 2100
- 198,402 · +37.0%
Race, ethnicity, and origin ACS 2023
- Neighborhood character
- Predominantly White (94%)
- Race & ethnicity
- White 94% Hispanic / Latino 3% Black 2% Two or more races 1%
- Common ancestry
- Polish 3% Slovak 2% Italian 2%
- Foreign-born
- 1% · Canada
- Languages at home
- 93% English-only · German/W. Germanic 5% Spanish 2%
Political lean MEDSL · Lebanon
- 2024 margin
- Solid R (+32.0) · D 33.6% · R 65.5%
- 2008→2024 swing
- -13.1pp toward R · 2008: -18.9pp · 2024: -32.0pp
- All cycles
- 2024: R+32.0 2020: R+31.7 2016: R+35.5 2012: R+28.0 2008: R+18.9
Not yet ingested
- Civics
- —
Market trends
- HPI YoY
- ▼ -178.88%
- Current HPI
- 252.0994
- Rent YoY
- —
- Metro
- —
- State GDP YoY
- ▲ 1.68%
- F500 in state
- 34
Industry mix (Fortune 500 HQ in PA)
| Industry | F500 HQs | Revenue |
|---|---|---|
| Healthcare | 2 | $309B |
|
||
| Insurance | 2 | $27B |
|
||
| Telecommunications / Media | 1 | $124B |
|
||
| Industrial Distribution | 1 | $22B |
|
||
| Financial Services | 1 | $20B |
|
||
| Chemicals / Materials | 1 | $18B |
|
||
Price history
2 events — show timeline
- 2026-05-29 Pending — BRIGHT MLS
- 2026-05-01 Listed $69,999 BRIGHT MLS
Property tax history
+3.6%/yrLatest (2026): $2,668 · +3.9% YoY. Source: county tax records.
Cash-flow waterfall
monthlySold comps — $/sqft
last 12 mo · ≤1 miLoading sold comps…