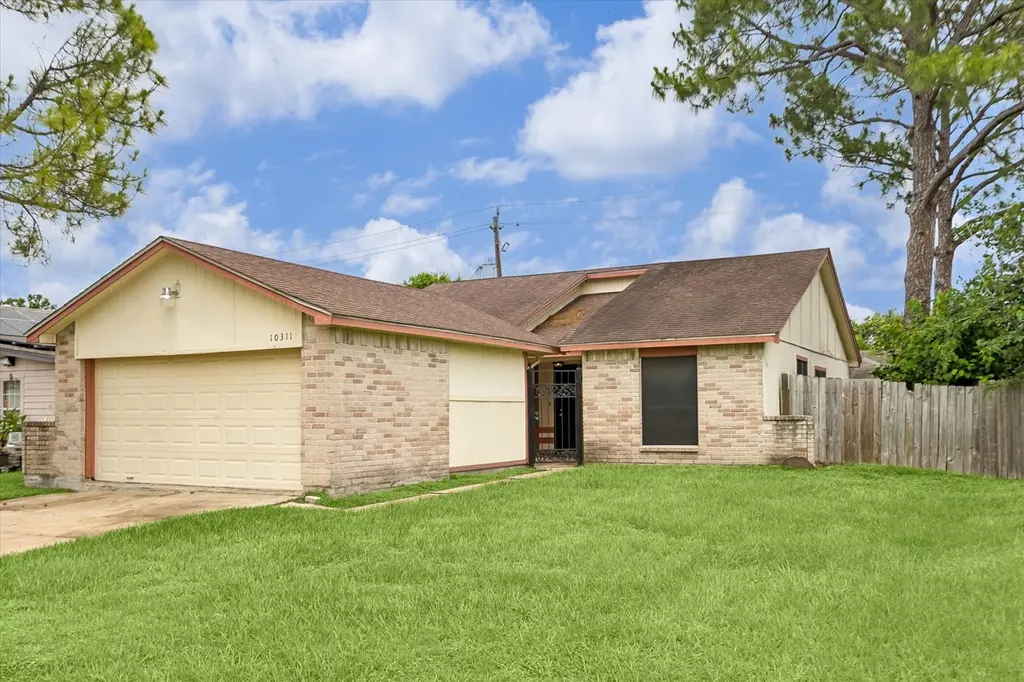
10311 Westedge Dr · Houston, TX
Flood risk 6/10 · Moderate
- FEMA flood zone
- X (unshaded)
- Chance of flooding over 30 yrs
- 0.69%
- Est. flood insurance / yr
- $507 – $1,088
Fire risk 1/10 · Minimal
- Est. fire insurance / yr
- $1,222 – $2,270
Heat risk 9/10 · Severe
- Hot days now (above 110°F)
- 7 days/yr
- Hot days in 30 yrs
- 23 days/yr
Wind risk 9/10 · Severe
- Chance of severe wind over 30 yrs
- 99.0%
Air-quality risk 2/10 · Minimal
- Unhealthy air days now
- 2 days/yr
- Unhealthy air days in 30 yrs
- 2 days/yr
Risk factors via First Street. Map © Google.
Why this score? — see what drove the C- grade
The composite is a weighted blend of 9 inputs, each scored 0–100. Each bar is that input's sub-score; the figure is the points it added to the 100-point composite (weight × sub-score).
- ARV discount +15.0/15.0
- Cash flow +13.5/30.0
- 1% rule +4.7/10.0
- Schools +4.5/10.0
- DSCR +4.1/10.0
- Livability +3.7/5.0
- Rent growth +2.7/5.0
- Condition / age +2.5/5.0
- Appreciation +0.0/10.0
$185,000
🖨 Deal sheet 📄 Offer letter ✓ Due diligence
Listing remarks
Welcome home to this charming Sugar Land gem! Freshly painted with soaring ceilings and tons of natural light, this home offers a warm and inviting layout perfect for relaxing or entertaining. Enjoy cozy evenings by the fireplace, spacious bedrooms, and a private backyard ideal for gatherings or quiet mornings outdoors. Located in a well-established neighborhood with easy access to shopping, dining, and top-rated schools. This one is a MUST SEE!!!
Key facts
- Private backyard
- Top-rated schools
- 6,242 sq ft lot
Tags
Property features AI
Finance
- Other:
- Financial info:
- HOA & community: Townewest / Sterling Association with an annual fee of $402
Exterior
- Parking: 2-car garage
- Security:
- Utilities: Public water; Public sewer
- Home design: Residential property; Built in 1981; Slab foundation
- Construction: Brick, cement siding, and wood siding construction; Composition roof
- Exterior features: Subdivision lot
Interior
- Kitchen:
- Bedrooms:
- Flooring:
- Bathrooms: 2 full bathrooms
- Heating & cooling: Central electric heating; Central air conditioning (electric)
- Interior features: One fireplace; 4 total rooms
- Laundry & utility:
Neighborhood map
What this means for you Summary
Snapshot
- This is a 3-bed/2.0-bath single-family listed at $185k.
Deal economics
- At list price, monthly cash flow is $5 ($65/yr) — positive.
- The deal already cash-flows at list — no discount required.
- To meet the 1% rule (rent ≥ 1% of price), the offer needs to be $179k (3.1% below list).
- Recommended offer: $179k (3.1% below list) — sets the bar for 1% rule.
- Cap rate 6.3% vs local median 3.2% in Houston — top-decile yield for the area; either an underpriced asset or a hidden risk that comps aren't pricing in. Stress-test before assuming the spread holds.
Location & tenants
- Location reads 74/100 on livability (#184 in TX, #4,771 nationally) — a middle-class / working-renter tenant base. Strengths: amenities A+, cost of living A+, housing A+; Watch: crime F.
- Fort Bend ISD (suburban): math 44% / reading 53% proficiency, ranked #140 of 826 in TX (top 17%) — families likely to look elsewhere, expect single-tenant / working-renter base with shorter leases.
- Zoned schools: Townewest El (math 25% / reading 31%, grade F, #2,740 of 4,322 statewide, top 64%, 543 students, 88% FRL); Sugar Land Middle (math 30% / reading 40%, grade F, #842 of 1,662 statewide, top 51%, 1,050 students, 65% FRL); Kempner H S (math 35% / reading 56%, grade D-, #634 of 1,632 statewide, top 39%, 1,945 students, 62% FRL) — zoned schools average 72% FRL vs 35% district-wide (37 pts higher); higher-poverty schools than district average — tighter screening recommended.
- Zoned-school proficiency averages 36% at this address vs 48% district-wide (-12 pts) — the specific schools serving this property underperform the Fort Bend ISD average; the district grade overstates school quality for this exact location.
- Market conditions: Rents flat; 277 active listings in the ZIP; 18 comparable units currently listed for rent nearby; rentals at typical pace (median 22d on market — plan ~3-4 weeks tenant-placement turnaround); solid renter incomes; 12,093 units permitted in Fort Bend County in 2024 (815 in 5+ unit buildings).
Forward outlook
- Local home prices are declining (-3.0%/yr); year-one equity from $1k of loan paydown is wiped out by about $6k of value loss. Plan a longer hold.
- Fort Bend County population projected at +75% by 2050 — long-run rental-demand tailwind backs the buy-and-hold thesis.
Negotiation context
- It's been on market 17 days — a 2% lower offer ($182k) is reasonable based on typical stale-listing flexibility.
- 3 sale attempts since 12y ago with the ask held roughly flat each time — persistent listings suggest the price (not the market) is what's stuck; bring a comps-based counter.
Risks & watch-outs
- Climate carrying-cost: major flood risk; severe wind risk, 99% chance of damaging wind over 30y; extreme-heat days projected 7→23/yr by 2055 (HVAC capex compounding) — expect insurance premiums to compound above CPI over the hold.
Questions for the listing agent
- What does the HOA fee cover, when was the last increase, and are there any pending special assessments or reserve-fund shortfalls?
- Is there a deadline driving the sale (1031 exchange, divorce, estate, relocation)? That informs how much negotiation room exists.
- Schools are D-rated, which usually means shorter tenancies and higher turnover. Who's the typical renter profile here, and what's been the actual vacancy rate?
- Crime grade is F in this area — have there been break-ins, vandalism, or insurance claims at this property in the last 3 years? What carrier currently insures it and at what premium?
- What's the average days-on-market for RENTAL listings here right now (not sales)? A rising rental-DOM trend means longer vacancies and softer asking-rent achievability than the comps imply.
- What's the recent tenant-quality profile in this submarket — average credit score on applications, eviction rate, late-payment / NSF rate, and stable-employment percentage? A property-management company in the area should have these aggregated.
- How much new for-sale + rental construction is in the pipeline within 1–3 miles? Heavy new supply typically softens prices + rents 12–24 months out; constrained supply supports both.
Investment metrics
- 1% rule
- 0.97% ✗
- Cap rate
- 6.33%
- Cash-on-cash
- 0.12%
- DSCR
- 1.01
- GRM
- 8.6
CMA / ARV
- ARV (median comp)
- $230,211
- List price
- $185,000
- Delta
- -19.64%
- Verdict
- UNDERPRICED
- Comps
- 20 within 1.0 mi
Show comp detail 12 sales within ~0.75 mi
| Address | Dist | Beds/Ba | Sqft | Sold | Price | $/sf | Match |
|---|---|---|---|---|---|---|---|
| 10311 Westedge Dr | 0.00mi | 3/2.0 | 1,175 (0%) | 1mo | $185,000 | $157 | 99 |
| 10327 Hollow Canyon Ct | 0.06mi | 3/2.0 | 1,171 (-0%) | 9mo | $250,000 | $213 | 89 |
| 10018 King Ranch Ln | 0.23mi | 3/2.0 | 1,171 (-0%) | 6mo | $215,000 | $184 | 83 |
| 14010 Towneway Dr | 0.20mi | 3/2.0 | 1,129 (-4%) | 5mo | $209,900 | $186 | 80 |
| 14110 Towne Way Dr | 0.25mi | 3/1.5 | 1,122 (-4%) | 4mo | $219,975 | $196 | 75 |
| 14038 Towne Way Dr | 0.21mi | 3/2.0 | 1,039 (-12%) | 9mo | $219,900 | $212 | 64 |
| 10918 Spanish Grant Dr | 0.66mi | 3/2.0 | 1,138 (-3%) | 4mo | $189,000 | $166 | 61 |
| 9903 Kent Towne Ln | 0.50mi | 3/2.0 | 1,296 (+10%) | 4mo | $209,000 | $161 | 56 |
| 10734 Parkland Woods | 0.57mi | 3/2.0 | 1,059 (-10%) | 2mo | $189,000 | $178 | 55 |
| 13719 Southline Rd | 0.64mi | 3/2.0 | 1,296 (+10%) | 3mo | $224,900 | $174 | 50 |
| 14318 Moorfield Dr | 0.68mi | 3/2.0 | 1,342 (+14%) | 4mo | $229,000 | $171 | 41 |
| 14003 Clear Forest Dr | 0.74mi | 2/2.0 (-1) | 999 (-15%) | 9mo | $224,990 | $225 | 28 |
Match score weights: distance 35% · size 25% · config 20% · recency 20%. Top-matched comps best support the ARV.
Projected returns pro-forma
-3.0% appreciation · 0.61% rent growth · sell at horizon
- IRR
- -19.0%
- Equity multiple
- 0.35×
- Total profit
- $-33,738
- Equity at exit
- $27,584
- IRR
- -18.1%
- Equity multiple
- 0.13×
- Total profit
- $-44,970
- Equity at exit
- $15,995
Cash invested: $51,800 (down + closing). Projections, not guarantees.
Landlord ↔ Tenant lean methodology
- Overall (STATE)
- 87 Strongly Landlord-Friendly
- State Texas
- 87 Strongly Landlord-Friendly · R+5
- County
- — inherits STATE
- City
- — inherits STATE
ZIP-level market 77498
- Home prices YoY
- -10.6%
- Rents YoY
- 0.6%
- Active inventory
- 277
- Price-to-rent
- 8.6×
Monthly cashflow live
- Estimated rent
- $1,793 high interval (Pro) →
- Mortgage (P&I)
- −$970
- Tax from tax record
- −$330 /mo · $3,959/yr
- Insurance
- −$77
- HOA
- −$34
- Vacancy / Maint / Mgmt
- −$377
- Net cashflow
- $5
Break-even live
UW: 25.0% down · 7.5% · 30yr · 1.5% tax · 5.0% vac · 8.0% maint · 8.0% mgmt
Financing live
Cash to close
- Down payment
- $46,250
- Closing costs
- $5,550
- Reserves months
- —
- Total cash needed
- —
Loan-product check · same deal, 3 products live
Conventional
25% down · 7.5% · 30yr
- Down + closing
- —
- Monthly P&I
- —
- Monthly cashflow
- —
- DSCR
- —
- Eligible?
- —
Personal DTI + credit; lowest rate.
DSCR
20% down · 8.5% · 30yr
- Down + closing
- —
- Monthly P&I
- —
- Monthly cashflow
- —
- DSCR
- —
- Eligible?
- —
No personal income docs; deal must DSCR.
Hard money
10% down · 12.0% · 12mo
- Down + closing
- —
- Monthly P&I
- —
- Monthly cashflow
- —
- DSCR
- —
- Eligible?
- —
Short-term bridge; refi at stabilization.
Rent comps 18 comps
| Address | Beds | Baths | Sqft | Rent | $/sqft | DOM | Units | Dist |
|---|---|---|---|---|---|---|---|---|
| 10111 King Ranch Ln Sugar Land, TX | 3.0 | 2.0 | 1419 | $1,850 | $1.30 | 20d | 1 | 0.16mi |
| 14402 W Bellfort Ave Unit 22258 Sugar Land, TX | 2.0 | 2.0 | 1358 | $1,475 | $1.09 | 43d | 1 | 0.44mi |
| 14402 W Bellfort Ave Unit 28654 Sugar Land, TX | 2.0 | 2.0 | 1360 | $1,488 | $1.09 | 43d | 1 | 0.44mi |
| 14402 W Bellfort Apt 424 Sugar Land, TX | 2.0 | 2.0 | 1053 | $1,619 | $1.54 | 5d | 1 | 0.47mi |
| 14402 W Bellfort Unit 2148 Sugar Land, TX | 2.0 | 2.0 | 1053 | $1,611 | $1.53 | 3d | 1 | 0.47mi |
| 14402 W Bellfort Unit 2174 Sugar Land, TX | 2.0 | 2.0 | 1053 | $1,643 | $1.56 | 10d | 1 | 0.47mi |
| 14402 W Bellfort Unit 14439 Sugar Land, TX | 2.0 | 2.0 | 1053 | $1,654 | $1.57 | 43d | 1 | 0.47mi |
| 14402 W Bellfort St Sugar Land, TX | 2.0 | 2.0 | 1053 | $1,577 | $1.50 | 22d | 1 | 0.47mi |
| 10411 Cedartowne Ln Sugar Land, TX | 3.0 | 2.0 | 1296 | $1,756 | $1.35 | 22d | 1 | 0.52mi |
| 10810 Lakewood Oaks Dr Sugar Land, TX | 3.0 | 2.0 | 1059 | $1,641 | $1.55 | 43d | 1 | 0.61mi |
| 10723 Forest Leaf Dr Sugar Land, TX | 3.0 | 2.0 | 1171 | $1,800 | $1.54 | 43d | 1 | 0.68mi |
| 10811 Forest Leaf Dr Sugar Land, TX | 3.0 | 2.0 | 1383 | $1,766 | $1.28 | 43d | 1 | 0.73mi |
| 14007 Florence Rd Sugar Land, TX | 2.0 | 2.0 | 1053 | $1,577 | $1.50 | 11d | 1 | 0.79mi |
| 13106 W Bellfort Ave Houston, TX | 2.0 | 2.0 | 1098 | $1,485 | $1.35 | 43d | 1 | 1.34mi |
| 9402 Synott Rd Unit 421 Houston, TX | 2.0 | 2.0 | 825 | $1,100 | $1.33 | 7d | 1 | 1.36mi |
| 9402 Synott Rd Unit 9429 Houston, TX | 2.0 | 2.0 | 825 | $1,092 | $1.32 | 3d | 1 | 1.36mi |
| 13100 W Bellfort Ave Houston, TX | 1.0–3.0 | 1.0–2.0 | 1021 | $2,152 | $2.11 | 1d | 28 | 1.42mi |
| 15000 W Airport Blvd Sugar Land, TX | 1.0–3.0 | 1.0–2.0 | 1001 | $1,885 | $1.88 | 1d | 14 | 1.44mi |
HOA detail
- Monthly dues
- $34 · $408/yr
Listing history 11 events
-
2026-05-10$185,000 Active 451-char remark
-
2024-12-05historical $1,750
-
2024-10-09price $1,750
-
2024-09-14$1,850
-
2014-12-04soldstatus
-
2014-11-06historical
-
2014-11-05soldstatus
-
2014-11-05$78,520 Active
-
2003-01-24soldstatus
-
2002-12-03soldstatus
-
1998-12-08soldstatus
ⓘ Source: listings_history table (triggers on properties + properties_extension) + one-shot
backfill from property_details.listing_events for pre-trigger history.
Tax reassessment forecast TX · Resets to sale price
- Current annual tax
- $3,959 · $330/mo
- Projected year-2 tax
- $3,959 · $330/mo
- Expected delta
- $0/yr ($0/mo · 0.0%)
ⓘ Screening estimate from a state-policy table — verify with the county assessor before closing.
Climate risk First Street
- Flood 6/10 Major FEMA zone X (unshaded) · 69% chance over 30 yrs
- Wildfire 1/10 Low
- Heat 9/10 Extreme 7 d/yr ≥110°F today · 23 d/yr by 30 yrs out
- Wind 9/10 Extreme 99% chance of damaging wind over 30 yrs
- Air quality 2/10 Low 2 unhealthy d/yr today · 2 by 30 yrs out
Nearby sold comps map
Loading sold comps map…
Walkable amenities ~0.75 mi
Loading nearby amenities…
Taxation est. · year 1
- Rental income
- $21,517
- − Mortgage interest
- −$10,363
- − Property taxes
- −$3,959
- − Insurance
- −$925
- − Repairs & maintenance
- −$1,721
- − Management
- −$1,721
- − HOA
- −$408
- − Depreciation
- −$5,382
- Taxable loss
- −$2,962
- Est. tax savings @ 24.0%
- +$711
- After-tax cash flow
- $776/yr
For passive investors: Depreciation is non-cash, so a rental often shows a tax loss while cash-flowing — sheltering income. Rental losses are passive: they offset passive income freely, and up to $25,000/yr can offset ordinary (W-2) income if you actively participate and your MAGI is under $100k (phasing out to $0 by $150k); unused losses carry forward. On sale, claimed depreciation is recaptured at up to 25%, and gains may owe capital-gains tax (a 1031 exchange can defer both). Figures are a year-1 estimate at your 24.0% rate — not tax advice; consult a CPA.
Schools (NCES district)
- District
- Fort Bend ISD
- NCES district ID
- 4819650
- Math proficiency
- 44% ▼ -15.00%
- Reading proficiency
- 53% ▼ -4.00%
- Median HH income
- $82,360
- Composite
- 44.61/100
- National rank
- #2779
- State rank
- #140 of 826 in TX
Livability — Houston
- Score
- 74/100
- State rank
- #184
- US rank
- #4771
Category grades
Schools grade is shown separately in the Schools card above.
Census & demographics
- County
- Fort Bend County · 836,777 people
- City population
- 3,226,434
- Metro
- Houston-The Woodlands-Sugar Land, TX
- Population (ZIP)
- 52,806
- Household income
- $100,950
- Rent vs Own
- Severe rent burden
- 1252.0
Population outlook (Fort Bend County) Hauer SSP2
- Today (2025)
- 1,004,526 people
- By 2030
- 1,153,104 · +14.8%
- By 2040
- 1,453,718 · +44.7%
- By 2050
- 1,753,781 · +74.6%
- By 2075
- 2,455,772 · +144.5%
- By 2100
- 2,930,528 · +191.7%
Race, ethnicity, and origin ACS 2023
- Neighborhood character
- Highly diverse neighborhood (Simpson 0.76)
- Race & ethnicity
- Asian 28% White 27% Hispanic / Latino 22% Black 20% Two or more races 9%
- Hispanic origin (detail)
- Mexican 14%
- Common ancestry
- Italian 1% Ukrainian 1% Arab 1%
- Foreign-born
- 33% · Canada, Vietnam, China
- Languages at home
- 47% English-only · Spanish 18% Other Indo-European 10% Vietnamese 7%
Political lean MEDSL · Fort Bend
- 2024 margin
- Toss-up / Even · D 49.5% · R 47.9% · Other 2.6%
- 2008→2024 swing
- +4.0pp toward D · 2008: -2.4pp · 2024: 1.6pp
- All cycles
- 2024: D+1.6 2020: D+10.6 2016: D+6.6 2012: R+6.8 2008: R+2.4
Not yet ingested
- Civics
- —
Market trends
- HPI YoY
- ▼ -29.01%
- Current HPI
- 245.1437
- Rent YoY
- ▲ 0.61%
- Metro
- Houston-The Woodlands-Sugar Land, TX
- State GDP YoY
- ▲ 3.95%
- F500 in state
- 110
Industry mix (Fortune 500 HQ in TX)
| Industry | F500 HQs | Revenue |
|---|---|---|
| Energy | 16 | $1,198B |
|
||
| Technology | 5 | $198B |
|
||
| Engineering / Construction | 4 | $72B |
|
||
| Energy Services | 3 | $60B |
|
||
| Utilities | 3 | $41B |
|
||
| Healthcare | 2 | $330B |
|
||
Price history
+135.6% since first listed13 events — show timeline
- 2026-05-29 Sold (MLS) — HARMLS
- 2026-05-27 Pending — HARMLS
- 2026-05-10 Listed $185,000 HARMLS
- 2024-12-05 Rental Removed $1,750 HARMLS
- 2024-10-09 Price Changed $1,750 HARMLS
- 2024-09-14 Listed for Rent $1,850 HARMLS
- 2014-12-04 Sold (Public Records) — Public Records
- 2014-11-06 Listing Removed — HARMLS
- 2014-11-05 Sold (Public Records) — Public Records
- 2014-11-05 Listed $78,520 HARMLS
- 2003-01-24 Sold (Public Records) — Public Records
- 2002-12-03 Sold (Public Records) — Public Records
- 1998-12-08 Sold (Public Records) — Public Records
Property tax history
+4.4%/yrLatest (2025): $3,959 · -6.5% YoY. Source: county tax records.
Cash-flow waterfall
monthlySold comps — $/sqft
last 12 mo · ≤1 miLoading sold comps…