 Fourplex
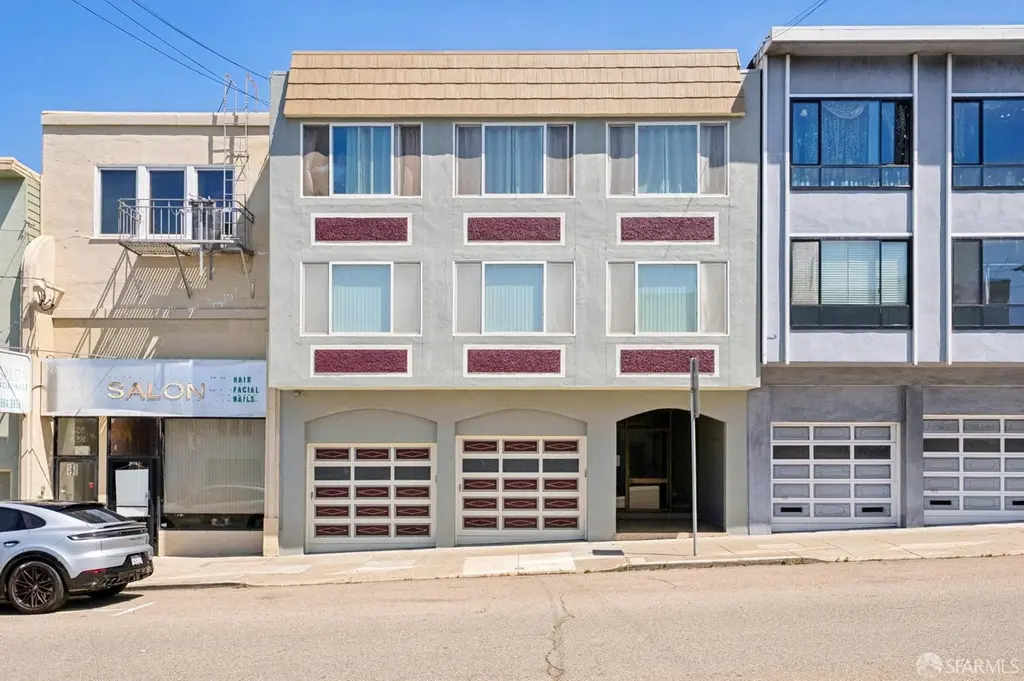
420 Taraval St · San Francisco, CA
Flood risk 1/10 · Minimal
- FEMA flood zone
- X (unshaded)
- Chance of flooding over 30 yrs
- 0.0%
- Est. flood insurance / yr
- $507 – $1,088
Fire risk 1/10 · Minimal
- Est. fire insurance / yr
- $659 – $1,223
Heat risk 1/10 · Minimal
- Hot days now (above 76°F)
- 7 days/yr
- Hot days in 30 yrs
- 16 days/yr
Wind risk 1/10 · Minimal
- Chance of severe wind over 30 yrs
- —
Air-quality risk 7/10 · Major
- Unhealthy air days now
- 12 days/yr
- Unhealthy air days in 30 yrs
- 12 days/yr
Risk factors via First Street. Map © Google.
Why this score? — see what drove the C grade
The composite is a weighted blend of 9 inputs, each scored 0–100. Each bar is that input's sub-score; the figure is the points it added to the 100-point composite (weight × sub-score).
- Cash flow +21.3/30.0
- ARV discount +7.5/15.0
- DSCR +6.8/10.0
- 1% rule +5.5/10.0
- Schools +5.0/10.0
- Livability +3.8/5.0
- Rent growth +2.8/5.0
- Condition / age +2.5/5.0
- Appreciation +0.0/10.0
$1,575,000
🖨 Deal sheet 📄 Offer letter ✓ Due diligence
Multi-family units
County records classify this as Multi-Family (5+ Unit). Listing-text estimate: 4 units. estimate disagrees with records
5+ unit building — per-unit beds/baths from public records are typically unavailable; the breakdown below (if shown) is an estimate from the listing text.
Listing remarks
Constructed in 1971, this four unit building offers an exceptional investment opportunity. Upon entry, you are welcomed by a bright and well-maintained lobby with classic terrazzo flooring. The property consists of four spacious 2 bedroom, 1.5 bathroom units, each featuring an identical floor plan with expansive kitchen and living room combinations, high ceilings, and abundant natural light. The upper front unit enjoys Ocean views. The large garage provides independent parking for four cars, and a coin-operated laundry is located at the rear of the garage for tenant convenience. Tenants also enjoy access to a terraced backyard. Each unit is separately metered for gas and electricity and equ
Key facts
- Terraced backyard
- Ocean views
- Terrazzo flooring
Tags
Property features AI
Finance
- Financial info: Four total units (all apartments); four units currently leased
- HOA & community: No association fee
Exterior
- Parking: Garage parking for 4 cars; 4 covered parking spaces (total 4 parking spaces)
- Home design: Residential income property: Quadruplex; Single building with four apartment units; Built in 1971
- Construction: Year built 1971
- Exterior features: Lot approximately 3,184 sq ft
Interior
- Bedrooms: 8 total bedrooms across the property (unit-level bedrooms: four 2-bedroom units)
- Bathrooms: 8 total bathrooms (4 full, 4 partial)
- Interior features: Coin-operated laundry
- Laundry & utility: Coin-operated laundry
Neighborhood map
What this means for you Summary
Snapshot
- This is a 4 × 2.0-bed/1.5-bath units multifamily listed at $1.57M.
Deal economics
- At list price, monthly cash flow is $2k ($28k/yr) — positive. Per door: $578/mo.
- The deal already cash-flows at list — no discount required.
- Meets the 1% rule at list price ($17k rent vs $1.57M).
- Recommended offer: $1.55M (1.5% below list) — sets the bar for market timing.
- Cap rate 8.1% vs local median 2.1% in San Francisco — top-decile yield for the area; either an underpriced asset or a hidden risk that comps aren't pricing in. Stress-test before assuming the spread holds.
Location & tenants
- Location reads 76/100 on livability (#90 in CA, #3,143 nationally) — a middle-class / working-renter tenant base. Strengths: amenities A+, commute A+, employment A+; Watch: crime F, cost of living F.
- San Francisco Unified (urban): math 50% / reading 56% proficiency, ranked #322 of 1,400 in CA (top 23%) — acceptable for families but not a draw, mixed tenant base, ~2y average lease.
- Market conditions: Rents rising (+1.0%/yr); 48 active listings in the ZIP; high-income renter base; 750 units permitted in San Francisco County in 2024 (688 in 5+ unit buildings).
- At $16,569/mo this rent would consume 125% of the median local household income ($159k/yr) (locally 655% of renters already pay >50% of income on rent) — very limited rent-growth headroom before tenants either downsize or default.
Forward outlook
- Local home prices are declining (-3.0%/yr); year-one equity from $11k of loan paydown is wiped out by about $47k of value loss. Plan a longer hold.
- San Francisco County population projected at +39% by 2050 — long-run rental-demand tailwind backs the buy-and-hold thesis.
Negotiation context
- It's been on market 20 days — a 2% lower offer ($1.55M) is reasonable based on typical stale-listing flexibility.
- 3 sale attempts since 18y ago with the ask held roughly flat each time — persistent listings suggest the price (not the market) is what's stuck; bring a comps-based counter.
Questions for the listing agent
- Can we see the unit-by-unit rent roll, current vacancy, and any below-market leases? What's the average tenancy length?
- What capital expenditures (roof, boiler, parking lot, exteriors) have been made in the last 5 years, and what's planned in the next 2?
- Built in 1971 — when were the roof, HVAC, electrical panel, plumbing, and water heater last replaced?
- Is there a deadline driving the sale (1031 exchange, divorce, estate, relocation)? That informs how much negotiation room exists.
- Schools are B-rated — typically a magnet for longer-tenancy family renters. What's the average tenant stay here, and is there a school-zone premium baked into asking?
- Crime grade is F in this area — have there been break-ins, vandalism, or insurance claims at this property in the last 3 years? What carrier currently insures it and at what premium?
- What's the average days-on-market for RENTAL listings here right now (not sales)? A rising rental-DOM trend means longer vacancies and softer asking-rent achievability than the comps imply.
- What's the recent tenant-quality profile in this submarket — average credit score on applications, eviction rate, late-payment / NSF rate, and stable-employment percentage? A property-management company in the area should have these aggregated.
- How much new apartment / multifamily construction is in the pipeline within 1–3 miles? Heavy new supply (>2% of stock underway) typically softens rents 12–24 months out; light construction supports rent growth.
Investment metrics
- 1% rule
- 1.05% ✓
- Cap rate
- 8.05%
- Cash-on-cash
- 6.29%
- DSCR
- 1.28
- GRM
- 7.9
CMA / ARV
No comps found within radius.
Projected returns pro-forma
-3.0% appreciation · 1.0% rent growth · sell at horizon
- IRR
- -8.9%
- Equity multiple
- 0.68×
- Total profit
- $-140,440
- Equity at exit
- $234,838
- IRR
- -2.2%
- Equity multiple
- 0.86×
- Total profit
- $-60,759
- Equity at exit
- $136,177
Cash invested: $441,000 (down + closing). Projections, not guarantees.
Landlord ↔ Tenant lean methodology
- Overall (CITY)
- 0 Strongly Tenant-Friendly
- State California
- 18 Strongly Tenant-Friendly · D+13
- County
- — inherits STATE
- City San Francisco
- 0 Strongly Tenant-Friendly · D+57
ZIP-level market 94116
- Rents YoY
- 1.0%
- Active inventory
- 48
- Price-to-rent
- 31.7×
Monthly cashflow live
- Estimated rent
- $16,569 high interval (Pro) →
- Mortgage (P&I)
- −$8,259
- Tax from tax record
- −$1,861 /mo · $22,335/yr
- Insurance
- −$656
- HOA
- −$0
- Vacancy / Maint / Mgmt
- −$3,479
- Net cashflow
- $2,313
Break-even live
4-unit breakdown (identical units grouped — click to expand)
| Units | Beds | Baths | Est. rent |
|---|---|---|---|
| 4× units | 2.0 | 1.5 | $16,568 |
| #1 | 2.0 | 1.5 | $4,142 |
| #2 | 2.0 | 1.5 | $4,142 |
| #3 | 2.0 | 1.5 | $4,142 |
| #4 | 2.0 | 1.5 | $4,142 |
| Total (4 units) | $16,569 | ||
UW: 25.0% down · 7.5% · 30yr · 1.5% tax · 5.0% vac · 8.0% maint · 8.0% mgmt
Financing live
Cash to close
- Down payment
- $393,750
- Closing costs
- $47,250
- Reserves months
- —
- Total cash needed
- —
Loan-product check · same deal, 3 products live
Conventional
25% down · 7.5% · 30yr
- Down + closing
- —
- Monthly P&I
- —
- Monthly cashflow
- —
- DSCR
- —
- Eligible?
- —
Personal DTI + credit; lowest rate.
DSCR
20% down · 8.5% · 30yr
- Down + closing
- —
- Monthly P&I
- —
- Monthly cashflow
- —
- DSCR
- —
- Eligible?
- —
No personal income docs; deal must DSCR.
Hard money
10% down · 12.0% · 12mo
- Down + closing
- —
- Monthly P&I
- —
- Monthly cashflow
- —
- DSCR
- —
- Eligible?
- —
Short-term bridge; refi at stabilization.
Listing history 14 events
-
2026-06-18days on market $1,575,000 Active 20 DOM
-
2026-06-17days on market $1,575,000 Active 19 DOM
-
2026-06-16days on market $1,575,000 Active 18 DOM
-
2026-06-15days on market $1,575,000 Active 17 DOM
-
2026-06-13days on market $1,575,000 Active 15 DOM
-
2026-06-13days on market $1,575,000 Active 14 DOM
-
2026-06-09days on market $1,575,000 Active 11 DOM
-
2026-06-08days on market $1,575,000 Active 10 DOM
-
2026-06-07days on market $1,575,000 Active 9 DOM
-
2026-06-04days on market $1,575,000 Active 6 DOM
-
2026-06-03days on market $1,575,000 Active 5 DOM
-
2026-06-02days on market $1,575,000 Active 4 DOM
-
2026-06-01days on market $1,575,000 Active 3 DOM
-
2026-05-31days on market $1,575,000 Active 2 DOM
ⓘ Source: listings_history table (triggers on properties + properties_extension) + one-shot
backfill from property_details.listing_events for pre-trigger history.
Tax reassessment forecast CA · Resets to sale price
- Current annual tax
- $22,335 · $1,861/mo
- Projected year-2 tax
- $22,335 · $1,861/mo
- Expected delta
- $0/yr ($0/mo · 0.0%)
ⓘ Screening estimate from a state-policy table — verify with the county assessor before closing.
Climate risk First Street
- Flood 1/10 Low FEMA zone X (unshaded) · 0% chance over 30 yrs
- Wildfire 1/10 Low
- Heat 1/10 Low 7 d/yr ≥76°F today · 16 d/yr by 30 yrs out
- Wind 1/10 Low
- Air quality 7/10 Severe 12 unhealthy d/yr today · 12 by 30 yrs out
Nearby sold comps map
Loading sold comps map…
Walkable amenities ~0.75 mi
Loading nearby amenities…
Taxation est. · year 1
- Rental income
- $198,828
- − Mortgage interest
- −$88,224
- − Property taxes
- −$22,335
- − Insurance
- −$7,875
- − Repairs & maintenance
- −$15,906
- − Management
- −$15,906
- − Depreciation
- −$45,818
- Taxable income
- $2,763
- Est. tax owed @ 24.0%
- −$663
- After-tax cash flow
- $27,087/yr
For passive investors: Depreciation is non-cash, so a rental often shows a tax loss while cash-flowing — sheltering income. Rental losses are passive: they offset passive income freely, and up to $25,000/yr can offset ordinary (W-2) income if you actively participate and your MAGI is under $100k (phasing out to $0 by $150k); unused losses carry forward. On sale, claimed depreciation is recaptured at up to 25%, and gains may owe capital-gains tax (a 1031 exchange can defer both). Figures are a year-1 estimate at your 24.0% rate — not tax advice; consult a CPA.
Schools (NCES district)
- District
- San Francisco Unified
- NCES district ID
- 0634410
- Math proficiency
- 50% ▬ 0.00%
- Reading proficiency
- 56% ▲ 1.00%
- Median HH income
- $81,249
- Composite
- 50.14/100
- National rank
- #4088
- State rank
- #322 of 1400 in CA
Livability — San Francisco
- Score
- 76/100
- State rank
- #90
- US rank
- #3143
Category grades
Schools grade is shown separately in the Schools card above.
Census & demographics
- Census place
- San Francisco, CA
- County
- San Francisco County · 827,552 people
- City population
- 827,552
- Metro
- San Francisco-Oakland-Berkeley, CA
- Population (ZIP)
- 43,791
- Household income
- $158,921
- Rent vs Own
- Severe rent burden
- 655.0
Population outlook (San Francisco County) Hauer SSP2
- Today (2025)
- 1,030,936 people
- By 2030
- 1,110,409 · +7.7%
- By 2040
- 1,270,010 · +23.2%
- By 2050
- 1,435,001 · +39.2%
- By 2075
- 1,779,074 · +72.6%
- By 2100
- 1,966,767 · +90.8%
Race, ethnicity, and origin ACS 2023
- Neighborhood character
- Diverse neighborhood (Simpson 0.61)
- Race & ethnicity
- Asian 55% White 29% Two or more races 10% Hispanic / Latino 7% Black 1%
- Hispanic origin (detail)
- Mexican 3%
- Common ancestry
- Subsaharan African 1% Lithuanian 1% Slovak 1%
- Foreign-born
- 39% · China, Vietnam, Canada
- Languages at home
- 51% English-only · Chinese 31% Spanish 4% Tagalog/Filipino 3%
Political lean MEDSL · San Francisco
- 2024 margin
- Solid D (+64.8) · D 80.3% · R 15.5% · Other 4.1%
- 2008→2024 swing
- -5.7pp toward R · 2008: 70.5pp · 2024: 64.8pp
- All cycles
- 2024: D+64.8 2020: D+72.5 2016: D+76.1 2012: D+70.2 2008: D+70.5
Not yet ingested
- Civics
- —
Market trends
- HPI YoY
- ▼ -1124.37%
- Current HPI
- 322.0756
- Rent YoY
- ▲ 1.00%
- Metro
- San Francisco-Oakland-Berkeley, CA
- State GDP YoY
- ▲ 3.21%
- F500 in state
- 116
Industry mix (Fortune 500 HQ in CA)
| Industry | F500 HQs | Revenue |
|---|---|---|
| Technology | 27 | $1,492B |
|
||
| Financial Services | 3 | $174B |
|
||
| Retail | 3 | $44B |
|
||
| Insurance | 3 | $26B |
|
||
| Media / Entertainment | 2 | $115B |
|
||
| Pharmaceuticals / Biotech | 2 | $62B |
|
||
Price history
+5.0% since first listed5 events — show timeline
- 2026-05-29 Listed $1,575,000 San Francisco MLS
- 2024-03-14 Rental Removed $3,300 APPFOLIO
- 2024-01-20 Listed for Rent $3,300 APPFOLIO
- 2008-10-03 Sold (Public Records) $1,375,000 Public Records
- 2008-06-25 Listed $1,500,000 San Francisco MLS
Property tax history
+5.4%/yrLatest (2025): $22,335 · +3.0% YoY. Source: county tax records.
Cash-flow waterfall
monthlySold comps — $/sqft
last 12 mo · ≤1 miLoading sold comps…