1779 W Creek Rd · Newark Valley, NY
Flood risk No data
- FEMA flood zone
- —
- Chance of flooding over 30 yrs
- —
- Est. flood insurance / yr
- —
Fire risk No data
- Est. fire insurance / yr
- —
Heat risk No data
- Hot days now (above threshold)
- —
- Hot days in 30 yrs
- —
Wind risk No data
- Chance of severe wind over 30 yrs
- —
Air-quality risk No data
- Unhealthy air days now
- —
- Unhealthy air days in 30 yrs
- —
Risk factors via First Street. Map © Google.
Why this score? — see what drove the B grade
The composite is a weighted blend of 9 inputs, each scored 0–100. Each bar is that input's sub-score; the figure is the points it added to the 100-point composite (weight × sub-score).
- Cash flow +26.2/30.0
- DSCR +8.9/10.0
- Appreciation +8.6/10.0
- ARV discount +7.5/15.0
- 1% rule +6.6/10.0
- Schools +5.3/10.0
- Livability +3.5/5.0
- Rent growth +2.5/5.0
- Condition / age +2.5/5.0
$79,900
🖨 Deal sheet 📄 Offer letter ✓ Due diligence
Listing remarks
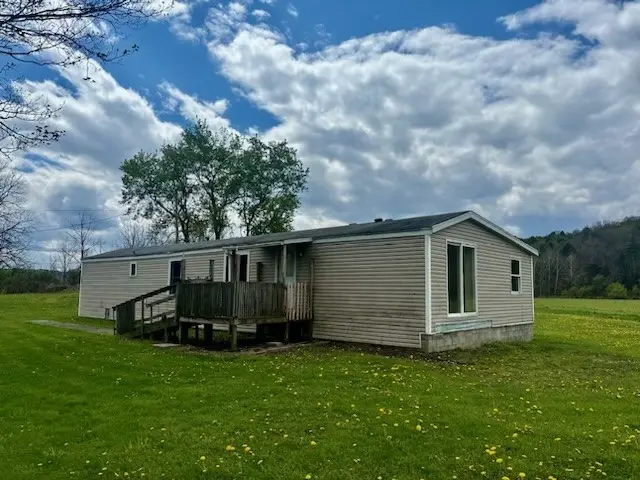
Nice country setting on this manufactured home with 3.6 beautiful acres. You can own for less than renting! Great investment, put some work in the house and it will become a great property. The acreage is level and all usable, ideal for a large garden, livestock or to add additional structures. Located just under 10 minutes to Owego. This property is selling in "as-is" condition.
Key facts
- 3.6 acres
- Large garden
- Level acreage
Tags
Property features AI
Exterior
- Parking: Detached garage; Driveway; Gravel parking
- Utilities: Well water; Septic tank
- Home design: Single-wide mobile home; One-story
- Construction: Vinyl siding; Block and pier/pillar/post foundation
- Exterior features: Deck; Rectangular lot
Interior
- Kitchen: Appliances not otherwise specified
- Bedrooms: 2 bedrooms on the main level
- Flooring: Tile, vinyl, and varying flooring
- Bathrooms: 1 full bathroom on the main level
- Heating & cooling: Oil-fired forced air heating
- Interior features: Electric water heater; No basement; 6 total rooms
- Laundry & utility: Utilities include well water and septic (see Utilities section)
Neighborhood map
What this means for you Summary
Snapshot
- This is a 2-bed/1.0-bath manufactured listed at $80k.
Deal economics
- At list price, monthly cash flow is $205 ($2k/yr) — positive.
- The deal already cash-flows at list — no discount required.
- Meets the 1% rule at list price ($925 rent vs $80k).
- Recommended offer: $78k (3.0% below list) — sets the bar for market timing.
Location & tenants
- Location reads 70/100 on livability (#462 in NY) — a middle-class / working-renter tenant base. Strengths: cost of living A+, housing A+, employment B; Watch: health & safety D, crime F, amenities F.
- Owego-Apalachin Central School District (town): math 62% / reading 62% proficiency, ranked #204 of 590 in NY (top 35%) — acceptable for families but not a draw, mixed tenant base, ~2y average lease.
- Market conditions: 12 active listings in the ZIP; 139 units permitted in Tioga County in 2024 (65 in 5+ unit buildings).
Forward outlook
- In year one you build about $6k of equity ($552 loan paydown + $6k appreciation (7.3% local appreciation)).
- Tioga County population projected at -27% by 2050 — secular population decline; favor cash flow + early exit over multi-decade hold.
- At projected returns (7.3% appreciation + 3.0% rent growth), your $22k cash investment doubles in ~3 years — after that, you're playing with house money.
- By year 6, paydown + projected appreciation supports a ~$35k cash-out refi (75% LTV) — recoverable capital for the next deal without selling this one.
Negotiation context
- It's been on market 44 days — a 3% lower offer ($78k) is reasonable based on typical stale-listing flexibility.
- 3 sale attempts with the ask held roughly flat each time — persistent listings suggest the price (not the market) is what's stuck; bring a comps-based counter.
Questions for the listing agent
- It's been on market 44 days. Have you received any prior offers? Is the seller open to a 3% concession, seller financing, or rate buy-down credit?
- Is there a deadline driving the sale (1031 exchange, divorce, estate, relocation)? That informs how much negotiation room exists.
- Crime grade is F in this area — have there been break-ins, vandalism, or insurance claims at this property in the last 3 years? What carrier currently insures it and at what premium?
- What's the average days-on-market for RENTAL listings here right now (not sales)? A rising rental-DOM trend means longer vacancies and softer asking-rent achievability than the comps imply.
- What's the recent tenant-quality profile in this submarket — average credit score on applications, eviction rate, late-payment / NSF rate, and stable-employment percentage? A property-management company in the area should have these aggregated.
- How much new for-sale + rental construction is in the pipeline within 1–3 miles? Heavy new supply typically softens prices + rents 12–24 months out; constrained supply supports both.
Investment metrics
- 1% rule
- 1.16% ✓
- Cap rate
- 9.37%
- Cash-on-cash
- 10.99%
- DSCR
- 1.49
- GRM
- 7.2
CMA / ARV
No comps found within radius.
Projected returns pro-forma
7.29% appreciation · 3.0% rent growth · sell at horizon
- IRR
- 27.1%
- Equity multiple
- 2.89×
- Total profit
- $42,357
- Equity at exit
- $56,871
- IRR
- 24.7%
- Equity multiple
- 6.06×
- Total profit
- $113,233
- Equity at exit
- $109,417
Cash invested: $22,372 (down + closing). Projections, not guarantees.
Landlord ↔ Tenant lean methodology
- Overall (STATE)
- 15 Strongly Tenant-Friendly
- State New York
- 15 Strongly Tenant-Friendly · D+10
- County
- — inherits STATE
- City
- — inherits STATE
ZIP-level market 13811
- Home prices YoY
- 2.9%
- Active inventory
- 12
- Price-to-rent
- 7.2×
Monthly cashflow live
- Estimated rent
- $925 medium interval (Pro) →
- Mortgage (P&I)
- −$419
- Tax from tax record
- −$74 /mo · $884/yr
- Insurance
- −$33
- HOA
- −$0
- Vacancy / Maint / Mgmt
- −$194
- Net cashflow
- $205
Break-even live
UW: 25.0% down · 7.5% · 30yr · 1.5% tax · 5.0% vac · 8.0% maint · 8.0% mgmt
Financing live
Cash to close
- Down payment
- $19,975
- Closing costs
- $2,397
- Reserves months
- —
- Total cash needed
- —
Loan-product check · same deal, 3 products live
Conventional
25% down · 7.5% · 30yr
- Down + closing
- —
- Monthly P&I
- —
- Monthly cashflow
- —
- DSCR
- —
- Eligible?
- —
Personal DTI + credit; lowest rate.
DSCR
20% down · 8.5% · 30yr
- Down + closing
- —
- Monthly P&I
- —
- Monthly cashflow
- —
- DSCR
- —
- Eligible?
- —
No personal income docs; deal must DSCR.
Hard money
10% down · 12.0% · 12mo
- Down + closing
- —
- Monthly P&I
- —
- Monthly cashflow
- —
- DSCR
- —
- Eligible?
- —
Short-term bridge; refi at stabilization.
Listing history 21 events
-
2026-06-19days on market $79,900 Active 44 DOM
-
2026-06-18days on market $79,900 Active 43 DOM
-
2026-06-17days on market $79,900 Active 42 DOM
-
2026-06-16days on market $79,900 Active 41 DOM
-
2026-06-15days on market $79,900 Active 40 DOM
-
2026-06-14days on market $79,900 Active 38 DOM
-
2026-06-13days on market $79,900 Active 37 DOM
-
2026-06-10days on market $79,900 Active 35 DOM
-
2026-06-09days on market $79,900 Active 34 DOM
-
2026-06-08days on market $79,900 Active 33 DOM
-
2026-06-07days on market $79,900 Active 32 DOM
-
2026-06-05days on market $79,900 Active 29 DOM
-
2026-06-03days on market $79,900 Active 28 DOM
-
2026-06-02days on market $79,900 Active 27 DOM
-
2026-06-01days on market $79,900 Active 26 DOM
-
2026-05-31days on market $79,900 Active 25 DOM
-
2026-05-30days on market $79,900 Active 24 DOM
-
2026-05-06$79,900 Active 392-char remark
-
2025-11-10status Active
-
2025-10-30status Pending
-
2025-09-13$90,000 Active
ⓘ Source: listings_history table (triggers on properties + properties_extension) + one-shot
backfill from property_details.listing_events for pre-trigger history.
Tax reassessment forecast NY · Partial reset (capped growth)
- Current annual tax
- $884 · $74/mo
- Projected year-2 tax
- $1,117 · $93/mo
- Expected delta
- +$233/yr (+$19/mo · 26.3%)
ⓘ Screening estimate from a state-policy table — verify with the county assessor before closing.
Nearby sold comps map
Loading sold comps map…
Walkable amenities ~0.75 mi
Loading nearby amenities…
Taxation est. · year 1
- Rental income
- $11,101
- − Mortgage interest
- −$4,476
- − Property taxes
- −$884
- − Insurance
- −$400
- − Repairs & maintenance
- −$888
- − Management
- −$888
- − Depreciation
- −$2,324
- Taxable income
- $1,241
- Est. tax owed @ 24.0%
- −$298
- After-tax cash flow
- $2,160/yr
For passive investors: Depreciation is non-cash, so a rental often shows a tax loss while cash-flowing — sheltering income. Rental losses are passive: they offset passive income freely, and up to $25,000/yr can offset ordinary (W-2) income if you actively participate and your MAGI is under $100k (phasing out to $0 by $150k); unused losses carry forward. On sale, claimed depreciation is recaptured at up to 25%, and gains may owe capital-gains tax (a 1031 exchange can defer both). Figures are a year-1 estimate at your 24.0% rate — not tax advice; consult a CPA.
Schools (NCES district)
- District
- Owego-Apalachin Central School District
- NCES district ID
- 3622170
- Math proficiency
- 62% ▼ -1.00%
- Reading proficiency
- 62% ▲ 6.00%
- Median HH income
- $57,425
- Composite
- 53.45/100
- National rank
- #1464
- State rank
- #204 of 590 in NY
Livability — Newark Valley
- Score
- 70/100
- State rank
- #462
- US rank
- #8031
Category grades
Schools grade is shown separately in the Schools card above.
Census & demographics
- Population (ZIP)
- 4,102
Population outlook (Tioga County) Hauer SSP2
- Today (2025)
- 45,155 people
- By 2030
- 42,801 · -5.2%
- By 2040
- 37,960 · -15.9%
- By 2050
- 33,071 · -26.8%
- By 2075
- 24,144 · -46.5%
- By 2100
- 16,545 · -63.4%
Race, ethnicity, and origin ACS 2023
- Neighborhood character
- Predominantly White (94%)
- Race & ethnicity
- White 94% Two or more races 4% Asian 2%
- Common ancestry
- Romanian 6% Italian 2% Iranian 2%
- Foreign-born
- 3%
- Languages at home
- 96% English-only · German/W. Germanic 2% Other Indo-European 1% Spanish 1%
Political lean MEDSL · Tioga
- 2024 margin
- Strong R (+22.9) · D 38.6% · R 61.4%
- 2008→2024 swing
- -12.7pp toward R · 2008: -10.2pp · 2024: -22.9pp
- All cycles
- 2024: R+22.9 2020: R+20.6 2016: R+27.6 2012: R+15.1 2008: R+10.2
Not yet ingested
- Civics
- —
Market trends
- HPI YoY
- ▲ 7.29%
- Current HPI
- 256.8812
- Rent YoY
- —
- Metro
- —
- State GDP YoY
- ▲ 2.60%
- F500 in state
- 92
Industry mix (Fortune 500 HQ in NY)
| Industry | F500 HQs | Revenue |
|---|---|---|
| Financial Services | 10 | $950B |
|
||
| Consumer Goods | 9 | $162B |
|
||
| Insurance | 4 | $225B |
|
||
| Telecommunications | 2 | $144B |
|
||
| Pharmaceuticals | 2 | $112B |
|
||
| Media / Entertainment | 2 | $69B |
|
||
Price history
-11.2% since first listed4 events — show timeline
- 2026-05-06 Listed $79,900 IBRMLS
- 2025-11-10 Relisted — GBAOR
- 2025-10-30 Pending — GBAOR
- 2025-09-13 Listed $90,000 GBAOR
Property tax history
-4.6%/yrLatest (2025): $884 · +4.9% YoY. Source: county tax records.
Cash-flow waterfall
monthlySold comps — $/sqft
last 12 mo · ≤1 miLoading sold comps…