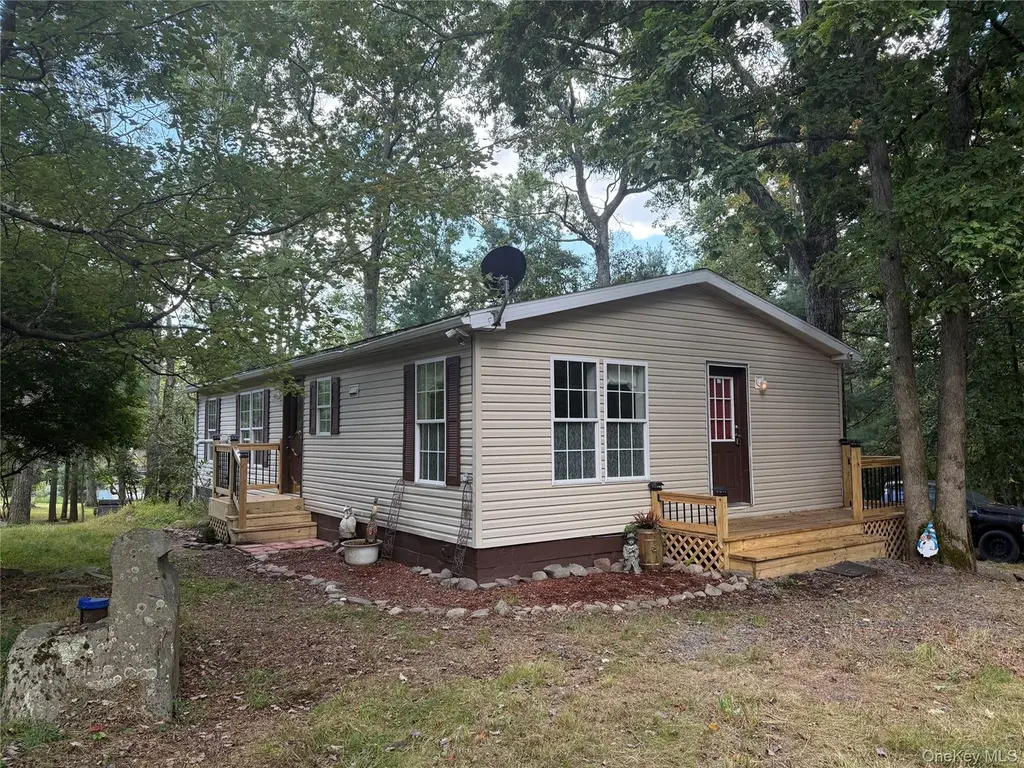
35 Oneida Trl · Eldred, NY
Flood risk 1/10 · Minimal
- FEMA flood zone
- X (unshaded)
- Chance of flooding over 30 yrs
- 0.0%
- Est. flood insurance / yr
- $507 – $1,088
Fire risk 2/10 · Minimal
- Est. fire insurance / yr
- $691 – $1,283
Heat risk 2/10 · Minimal
- Hot days now (above 92°F)
- 7 days/yr
- Hot days in 30 yrs
- 15 days/yr
Wind risk 3/10 · Minor
- Chance of severe wind over 30 yrs
- 6.0%
Air-quality risk 2/10 · Minimal
- Unhealthy air days now
- 1 days/yr
- Unhealthy air days in 30 yrs
- 1 days/yr
Risk factors via First Street. Map © Google.
Why this score? — see what drove the B+ grade
The composite is a weighted blend of 9 inputs, each scored 0–100. Each bar is that input's sub-score; the figure is the points it added to the 100-point composite (weight × sub-score).
- Cash flow +30.0/30.0
- DSCR +10.0/10.0
- Appreciation +10.0/10.0
- 1% rule +8.0/10.0
- ARV discount +7.5/15.0
- Schools +3.6/10.0
- Rent growth +2.5/5.0
- Livability +2.5/5.0
- Condition / age +2.5/5.0
$249,000
🖨 Deal sheet (PDF) 📄 Offer letter ✓ Due diligence
Listing remarks
Rustic Charm with Lake Access & Convenience! Welcome to this warm and inviting 3 bedroom, 2 bath home showcasing rich woodwork, hardwood floors, and plenty of windows that bring the outdoors in. The kitchen is a true centerpiece, featuring custom countertops, a double copper sink, stainless steel appliances, a gas/propane stove for cooking, and vaulted ceilings. Relax in the living room by the pellet stove or step out onto the brand new decks and enjoy the peace of a private corner lot on a quiet dead end road. The full walk out basement with oil heat offers plenty of storage and flexibility. Lake rights, with the option to launch your boat for just $100 per year, perfect for long sum
Key facts
- Double copper sink
- Gas propane stove
- Pellet stove
Tags
Property features AI
Finance
- HOA & community: Has association; Annual association fee of $100 (covers other items)
Exterior
- Parking: No carport; Other parking features
- Utilities: Septic tank; Electric service by Orange & Rockland; Private trash collection
- Home design: Manufactured home; Double-wide; Single-story
- Construction: Vinyl siding; Block foundation
- Exterior features: Corner lot; Level lot; Not waterfront
Interior
- Kitchen: Dishwasher; Gas cooktop; Gas oven; Oven; Refrigerator; Stainless steel appliances
- Bedrooms: Includes a bedroom on the first floor
- Flooring: Carpet; Ceramic tile; Hardwood
- Bathrooms: 2 full bathrooms
- Heating & cooling: Forced air heating; Oil heating; Wood heating; Pellet stove; Wood-burning stove; No central air
- Interior features: First-floor bedroom; First-floor full bath; Ceiling fan(s); Eat-in kitchen; High ceilings; High speed internet; Natural woodwork; Open floorplan; Open kitchen; Primary bathroom; Insulated windows; Full unfinished basement with walk-out access; 5 total rooms; One level
- Laundry & utility: Washer hookup; Electric dryer hookup; Laundry in basement
Neighborhood map
What this means for you Summary
Snapshot
- This is a 2-bed/2.0-bath manufactured listed at $249k.
Deal economics
- At list price, monthly cash flow is $938 ($11k/yr) — positive.
- The deal already cash-flows at list — no discount required.
- Meets the 1% rule at list price ($3k rent vs $249k).
- Cap rate 10.8% vs local median 2.3% in Eldred — top-decile yield for the area; either an underpriced asset or a hidden risk that comps aren't pricing in. Stress-test before assuming the spread holds.
Location & tenants
- Location reads: area grade B — affects rentability + tenant quality, not the cash-flow math above.
- Eldred Central School District (rural): math 33% / reading 50% proficiency, ranked #495 of 590 in NY (top 84%) — families likely to look elsewhere, expect single-tenant / working-renter base with shorter leases.
- Zoned schools: George Ross Mackenzie Elementary School (math 22% / reading 47%, grade F, #1,577 of 2,108 statewide, top 77%, 242 students, 38% FRL); Eldred Junior-Senior High School (math 47% / reading 57%, grade D+, #946 of 1,100 statewide, top 88%, 230 students, 46% FRL).
- Market conditions: 66 active listings in the ZIP; 2 comparable units currently listed for rent nearby; 739 units permitted in Sullivan County in 2024 (5 in 5+ unit buildings).
Forward outlook
- In year one you build about $27k of equity ($2k loan paydown + $25k appreciation (10.0% local appreciation)).
- Sullivan County population projected at -24% by 2050 — secular population decline; favor cash flow + early exit over multi-decade hold.
- At projected returns (10.0% appreciation + 3.0% rent growth), your $70k cash investment doubles in ~2 years — after that, you're playing with house money.
- By year 2, paydown + projected appreciation supports a ~$43k cash-out refi (75% LTV) — recoverable capital for the next deal without selling this one.
Negotiation context
- Only 5 days on market — expect competitive offers; lowballing is unlikely to land.
- 3 sale attempts since 15y ago with the ask held roughly flat each time — persistent listings suggest the price (not the market) is what's stuck; bring a comps-based counter.
Questions for the listing agent
- What does the HOA fee cover, when was the last increase, and are there any pending special assessments or reserve-fund shortfalls?
- Is there a deadline driving the sale (1031 exchange, divorce, estate, relocation)? That informs how much negotiation room exists.
- What's the average days-on-market for RENTAL listings here right now (not sales)? A rising rental-DOM trend means longer vacancies and softer asking-rent achievability than the comps imply.
- What's the recent tenant-quality profile in this submarket — average credit score on applications, eviction rate, late-payment / NSF rate, and stable-employment percentage? A property-management company in the area should have these aggregated.
- How much new for-sale + rental construction is in the pipeline within 1–3 miles? Heavy new supply typically softens prices + rents 12–24 months out; constrained supply supports both.
Investment metrics
- 1% rule
- 1.30% ✓
- Cap rate
- 10.81%
- Cash-on-cash
- 16.14%
- DSCR
- 1.72
- GRM
- 6.4
CMA / ARV
- ARV (median comp)
- $77,000
- List price
- $249,000
- Delta
- 288.31%
- Verdict
- OVERPRICED
- Comps
- 1 within 2.0 mi
Projected returns pro-forma
10.0% appreciation · 3.0% rent growth · sell at horizon
- IRR
- 36.2%
- Equity multiple
- 3.80×
- Total profit
- $195,326
- Equity at exit
- $224,319
- IRR
- 31.2%
- Equity multiple
- 8.58×
- Total profit
- $528,196
- Equity at exit
- $483,752
Cash invested: $69,720 (down + closing). Projections, not guarantees.
Landlord ↔ Tenant lean methodology
- Overall (STATE)
- 15 Strongly Tenant-Friendly
- State New York
- 15 Strongly Tenant-Friendly · D+10
- County
- — inherits STATE
- City
- — inherits STATE
ZIP-level market 12737
- Active inventory
- 66
- Price-to-rent
- 6.4×
Monthly cashflow live
- Estimated rent
- $3,228 medium interval (Pro) →
- Mortgage (P&I)
- −$1,306
- Tax from tax record
- −$195 /mo · $2,340/yr
- Insurance
- −$104
- HOA
- −$8
- Vacancy / Maint / Mgmt
- −$678
- Net cashflow
- $938
Break-even live
Sensitivity live
| Price | -10% $1,079 | -5% $1,008 | +0% $938 | +5% $867 | +10% $797 |
|---|---|---|---|---|---|
| Rent | -10% $683 | -5% $810 | +0% $938 | +5% $1,065 | +10% $1,193 |
| Rate | -1.0pp $1,063 | -0.5pp $1,001 | base $938 | +0.5pp $873 | +1.0pp $808 |
UW: 25.0% down · 7.5% · 30yr · 1.5% tax · 5.0% vac · 8.0% maint · 8.0% mgmt
Financing live
Cash to close
- Down payment
- $62,250
- Closing costs
- $7,470
- Reserves months
- —
- Total cash needed
- —
Loan-product check · same deal, 3 products live
Conventional
25% down · 7.5% · 30yr
- Down + closing
- —
- Monthly P&I
- —
- Monthly cashflow
- —
- DSCR
- —
- Eligible?
- —
Personal DTI + credit; lowest rate.
DSCR
20% down · 8.5% · 30yr
- Down + closing
- —
- Monthly P&I
- —
- Monthly cashflow
- —
- DSCR
- —
- Eligible?
- —
No personal income docs; deal must DSCR.
Hard money
10% down · 12.0% · 12mo
- Down + closing
- —
- Monthly P&I
- —
- Monthly cashflow
- —
- DSCR
- —
- Eligible?
- —
Short-term bridge; refi at stabilization.
Rent comps 2 comps
| Address | Beds | Baths | Sqft | Rent | $/sqft | DOM | Units | Dist |
|---|---|---|---|---|---|---|---|---|
| 44 Delaware Trl Glen Spey, NY | 2.0 | 1.0 | 936 | $3,500 | $3.74 | 16d | 1 | 0.16mi |
| 4 Beach Rd Glen Spey, NY | 3.0 | 1.0 | 999 | $2,000 | $2.00 | 16d | 1 | 0.79mi |
HOA detail
- Monthly dues
- $8 · $96/yr
- Likely covers
- gas
Listing history 22 events
-
2026-06-22days on market $249,000 Active 5 DOM
-
2026-06-21days on market $249,000 Active 4 DOM
-
2026-06-21days on market $249,000 Active 3 DOM
-
2026-06-17pricedays on market $249,000 Active 1 DOM
-
2026-06-17days on market $299,000 Active 282 DOM
-
2026-06-16days on market $299,000 Active 281 DOM
-
2026-06-15days on market $299,000 Active 280 DOM
-
2026-06-13days on market $299,000 Active 278 DOM
-
2026-06-12days on market $299,000 Active 277 DOM
-
2026-06-09days on market $299,000 Active 274 DOM
-
2026-06-08days on market $299,000 Active 273 DOM
-
2026-06-07days on market $299,000 Active 272 DOM
-
2026-06-07days on market $299,000 Active 271 DOM
-
2026-06-04days on market $299,000 Active 268 DOM
-
2026-06-02days on market $299,000 Active 267 DOM
-
2026-06-01days on market $299,000 Active 266 DOM
-
2026-05-31days on market $299,000 Active 265 DOM
-
2025-09-08$299,000 Active 1196-char remark
-
2024-02-06soldstatus $500,000
-
2011-12-31historical
-
2011-09-25
-
2007-08-08soldstatus $90,000
ⓘ Source: listings_history table (triggers on properties + properties_extension) + one-shot
backfill from property_details.listing_events for pre-trigger history.
Tax reassessment forecast NY · Partial reset (capped growth)
- Current annual tax
- $2,340 · $195/mo
- Projected year-2 tax
- $3,274 · $273/mo
- Expected delta
- +$934/yr (+$78/mo · 39.9%)
ⓘ Screening estimate from a state-policy table — verify with the county assessor before closing.
Climate risk First Street
- Flood 1/10 Low FEMA zone X (unshaded) · 0% chance over 30 yrs
- Wildfire 2/10 Low
- Heat 2/10 Low 7 d/yr ≥92°F today · 15 d/yr by 30 yrs out
- Wind 3/10 Moderate 6% chance of damaging wind over 30 yrs
- Air quality 2/10 Low 1 unhealthy d/yr today · 1 by 30 yrs out
Nearby sold comps map
Loading sold comps map…
Walkable amenities ~0.75 mi
Loading nearby amenities…
Taxation est. · year 1
- Rental income
- $38,739
- − Mortgage interest
- −$13,948
- − Property taxes
- −$2,340
- − Insurance
- −$1,245
- − Repairs & maintenance
- −$3,099
- − Management
- −$3,099
- − HOA
- −$96
- − Depreciation
- −$7,244
- Taxable income
- $7,669
- Est. tax owed @ 24.0%
- −$1,841
- After-tax cash flow
- $9,414/yr
For passive investors: Depreciation is non-cash, so a rental often shows a tax loss while cash-flowing — sheltering income. Rental losses are passive: they offset passive income freely, and up to $25,000/yr can offset ordinary (W-2) income if you actively participate and your MAGI is under $100k (phasing out to $0 by $150k); unused losses carry forward. On sale, claimed depreciation is recaptured at up to 25%, and gains may owe capital-gains tax (a 1031 exchange can defer both). Figures are a year-1 estimate at your 24.0% rate — not tax advice; consult a CPA.
Schools (NCES district)
- District
- Eldred Central School District
- NCES district ID
- 3610410
- Math proficiency
- 33% ▼ -15.00%
- Reading proficiency
- 50% ▲ 11.00%
- Median HH income
- $52,775
- Composite
- 35.94/100
- National rank
- #4800
- State rank
- #495 of 590 in NY
Livability — Eldred
No livability data for this city. (Only ~50 U.S. cities are tracked.)
Census & demographics
- Population (ZIP)
- 1,817
Population outlook (Sullivan County) Hauer SSP2
- Today (2025)
- 68,974 people
- By 2030
- 65,609 · -4.9%
- By 2040
- 58,878 · -14.6%
- By 2050
- 52,500 · -23.9%
- By 2075
- 39,941 · -42.1%
- By 2100
- 28,880 · -58.1%
Race, ethnicity, and origin ACS 2023
- Neighborhood character
- Predominantly White (82%)
- Race & ethnicity
- White 82% Hispanic / Latino 13% Two or more races 12%
- Hispanic origin (detail)
- Puerto Rican 9% Cuban 1%
- Common ancestry
- Romanian 7% Slovak 5% Lithuanian 4%
- Foreign-born
- 5% · South Korea
- Languages at home
- 92% English-only · Russian/Polish/Slavic 3% Other Indo-European 3% Spanish 2%
Political lean MEDSL · Sullivan
- 2024 margin
- R (+16.7) · D 41.6% · R 58.4%
- 2008→2024 swing
- -26.2pp toward R · 2008: 9.5pp · 2024: -16.7pp
- All cycles
- 2024: R+16.7 2020: R+9.2 2016: R+13.7 2012: D+10.4 2008: D+9.5
Not yet ingested
- Civics
- —
Market trends
- HPI YoY
- ▲ 132.02%
- Current HPI
- 443.8248
- Rent YoY
- —
- Metro
- —
- State GDP YoY
- ▲ 2.60%
- F500 in state
- 92
Industry mix (Fortune 500 HQ in NY)
| Industry | F500 HQs | Revenue |
|---|---|---|
| Financial Services | 10 | $950B |
|
||
| Consumer Goods | 9 | $162B |
|
||
| Insurance | 4 | $225B |
|
||
| Telecommunications | 2 | $144B |
|
||
| Pharmaceuticals | 2 | $112B |
|
||
| Media / Entertainment | 2 | $69B |
|
||
Price history
+176.7% since first listed7 events — show timeline
- 2026-06-17 Listed $249,000 OneKey® MLS as Distributed by MLS Grid
- 2026-06-17 Listing Removed — OneKey® MLS as Distributed by MLS Grid
- 2025-09-08 Listed $299,000 OneKey® MLS as Distributed by MLS Grid
- 2024-02-06 Sold (Public Records) $500,000 Public Records
- 2011-12-31 Delisted — HGMLS
- 2011-09-25 Listed — HGMLS
- 2007-08-08 Sold (Public Records) $90,000 Public Records
Property tax history
-3.6%/yrLatest (2025): $2,340 · +1.6% YoY. Source: county tax records.
Cash-flow waterfall
monthlySold comps — $/sqft
last 12 mo · ≤1 miLoading sold comps…