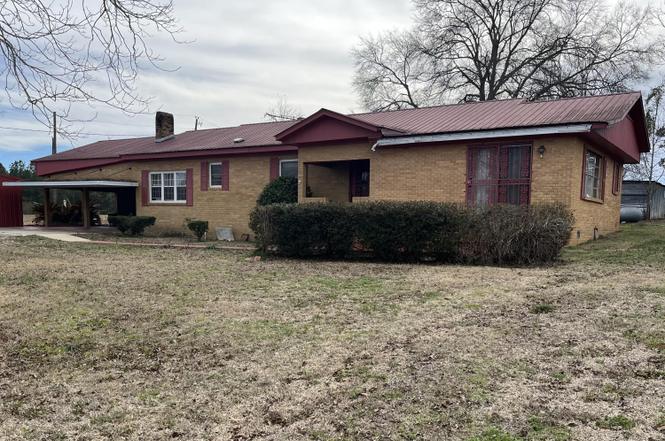
31 Webster Ave · Bassfield, MS
Flood risk No data
- FEMA flood zone
- —
- Chance of flooding over 30 yrs
- —
- Est. flood insurance / yr
- —
Fire risk No data
- Est. fire insurance / yr
- —
Heat risk No data
- Hot days now (above threshold)
- —
- Hot days in 30 yrs
- —
Wind risk No data
- Chance of severe wind over 30 yrs
- —
Air-quality risk No data
- Unhealthy air days now
- —
- Unhealthy air days in 30 yrs
- —
Risk factors via First Street. Map © Google.
Why this score? — see what drove the B grade
The composite is a weighted blend of 9 inputs, each scored 0–100. Each bar is that input's sub-score; the figure is the points it added to the 100-point composite (weight × sub-score).
- Cash flow +30.0/30.0
- 1% rule +10.0/10.0
- DSCR +10.0/10.0
- ARV discount +7.5/15.0
- Appreciation +6.3/10.0
- Livability +3.1/5.0
- Rent growth +2.5/5.0
- Condition / age +2.5/5.0
- Schools +1.3/10.0
$65,000
🖨 Deal sheet (PDF) 📄 Offer letter ✓ Due diligence
Listing remarks
Explore the potential of this charming 3-bedroom, 2.5-bath home, which offers 2522 square feet of inviting living space. Located on a generous 2.5 acres of land, this property is ideal for both family life and as a savvy investment. The spacious interiors and thoughtful layout provide a peaceful and comfortable setting for everyday living, while the substantial land offers additional possibilities for expansion or customization. Seize the opportunity to make this well-loved home your own or utilize it as a profitable investment. Call a Realtor today!
Key facts
- Generous 2.5 acres
- Substantial land
- 7,840 sq ft lot
Tags
Neighborhood map
What this means for you Summary
Snapshot
- This is a 3-bed/1.0-bath single-family listed at $65k.
Deal economics
- At list price, monthly cash flow is $344 ($4k/yr) — positive.
- The deal already cash-flows at list — no discount required.
- Meets the 1% rule at list price ($1k rent vs $65k).
- Recommended offer: $57k (12.0% below list) — sets the bar for market timing.
Location & tenants
- Location reads 61/100 on livability (#186 in MS) — a middle-class / working-renter tenant base. Strengths: cost of living A+, housing A+; Watch: employment D+, health & safety D, amenities F.
- Jefferson Davis County School District (rural): math 14% / reading 20% proficiency, ranked #104 of 130 in MS (top 80%) — low school quality limits family demand, transient renter base, plan for 1-2y turnover; 97% free/reduced lunch — lower-income household profile, screen leases tightly.
- Zoned schools: Carver Elementary School (math 20% / reading 28%, grade F, #228 of 375 statewide, top 61%, 260 students, 100% FRL); Jdc Middle School (272 students, 100% FRL); Jdc High School (math 8% / reading 12%, grade F, #170 of 197 statewide, top 90%, 387 students, 100% FRL) — zoned schools at 100% FRL track the district average.
- Market conditions: 2 active listings in the ZIP.
Forward outlook
- In year one you build about $2k of equity ($449 loan paydown + $2k appreciation (2.7% local appreciation)).
- Jefferson Davis County population projected at -35% by 2050 — secular population decline; favor cash flow + early exit over multi-decade hold.
- At projected returns (2.7% appreciation + 3.0% rent growth), your $18k cash investment doubles in ~3 years — after that, you're playing with house money.
Negotiation context
- It's been on market 123 days — a 12% lower offer ($57k) is reasonable based on typical stale-listing flexibility.
- 3 sale attempts since 3y ago; this cycle's ask has dropped $27k (29%) from the opening price — seller is motivated, your offer sets the floor, not the list.
Risks & watch-outs
- Watch-outs: property tax is 3.3% of price.
Questions for the listing agent
- It's been on market 123 days. Have you received any prior offers? Is the seller open to a 12% concession, seller financing, or rate buy-down credit?
- Built in 1960 — when were the roof, HVAC, electrical panel, plumbing, and water heater last replaced?
- Property tax is high relative to price — has the assessment been appealed recently, and will the sale trigger a re-assessment?
- Why hasn't it sold? Are there any deal-killer items the seller is aware of (foundation, flood, title, zoning, code violations)?
- Is there a deadline driving the sale (1031 exchange, divorce, estate, relocation)? That informs how much negotiation room exists.
- Schools are F-rated, which usually means shorter tenancies and higher turnover. Who's the typical renter profile here, and what's been the actual vacancy rate?
- What's the average days-on-market for RENTAL listings here right now (not sales)? A rising rental-DOM trend means longer vacancies and softer asking-rent achievability than the comps imply.
- What's the recent tenant-quality profile in this submarket — average credit score on applications, eviction rate, late-payment / NSF rate, and stable-employment percentage? A property-management company in the area should have these aggregated.
- How much new for-sale + rental construction is in the pipeline within 1–3 miles? Heavy new supply typically softens prices + rents 12–24 months out; constrained supply supports both.
Investment metrics
- 1% rule
- 1.74% ✓
- Cap rate
- 12.65%
- Cash-on-cash
- 22.69%
- DSCR
- 2.01
- GRM
- 4.8
CMA / ARV
No comps found within radius.
Projected returns pro-forma
2.67% appreciation · 3.0% rent growth · sell at horizon
- IRR
- 28.3%
- Equity multiple
- 2.58×
- Total profit
- $28,685
- Equity at exit
- $28,011
- IRR
- 29.2%
- Equity multiple
- 5.01×
- Total profit
- $72,954
- Equity at exit
- $42,245
Cash invested: $18,200 (down + closing). Projections, not guarantees.
Landlord ↔ Tenant lean methodology
- Overall (STATE)
- 90 Strongly Landlord-Friendly
- State Mississippi
- 90 Strongly Landlord-Friendly · R+11
- County
- — inherits STATE
- City
- — inherits STATE
ZIP-level market 39427
- Home prices YoY
- 2.6%
- Active inventory
- 2
- Price-to-rent
- 4.8×
Monthly cashflow live
- Estimated rent
- $1,130 medium interval (Pro) →
- Mortgage (P&I)
- −$341
- Tax from tax record
- −$181 /mo · $2,168/yr
- Insurance
- −$27
- HOA
- −$0
- Vacancy / Maint / Mgmt
- −$237
- Net cashflow
- $344
Break-even live
Sensitivity live
| Price | -10% $381 | -5% $363 | +0% $344 | +5% $326 | +10% $307 |
|---|---|---|---|---|---|
| Rent | -10% $255 | -5% $300 | +0% $344 | +5% $389 | +10% $433 |
| Rate | -1.0pp $377 | -0.5pp $361 | base $344 | +0.5pp $327 | +1.0pp $310 |
UW: 25.0% down · 7.5% · 30yr · 1.5% tax · 5.0% vac · 8.0% maint · 8.0% mgmt
Financing live
Cash to close
- Down payment
- $16,250
- Closing costs
- $1,950
- Reserves months
- —
- Total cash needed
- —
Loan-product check · same deal, 3 products live
Conventional
25% down · 7.5% · 30yr
- Down + closing
- —
- Monthly P&I
- —
- Monthly cashflow
- —
- DSCR
- —
- Eligible?
- —
Personal DTI + credit; lowest rate.
DSCR
20% down · 8.5% · 30yr
- Down + closing
- —
- Monthly P&I
- —
- Monthly cashflow
- —
- DSCR
- —
- Eligible?
- —
No personal income docs; deal must DSCR.
Hard money
10% down · 12.0% · 12mo
- Down + closing
- —
- Monthly P&I
- —
- Monthly cashflow
- —
- DSCR
- —
- Eligible?
- —
Short-term bridge; refi at stabilization.
Listing history 10 events
-
2025-05-19status Pending
-
2025-04-24price $65,000
-
2025-03-18price $73,000
-
2025-03-05price $78,000
-
2025-01-24price $82,800
-
2025-01-16$92,000 Active
-
2024-12-31historical
-
2024-11-14price $92,000
-
2024-04-15$100,000 Active
-
2023-10-28$100,000 Active
ⓘ Source: listings_history table (triggers on properties + properties_extension) + one-shot
backfill from property_details.listing_events for pre-trigger history.
Tax reassessment forecast MS · Resets to sale price
- Current annual tax
- $2,168 · $181/mo
- Projected year-2 tax
- $2,168 · $181/mo
- Expected delta
- $0/yr ($0/mo · 0.0%)
ⓘ Screening estimate from a state-policy table — verify with the county assessor before closing.
Nearby sold comps map
Loading sold comps map…
Walkable amenities ~0.75 mi
Loading nearby amenities…
Taxation est. · year 1
- Rental income
- $13,561
- − Mortgage interest
- −$3,641
- − Property taxes
- −$2,168
- − Insurance
- −$325
- − Repairs & maintenance
- −$1,085
- − Management
- −$1,085
- − Depreciation
- −$1,891
- Taxable income
- $3,366
- Est. tax owed @ 24.0%
- −$808
- After-tax cash flow
- $3,322/yr
For passive investors: Depreciation is non-cash, so a rental often shows a tax loss while cash-flowing — sheltering income. Rental losses are passive: they offset passive income freely, and up to $25,000/yr can offset ordinary (W-2) income if you actively participate and your MAGI is under $100k (phasing out to $0 by $150k); unused losses carry forward. On sale, claimed depreciation is recaptured at up to 25%, and gains may owe capital-gains tax (a 1031 exchange can defer both). Figures are a year-1 estimate at your 24.0% rate — not tax advice; consult a CPA.
Schools (NCES district)
- District
- Jefferson Davis County School District
- NCES district ID
- 2802250
- Math proficiency
- 14% ▼ -21.00%
- Reading proficiency
- 20% ▼ -5.00%
- Median HH income
- $27,474
- Composite
- 13.25/100
- National rank
- #9549
- State rank
- #104 of 130 in MS
Livability — Bassfield
- Score
- 61/100
- State rank
- #186
- US rank
- #17353
Category grades
Schools grade is shown separately in the Schools card above.
Census & demographics
- Population (ZIP)
- 853
Population outlook (Jefferson Davis County) Hauer SSP2
- Today (2025)
- 10,128 people
- By 2030
- 9,342 · -7.8%
- By 2040
- 7,842 · -22.6%
- By 2050
- 6,583 · -35.0%
- By 2075
- 4,540 · -55.2%
- By 2100
- 3,563 · -64.8%
Race, ethnicity, and origin ACS 2023
- Neighborhood character
- Predominantly White (82%)
- Race & ethnicity
- White 82% Black 11% Two or more races 7%
- Common ancestry
- Lithuanian 2% Serbian 2% Italian 1%
Political lean MEDSL · Jefferson Davis
- 2024 margin
- D (+13.8) · D 56.5% · R 42.8%
- 2008→2024 swing
- -7.7pp toward R · 2008: 21.5pp · 2024: 13.8pp
- All cycles
- 2024: D+13.8 2020: D+17.1 2016: D+20.1 2012: D+25.0 2008: D+21.5
Not yet ingested
- Civics
- —
Market trends
- HPI YoY
- ▲ 2.67%
- Current HPI
- 106.4507
- Rent YoY
- —
- Metro
- —
- State GDP YoY
- —
- F500 in state
- 0
Price history
-35.0% since first listed10 events — show timeline
- 2025-05-19 Pending — MLSU
- 2025-04-24 Price Changed $65,000 MLSU
- 2025-03-18 Price Changed $73,000 MLSU
- 2025-03-05 Price Changed $78,000 MLSU
- 2025-01-24 Price Changed $82,800 MLSU
- 2025-01-16 Listed $92,000 MLSU
- 2024-12-31 Listing Removed — MLSU
- 2024-11-14 Price Changed $92,000 MLSU
- 2024-04-15 Listed $100,000 MLSU
- 2023-10-28 Listed $100,000 HAAR
Property tax history
+31.5%/yrLatest (2025): $2,168 · +2.1% YoY. Source: county tax records.
Cash-flow waterfall
monthlySold comps — $/sqft
last 12 mo · ≤1 miLoading sold comps…