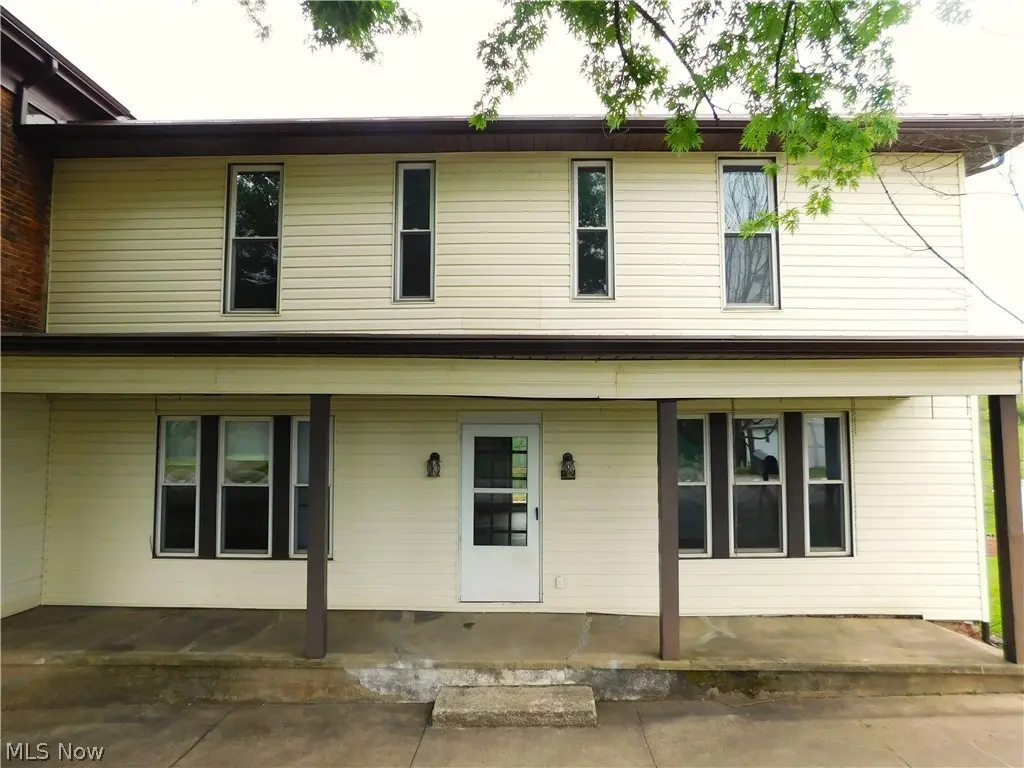
211 Main Pike St · Batesville, OH
Flood risk 1/10 · Minimal
- FEMA flood zone
- X (unshaded)
- Chance of flooding over 30 yrs
- 0.0%
- Est. flood insurance / yr
- $473 – $860
Fire risk 2/10 · Minimal
- Est. fire insurance / yr
- $713 – $1,323
Heat risk 4/10 · Minor
- Hot days now (above 96°F)
- 7 days/yr
- Hot days in 30 yrs
- 19 days/yr
Wind risk 2/10 · Minimal
- Chance of severe wind over 30 yrs
- 1.0%
Air-quality risk 2/10 · Minimal
- Unhealthy air days now
- 0 days/yr
- Unhealthy air days in 30 yrs
- 1 days/yr
Risk factors via First Street. Map © Google.
Why this score? — see what drove the C- grade
The composite is a weighted blend of 9 inputs, each scored 0–100. Each bar is that input's sub-score; the figure is the points it added to the 100-point composite (weight × sub-score).
- Cash flow +16.1/30.0
- ARV discount +7.5/15.0
- Appreciation +7.0/10.0
- DSCR +5.0/10.0
- Schools +4.7/10.0
- 1% rule +3.3/10.0
- Rent growth +2.5/5.0
- Livability +2.5/5.0
- Condition / age +2.5/5.0
$169,000
🖨 Deal sheet 📄 Offer letter ✓ Due diligence
Listing remarks
Where do I start with this massive, newly renovated 2 story home. .. Coming in at just under 2,200 sq. ft. this home offers something that very few homes can, a total of 7 bedrooms ALL WITH CLOSETS, a coat closet, linen closet, a walk in pantry and plenty of living space to enjoy at the same time! Not only does it have 7 bedrooms, it also boasts 2 full baths, first floor laundry, a large open living room spilling into a very expansive dining room that immediately blends right into the brand new kitchen! This home has been fully renovated throughout while keeping as much of the original craftsmanship as possible by preserving the original trim work, doors and hardwood floors. Some of the up
Key facts
- New furnace
- New hot water tank
- Newly renovated
Tags
Property features AI
Finance
- Financial info: Annual tax amount available
Exterior
- Parking: 1-car garage; On-street parking
- Utilities: Public water; Public sewer
- Home design: 2 stories; Metal roof
- Construction: Block foundation; Block construction; Vinyl siding; Attic/crawl hatchway(s) insulated; Built (year source: appraiser)
- Exterior features: Rear covered porch; Front porch; Deck; Patio
Interior
- Kitchen: Range; Refrigerator
- Bedrooms: 1 main-level bedroom
- Bathrooms: 2 full bathrooms; 1 main-level bathroom
- Heating & cooling: Forced-air gas heating; Central air conditioning
- Interior features: Ceiling fans; Eat-in kitchen; Granite counters; High ceilings; Open floor plan; Pantry; Recessed lighting; Natural woodwork
- Laundry & utility: Laundry located in a bathroom on the main level
Neighborhood map
What this means for you Summary
Snapshot
- This is a 6-bed/1.5-bath single-family listed at $169k.
Deal economics
- At list price, monthly cash flow is $87 ($1k/yr) — positive.
- The deal already cash-flows at list — no discount required.
- To meet the 1% rule (rent ≥ 1% of price), the offer needs to be $140k (17.1% below list).
- Recommended offer: $140k (17.1% below list) — sets the bar for 1% rule.
Location & tenants
- Location reads 49/100 on livability (#1,174 in OH) — a working-class tenant base; expect higher turnover. Strengths: cost of living A+, crime A; Watch: schools F, amenities F, commute F.
- Noble Local (rural): math 53% / reading 58% proficiency, ranked #371 of 656 in OH (top 57%) — acceptable for families but not a draw, mixed tenant base, ~2y average lease.
- Market conditions: 10 active listings in the ZIP; 19 units permitted in Noble County in 2024 (0 in 5+ unit buildings).
- This rent runs 32% of the median local income ($53k/yr) — at the standard rent-burdened threshold; future hikes will face affordability resistance.
Forward outlook
- In year one you build about $8k of equity ($1k loan paydown + $7k appreciation (3.9% local appreciation)).
- Noble County population projected at -16% by 2050 — secular population decline; favor cash flow + early exit over multi-decade hold.
- At projected returns (3.9% appreciation + 3.0% rent growth), your $47k cash investment doubles in ~5 years — after that, you're playing with house money.
- By year 5, paydown + projected appreciation supports a ~$34k cash-out refi (75% LTV) — recoverable capital for the next deal without selling this one.
Negotiation context
- It's been on market 53 days — a 3% lower offer ($164k) is reasonable based on typical stale-listing flexibility.
- 3 sale attempts since 6y ago; this cycle's ask has dropped $10k (6%) from the opening price — seller is motivated, your offer sets the floor, not the list.
Risks & watch-outs
- Watch-outs: built in 1900 — expect roof / HVAC / electrical / plumbing capex.
Questions for the listing agent
- It's been on market 53 days. Have you received any prior offers? Is the seller open to a 17% concession, seller financing, or rate buy-down credit?
- Built in 1900 — when were the roof, HVAC, electrical panel, plumbing, and water heater last replaced?
- Is there a deadline driving the sale (1031 exchange, divorce, estate, relocation)? That informs how much negotiation room exists.
- Schools are F-rated, which usually means shorter tenancies and higher turnover. Who's the typical renter profile here, and what's been the actual vacancy rate?
- What's the average days-on-market for RENTAL listings here right now (not sales)? A rising rental-DOM trend means longer vacancies and softer asking-rent achievability than the comps imply.
- What's the recent tenant-quality profile in this submarket — average credit score on applications, eviction rate, late-payment / NSF rate, and stable-employment percentage? A property-management company in the area should have these aggregated.
- How much new for-sale + rental construction is in the pipeline within 1–3 miles? Heavy new supply typically softens prices + rents 12–24 months out; constrained supply supports both.
Investment metrics
- 1% rule
- 0.83% ✗
- Cap rate
- 6.91%
- Cash-on-cash
- 2.22%
- DSCR
- 1.10
- GRM
- 10.0
CMA / ARV
No comps found within radius.
Projected returns pro-forma
3.94% appreciation · 3.0% rent growth · sell at horizon
- IRR
- 12.1%
- Equity multiple
- 1.73×
- Total profit
- $34,408
- Equity at exit
- $85,083
- IRR
- 13.6%
- Equity multiple
- 3.21×
- Total profit
- $104,461
- Equity at exit
- $138,683
Cash invested: $47,320 (down + closing). Projections, not guarantees.
Landlord ↔ Tenant lean methodology
- Overall (STATE)
- 73 Landlord-Friendly
- State Ohio
- 73 Landlord-Friendly · R+6
- County
- — inherits STATE
- City
- — inherits STATE
ZIP-level market 43773
- Home prices YoY
- 2.6%
- Active inventory
- 10
- Price-to-rent
- 10.0×
Monthly cashflow live
- Estimated rent
- $1,402 medium interval (Pro) →
- Mortgage (P&I)
- −$886
- Tax from tax record
- −$63 /mo · $756/yr
- Insurance
- −$70
- HOA
- −$0
- Vacancy / Maint / Mgmt
- −$294
- Net cashflow
- $87
Break-even live
UW: 25.0% down · 7.5% · 30yr · 1.5% tax · 5.0% vac · 8.0% maint · 8.0% mgmt
Financing live
Cash to close
- Down payment
- $42,250
- Closing costs
- $5,070
- Reserves months
- —
- Total cash needed
- —
Loan-product check · same deal, 3 products live
Conventional
25% down · 7.5% · 30yr
- Down + closing
- —
- Monthly P&I
- —
- Monthly cashflow
- —
- DSCR
- —
- Eligible?
- —
Personal DTI + credit; lowest rate.
DSCR
20% down · 8.5% · 30yr
- Down + closing
- —
- Monthly P&I
- —
- Monthly cashflow
- —
- DSCR
- —
- Eligible?
- —
No personal income docs; deal must DSCR.
Hard money
10% down · 12.0% · 12mo
- Down + closing
- —
- Monthly P&I
- —
- Monthly cashflow
- —
- DSCR
- —
- Eligible?
- —
Short-term bridge; refi at stabilization.
Listing history 19 events
-
2026-06-18days on market $169,000 Active 53 DOM
-
2026-06-17days on market $169,000 Active 52 DOM
-
2026-06-16days on market $169,000 Active 51 DOM
-
2026-06-15pricedays on market $169,000 Active 50 DOM
-
2026-06-13days on market $179,000 Active 48 DOM
-
2026-06-12days on market $179,000 Active 47 DOM
-
2026-06-09days on market $179,000 Active 44 DOM
-
2026-06-08days on market $179,000 Active 43 DOM
-
2026-06-08days on market $179,000 Active 42 DOM
-
2026-06-07days on market $179,000 Active 41 DOM
-
2026-06-04days on market $179,000 Active 38 DOM
-
2026-06-02days on market $179,000 Active 37 DOM
-
2026-06-01days on market $179,000 Active 36 DOM
-
2026-05-31days on market $179,000 Active 35 DOM
-
2026-04-24$179,000 Active 1985-char remark
-
2021-01-12historical
-
2020-12-22$124,700
-
2020-10-26historical
-
2020-10-02$124,700
ⓘ Source: listings_history table (triggers on properties + properties_extension) + one-shot
backfill from property_details.listing_events for pre-trigger history.
Tax reassessment forecast OH · Partial reset (capped growth)
- Current annual tax
- $756 · $63/mo
- Projected year-2 tax
- $1,696 · $141/mo
- Expected delta
- +$940/yr (+$78/mo · 124.3%)
ⓘ Screening estimate from a state-policy table — verify with the county assessor before closing.
Climate risk First Street
- Flood 1/10 Low FEMA zone X (unshaded) · 0% chance over 30 yrs
- Wildfire 2/10 Low
- Heat 4/10 Moderate 7 d/yr ≥96°F today · 19 d/yr by 30 yrs out
- Wind 2/10 Low 100% chance of damaging wind over 30 yrs
- Air quality 2/10 Low 0 unhealthy d/yr today · 1 by 30 yrs out
Nearby sold comps map
Loading sold comps map…
Walkable amenities ~0.75 mi
Loading nearby amenities…
Taxation est. · year 1
- Rental income
- $16,818
- − Mortgage interest
- −$9,467
- − Property taxes
- −$756
- − Insurance
- −$845
- − Repairs & maintenance
- −$1,345
- − Management
- −$1,345
- − Depreciation
- −$4,916
- Taxable loss
- −$1,857
- Est. tax savings @ 24.0%
- +$446
- After-tax cash flow
- $1,496/yr
For passive investors: Depreciation is non-cash, so a rental often shows a tax loss while cash-flowing — sheltering income. Rental losses are passive: they offset passive income freely, and up to $25,000/yr can offset ordinary (W-2) income if you actively participate and your MAGI is under $100k (phasing out to $0 by $150k); unused losses carry forward. On sale, claimed depreciation is recaptured at up to 25%, and gains may owe capital-gains tax (a 1031 exchange can defer both). Figures are a year-1 estimate at your 24.0% rate — not tax advice; consult a CPA.
Schools (NCES district)
- District
- Noble Local
- NCES district ID
- 3904890
- Math proficiency
- 53% ▼ -15.00%
- Reading proficiency
- 58% ▼ -6.00%
- Median HH income
- $44,248
- Composite
- 46.78/100
- National rank
- #2385
- State rank
- #371 of 656 in OH
Livability — Batesville
- Score
- 49/100
- State rank
- #1174
- US rank
- #25829
Category grades
Schools grade is shown separately in the Schools card above.
Census & demographics
- Census place
- Batesville, OH
- County
- Guernsey · 34,843 people
- Population (ZIP)
- 2,798
- Household income
- $53,188
- Rent vs Own
- Severe rent burden
- 1.3
Population outlook (Noble County) Hauer SSP2
- Today (2025)
- 13,837 people
- By 2030
- 13,584 · -1.8%
- By 2040
- 12,674 · -8.4%
- By 2050
- 11,551 · -16.5%
- By 2075
- 8,951 · -35.3%
- By 2100
- 6,807 · -50.8%
Race, ethnicity, and origin ACS 2023
- Neighborhood character
- Predominantly White (98%)
- Race & ethnicity
- White 98% Two or more races 2%
- Common ancestry
- Polish 8% Iranian 3% Italian 2%
- Languages at home
- 78% English-only · German/W. Germanic 21%
Political lean MEDSL · Noble
- 2024 margin
- Solid R (+64.6) · D 17.4% · R 82.0%
- 2008→2024 swing
- -48.8pp toward R · 2008: -15.8pp · 2024: -64.6pp
- All cycles
- 2024: R+64.6 2020: R+62.5 2016: R+55.1 2012: R+24.6 2008: R+15.8
Not yet ingested
- Civics
- —
Market trends
- HPI YoY
- ▲ 3.94%
- Current HPI
- 153.8348
- Rent YoY
- —
- Metro
- —
- State GDP YoY
- ▲ 1.98%
- F500 in state
- 48
Industry mix (Fortune 500 HQ in OH)
| Industry | F500 HQs | Revenue |
|---|---|---|
| Insurance | 3 | $145B |
|
||
| Industrial Machinery | 3 | $49B |
|
||
| Financial Services | 3 | $24B |
|
||
| Consumer Goods | 2 | $93B |
|
||
| Aerospace / Defense | 2 | $47B |
|
||
| Utilities | 2 | $33B |
|
||
Price history
+35.5% since first listed6 events — show timeline
- 2026-06-14 Price Changed $169,000 MLSNOW
- 2026-04-24 Listed $179,000 MLSNOW
- 2021-01-12 Listing Removed — MLSNOW
- 2020-12-22 Listed $124,700 MLSNOW
- 2020-10-26 Listing Removed — MLSNOW
- 2020-10-02 Listed $124,700 MLSNOW
Property tax history
+8.4%/yrLatest (2025): $756 · +0.0% YoY. Source: county tax records.
Cash-flow waterfall
monthlySold comps — $/sqft
last 12 mo · ≤1 miLoading sold comps…