 Duplex
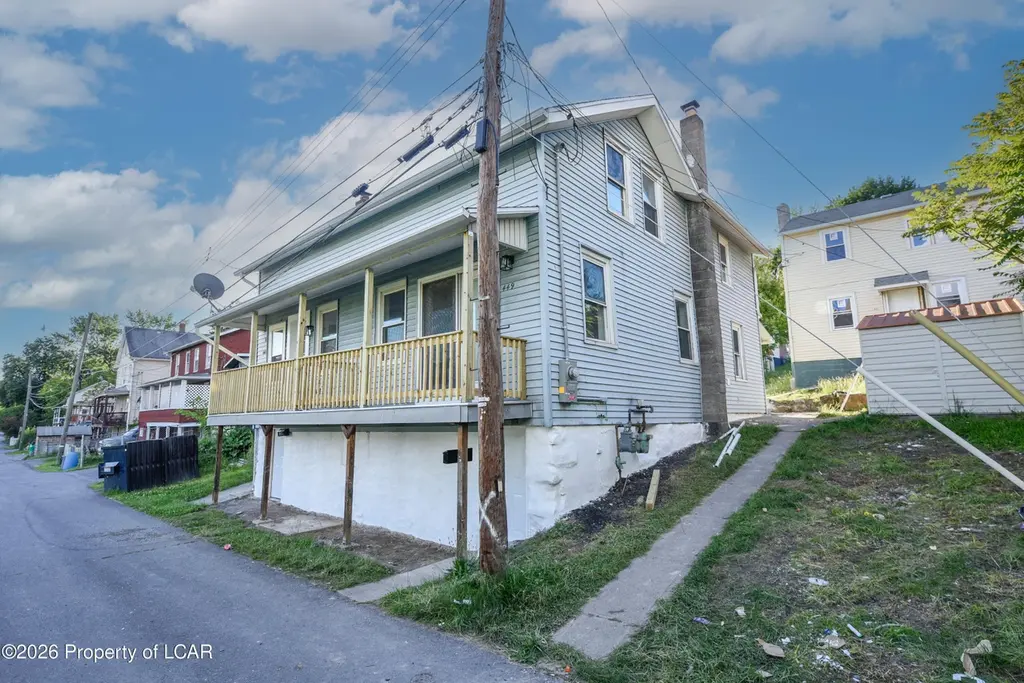
447 449 Moss St · Plymouth, PA
Flood risk 5/10 · Moderate
- FEMA flood zone
- X (unshaded)
- Chance of flooding over 30 yrs
- 0.24%
- Est. flood insurance / yr
- $507 – $1,088
Fire risk 3/10 · Minor
- Est. fire insurance / yr
- $511 – $949
Heat risk 4/10 · Minor
- Hot days now (above 97°F)
- 7 days/yr
- Hot days in 30 yrs
- 16 days/yr
Wind risk 3/10 · Minor
- Chance of severe wind over 30 yrs
- 5.0%
Air-quality risk 2/10 · Minimal
- Unhealthy air days now
- 1 days/yr
- Unhealthy air days in 30 yrs
- 2 days/yr
Risk factors via First Street. Map © Google.
Why this score? — see what drove the C+ grade
The composite is a weighted blend of 9 inputs, each scored 0–100. Each bar is that input's sub-score; the figure is the points it added to the 100-point composite (weight × sub-score).
- Cash flow +28.8/30.0
- DSCR +10.0/10.0
- 1% rule +7.4/10.0
- ARV discount +3.8/15.0
- Livability +3.3/5.0
- Rent growth +2.5/5.0
- Schools +2.5/10.0
- Condition / age +2.5/5.0
- Appreciation +0.0/10.0
$209,900
🖨 Deal sheet 📄 Offer letter ✓ Due diligence
Multi-family units
County records classify this as Multi-Family (2-4 Unit). Listing-text estimate: 2 units. confirmed
Listing remarks MLS
This former duplex was gutted and opened up to function as a single family home, giving you a blank canvas to design exactly what you want. Whether you are looking to create a spacious primary residence or restore it back to a two unit income property, the flexibility here is the real value. As a single family, the footprint allows for generous living areas, multiple bedrooms, and the chance to bring back character while incorporating modern finishes. High ceilings and a traditional two story layout offer solid bones for a thoughtful renovation. For investors, the previous duplex configuration creates strong potential to convert back to two separate units, providing an opportunity for steady rental income at a low acquisition cost. With separate entrances and an established multi unit history, the groundwork is already there. Covered porches add exterior charm, and the manageable lot keeps maintenance simple. Conveniently located near local shops, restaurants, schools, and everyday amenities. Just minutes to Route 11 and Route 92 with easy access to Wilkes Barre, Nanticoke, and the broader Wyoming Valley employment centers. This is not turnkey. It needs work. But for the buyer or investor who understands value add opportunities, this is a chance to build equity and unlock serious upside at an attractive price point. At this price, with this flexibility and potential income upside, opportunities like this do not come around often. Schedule your tour today!
Key facts
- Fully renovated
- Modern upgrades
- Granite countertops
Tags
Property features AI
Exterior
- Utilities: Public water; Public sewer
- Home design: Residential income property; Multi-family
- Construction: Vinyl siding
- Exterior features: Deck
Interior
- Heating & cooling: Electric and natural gas heating; Forced air heating
- Interior features: Has basement
Neighborhood map
What this means for you Summary
Snapshot
- This is a 2 × 2-bed/1.0-bath units multifamily listed at $210k.
Deal economics
- At list price, monthly cash flow is $703 ($8k/yr) — positive. Per door: $351/mo.
- The deal already cash-flows at list — no discount required.
- Meets the 1% rule at list price ($3k rent vs $210k).
- Recommended offer: $207k (1.5% below list) — sets the bar for market timing.
- Cap rate 10.3% vs local median 8.3% in Plymouth — meaningfully above typical; check what's discounted (condition, days-on-market, listing class) to confirm the premium yield is real.
Location & tenants
- Location reads 66/100 on livability (#1,068 in PA) — a middle-class / working-renter tenant base. Strengths: cost of living A+, health & safety A+, housing B+; Watch: employment D, crime F, amenities F.
- Wyoming Valley West SD (suburban): math 18% / reading 42% proficiency, ranked #445 of 539 in PA (top 83%) — families likely to look elsewhere, expect single-tenant / working-renter base with shorter leases.
- Market conditions: 61 active listings in the ZIP; 8 comparable units currently listed for rent nearby; rentals leasing fast (median 14d on market — plan ~1-2 weeks tenant-placement turnaround); 349 units permitted in Luzerne County in 2024 (16 in 5+ unit buildings).
Forward outlook
- Local home prices are declining (-3.0%/yr); year-one equity from $1k of loan paydown is wiped out by about $6k of value loss. Plan a longer hold.
- Luzerne County population projected at +4% by 2050 — modest demand growth; plan on rents tracking national, not racing it.
- At projected returns (-3.0% appreciation + 3.0% rent growth), your $59k cash investment doubles in ~9 years — after that, you're playing with house money.
Negotiation context
- It's been on market 15 days — a 2% lower offer ($207k) is reasonable based on typical stale-listing flexibility.
- 4 sale attempts with the ask held roughly flat each time — persistent listings suggest the price (not the market) is what's stuck; bring a comps-based counter.
- Current owner paid $86k; list at $210k implies a 143% gain — meaningful room to come down on a strong offer.
Risks & watch-outs
- Watch-outs: built in 1930 — expect roof / HVAC / electrical / plumbing capex.
- Climate carrying-cost: moderate flood risk — expect insurance premiums to compound above CPI over the hold.
Questions for the listing agent
- Can we see the unit-by-unit rent roll, current vacancy, and any below-market leases? What's the average tenancy length?
- What capital expenditures (roof, boiler, parking lot, exteriors) have been made in the last 5 years, and what's planned in the next 2?
- Built in 1930 — when were the roof, HVAC, electrical panel, plumbing, and water heater last replaced?
- Is there a deadline driving the sale (1031 exchange, divorce, estate, relocation)? That informs how much negotiation room exists.
- Crime grade is F in this area — have there been break-ins, vandalism, or insurance claims at this property in the last 3 years? What carrier currently insures it and at what premium?
- What's the average days-on-market for RENTAL listings here right now (not sales)? A rising rental-DOM trend means longer vacancies and softer asking-rent achievability than the comps imply.
- What's the recent tenant-quality profile in this submarket — average credit score on applications, eviction rate, late-payment / NSF rate, and stable-employment percentage? A property-management company in the area should have these aggregated.
- How much new apartment / multifamily construction is in the pipeline within 1–3 miles? Heavy new supply (>2% of stock underway) typically softens rents 12–24 months out; light construction supports rent growth.
Investment metrics
- 1% rule
- 1.24% ✓
- Cap rate
- 10.31%
- Cash-on-cash
- 14.35%
- DSCR
- 1.64
- GRM
- 6.7
CMA / ARV
- ARV (on-the-fly)
- $193,800
- Comps found
- 4
Show comp detail 4 sales within ~0.75 mi
| Address | Dist | Beds/Ba | Sqft | Sold | Price | $/sf | Match |
|---|---|---|---|---|---|---|---|
| 131 Center Ave | 0.65mi | 4/2.0 | 2,000 (-2%) | 11mo | $190,000 | $95 | 57 |
| 133-135 High St | 0.49mi | 5/3.0 (+1) | 2,128 (+4%) | 7mo | $195,000 | $92 | 56 |
| 79 Shawnee Ave | 0.57mi | 4/3.0 | 2,300 (+13%) | 0mo | $200,000 | $87 | 48 |
| 557-559 Fellows Ave | 0.74mi | 5/3.0 (+1) | 2,090 (+2%) | 18mo | $240,000 | $115 | 37 |
Match score weights: distance 35% · size 25% · config 20% · recency 20%. Top-matched comps best support the ARV.
Projected returns pro-forma
-3.0% appreciation · 3.0% rent growth · sell at horizon
- IRR
- 4.7%
- Equity multiple
- 1.18×
- Total profit
- $10,738
- Equity at exit
- $31,297
- IRR
- 14.2%
- Equity multiple
- 2.14×
- Total profit
- $66,918
- Equity at exit
- $18,148
Cash invested: $58,772 (down + closing). Projections, not guarantees.
Landlord ↔ Tenant lean methodology
- Overall (STATE)
- 62 Landlord-Friendly
- State Pennsylvania
- 62 Landlord-Friendly · EVEN
- County
- — inherits STATE
- City
- — inherits STATE
ZIP-level market 18651
- Home prices YoY
- -11.5%
- Active inventory
- 61
- Price-to-rent
- 13.4×
Monthly cashflow live
- Estimated rent
- $2,604 high interval (Pro) →
- Mortgage (P&I)
- −$1,101
- Tax from tax record
- −$166 /mo · $1,992/yr
- Insurance
- −$87
- HOA
- −$0
- Vacancy / Maint / Mgmt
- −$547
- Net cashflow
- $703
Break-even live
2-unit breakdown (identical units grouped — click to expand)
| Units | Beds | Baths | Est. rent |
|---|---|---|---|
| 2× units | 2 | 1 | $2,604 |
| #1 | 2 | 1 | $1,302 |
| #2 | 2 | 1 | $1,302 |
| Total (2 units) | $2,604 | ||
UW: 25.0% down · 7.5% · 30yr · 1.5% tax · 5.0% vac · 8.0% maint · 8.0% mgmt
Financing live
Cash to close
- Down payment
- $52,475
- Closing costs
- $6,297
- Reserves months
- —
- Total cash needed
- —
Loan-product check · same deal, 3 products live
Conventional
25% down · 7.5% · 30yr
- Down + closing
- —
- Monthly P&I
- —
- Monthly cashflow
- —
- DSCR
- —
- Eligible?
- —
Personal DTI + credit; lowest rate.
DSCR
20% down · 8.5% · 30yr
- Down + closing
- —
- Monthly P&I
- —
- Monthly cashflow
- —
- DSCR
- —
- Eligible?
- —
No personal income docs; deal must DSCR.
Hard money
10% down · 12.0% · 12mo
- Down + closing
- —
- Monthly P&I
- —
- Monthly cashflow
- —
- DSCR
- —
- Eligible?
- —
Short-term bridge; refi at stabilization.
Rent comps 8 comps
| Address | Beds | Baths | Sqft | Rent | $/sqft | DOM | Units | Dist |
|---|---|---|---|---|---|---|---|---|
| 48 E Shawnee Ave Plymouth, PA | 3.0 | 1.0 | 1500 | $1,250 | $0.83 | 13d | 1 | 0.62mi |
| 535 W State St Plymouth, PA | 3.0 | 1.0 | 1600 | $1,500 | $0.94 | 43d | 1 | 0.81mi |
| 121 Oak St Unit 1 Wilkes-Barre, PA | 3.0 | 1.0 | 1960 | $1,550 | $0.79 | 13d | 1 | 0.92mi |
| 27 Oak St Wilkes Barre, PA | 3.0 | 1.5 | 1500 | $1,700 | $1.13 | 43d | 1 | 1.09mi |
| 342 Horton St Wilkes Barre, PA | 3.0 | 1.5 | 1472 | $1,650 | $1.12 | 13d | 1 | 1.09mi |
| 216 Horton St Wilkes Barre, PA | 3.0 | 1.5 | 1475 | $1,575 | $1.07 | 43d | 1 | 1.31mi |
| 29 Franklin St Plymouth, PA | 3.0 | 1.0 | 1426 | $1,800 | $1.26 | 13d | 1 | 1.33mi |
| 657 W Main St Plymouth, PA | 3.0 | 1.0 | 1600 | $1,700 | $1.06 | 13d | 1 | 1.39mi |
Listing history 12 events
-
2026-06-18days on market $209,900 Active 15 DOM
-
2026-06-17days on market $209,900 Active 14 DOM
-
2026-06-16days on market $209,900 Active 13 DOM
-
2026-06-15days on market $209,900 Active 12 DOM
-
2026-06-14days on market $209,900 Active 10 DOM
-
2026-06-13days on market $209,900 Active 9 DOM
-
2026-06-10days on market $209,900 Active 7 DOM
-
2026-06-09days on market $209,900 Active 6 DOM
-
2026-06-08days on market $209,900 Active 5 DOM
-
2026-06-07days on market $209,900 Active 4 DOM
-
2026-06-05remarks 342-char remark
-
2026-06-05$209,900 Active 1 DOM
ⓘ Source: listings_history table (triggers on properties + properties_extension) + one-shot
backfill from property_details.listing_events for pre-trigger history.
Tax reassessment forecast PA · Partial reset (capped growth)
- Current annual tax
- $1,992 · $166/mo
- Projected year-2 tax
- $2,654 · $221/mo
- Expected delta
- +$662/yr (+$55/mo · 33.2%)
ⓘ Screening estimate from a state-policy table — verify with the county assessor before closing.
Climate risk First Street
- Flood 5/10 Major FEMA zone X (unshaded) · 24% chance over 30 yrs
- Wildfire 3/10 Moderate
- Heat 4/10 Moderate 7 d/yr ≥97°F today · 16 d/yr by 30 yrs out
- Wind 3/10 Moderate 5% chance of damaging wind over 30 yrs
- Air quality 2/10 Low 1 unhealthy d/yr today · 2 by 30 yrs out
Nearby sold comps map
Loading sold comps map…
Walkable amenities ~0.75 mi
Loading nearby amenities…
Taxation est. · year 1
- Rental income
- $31,248
- − Mortgage interest
- −$11,758
- − Property taxes
- −$1,992
- − Insurance
- −$1,050
- − Repairs & maintenance
- −$2,500
- − Management
- −$2,500
- − Depreciation
- −$6,106
- Taxable income
- $5,343
- Est. tax owed @ 24.0%
- −$1,282
- After-tax cash flow
- $7,153/yr
For passive investors: Depreciation is non-cash, so a rental often shows a tax loss while cash-flowing — sheltering income. Rental losses are passive: they offset passive income freely, and up to $25,000/yr can offset ordinary (W-2) income if you actively participate and your MAGI is under $100k (phasing out to $0 by $150k); unused losses carry forward. On sale, claimed depreciation is recaptured at up to 25%, and gains may owe capital-gains tax (a 1031 exchange can defer both). Figures are a year-1 estimate at your 24.0% rate — not tax advice; consult a CPA.
Schools (NCES district)
- District
- Wyoming Valley West SD
- NCES district ID
- 4225950
- Math proficiency
- 18% ▼ -11.00%
- Reading proficiency
- 42% ▼ -12.00%
- Median HH income
- $42,437
- Composite
- 25.38/100
- National rank
- #7470
- State rank
- #445 of 539 in PA
Livability — Plymouth
- Score
- 66/100
- State rank
- #1068
- US rank
- #12056
Category grades
Schools grade is shown separately in the Schools card above.
Census & demographics
- Census place
- Plymouth, PA
- Population (ZIP)
- 8,672
Population outlook (Luzerne County) Hauer SSP2
- Today (2025)
- 319,505 people
- By 2030
- 319,943 · +0.1%
- By 2040
- 322,643 · +1.0%
- By 2050
- 330,817 · +3.5%
- By 2075
- 379,145 · +18.7%
- By 2100
- 431,908 · +35.2%
Race, ethnicity, and origin ACS 2023
- Neighborhood character
- Predominantly White (82%)
- Race & ethnicity
- White 82% Hispanic / Latino 10% Black 5% Two or more races 4%
- Hispanic origin (detail)
- Mexican 3% Dominican 5%
- Common ancestry
- Romanian 19% Scotch-Irish 2% Iranian 2%
- Foreign-born
- 5% · Canada
- Languages at home
- 91% English-only · Spanish 7% Other Indo-European 1%
Political lean MEDSL · Luzerne
- 2024 margin
- R (+19.2) · D 40.0% · R 59.2%
- 2008→2024 swing
- -27.6pp toward R · 2008: 8.4pp · 2024: -19.2pp
- All cycles
- 2024: R+19.2 2020: R+14.4 2016: R+19.6 2012: D+4.8 2008: D+8.4
Not yet ingested
- Civics
- —
Market trends
- HPI YoY
- ▼ -29.78%
- Current HPI
- 229.6791
- Rent YoY
- —
- Metro
- —
- State GDP YoY
- ▲ 1.68%
- F500 in state
- 34
Industry mix (Fortune 500 HQ in PA)
| Industry | F500 HQs | Revenue |
|---|---|---|
| Healthcare | 2 | $309B |
|
||
| Insurance | 2 | $27B |
|
||
| Telecommunications / Media | 1 | $124B |
|
||
| Industrial Distribution | 1 | $22B |
|
||
| Financial Services | 1 | $20B |
|
||
| Chemicals / Materials | 1 | $18B |
|
||
Price history
+133.2% since first listed9 events — show timeline
- 2026-06-03 Listed $209,900 LCAR
- 2026-05-15 Sold (Public Records) $86,250 Public Records
- 2026-05-12 Sold (MLS) $86,250 LCAR
- 2026-05-12 Sold (MLS) $86,250 PMAR
- 2026-03-19 Pending — LCAR
- 2026-03-19 Pending — PMAR
- 2026-03-12 Listed $90,000 LCAR
- 2026-03-10 Listed $90,000 PMAR
- 2026-02-27 Listed $90,000 PMAR
Property tax history
+2.2%/yrLatest (2026): $1,992 · +1.8% YoY. Source: county tax records.
Cash-flow waterfall
monthlySold comps — $/sqft
last 12 mo · ≤1 miLoading sold comps…