5501 Fm 2606 · Scotland, TX
Flood risk 1/10 · Minimal
- FEMA flood zone
- —
- Chance of flooding over 30 yrs
- 0.0%
- Est. flood insurance / yr
- —
Fire risk 5/10 · Moderate
- Est. fire insurance / yr
- $1,222 – $2,270
Heat risk 6/10 · Moderate
- Hot days now (above 109°F)
- 7 days/yr
- Hot days in 30 yrs
- 20 days/yr
Wind risk 4/10 · Minor
- Chance of severe wind over 30 yrs
- 19.0%
Air-quality risk 1/10 · Minimal
- Unhealthy air days now
- 0 days/yr
- Unhealthy air days in 30 yrs
- 0 days/yr
Risk factors via First Street. Map © Google.
Why this score? — see what drove the B- grade
The composite is a weighted blend of 9 inputs, each scored 0–100. Each bar is that input's sub-score; the figure is the points it added to the 100-point composite (weight × sub-score).
- Cash flow +30.0/30.0
- 1% rule +10.0/10.0
- DSCR +10.0/10.0
- ARV discount +7.5/15.0
- Schools +4.1/10.0
- Livability +3.3/5.0
- Rent growth +2.5/5.0
- Condition / age +2.5/5.0
- Appreciation +0.0/10.0
$50,500
🖨 Deal sheet (PDF) 📄 Offer letter ✓ Due diligence
Listing remarks
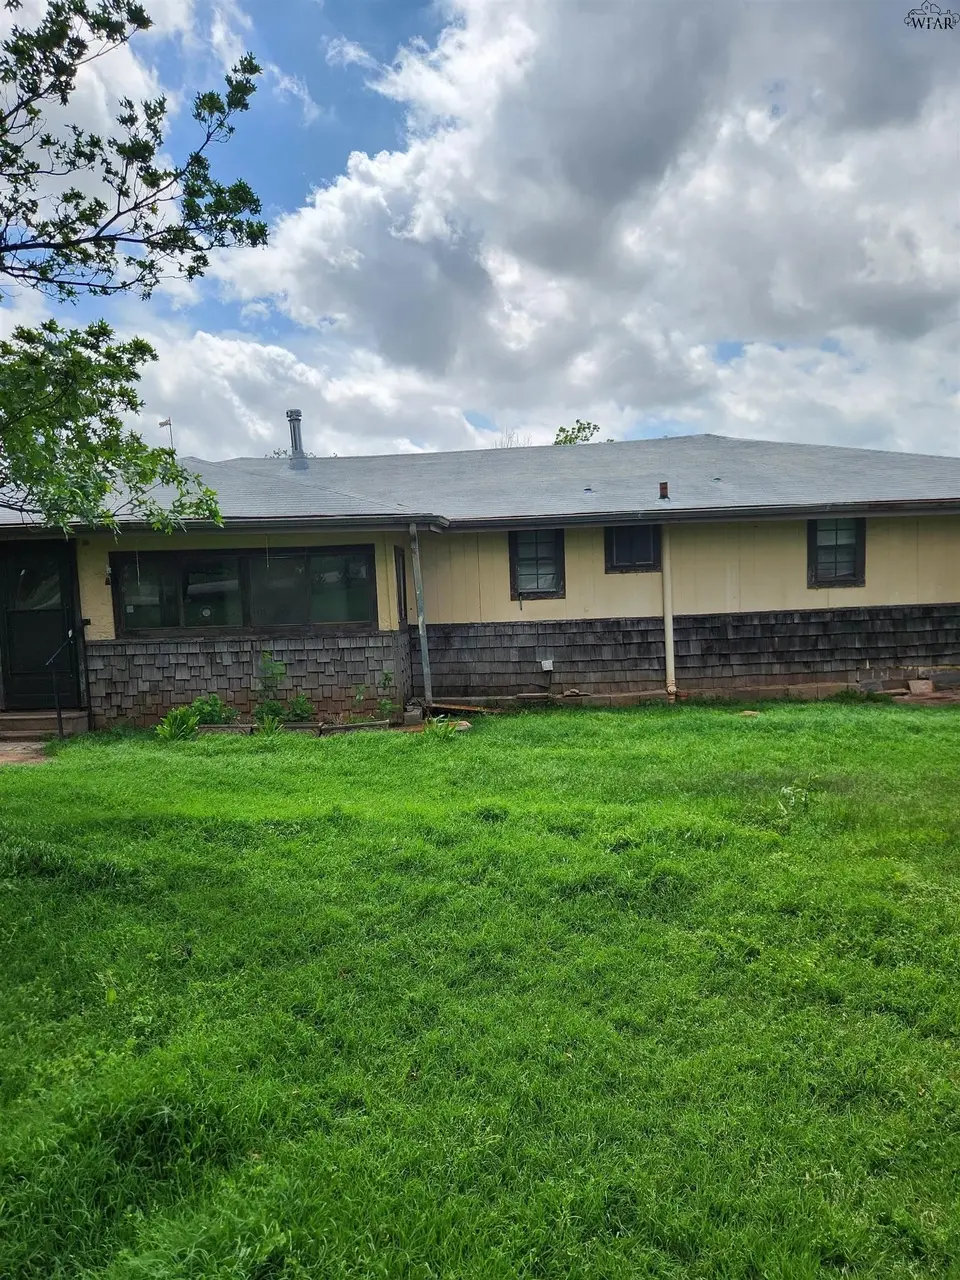
Mobile home has been added on to sets on 2 lots. Includes appliances and a pot belly stove with a wall furnace for heat. Lots are leased from city of Wichita Falls and are 1300 per year. Perfect week-end get away or permanent residence. Previous owners lived there 20 years.
Key facts
- Wall furnace
- Pot belly stove
- Listed 55 days
Tags
Property features AI
Exterior
- Utilities: Public water; Septic sewer
- Home design: Mobile home; Single-story; Faces northeast
- Construction: Masonite exterior
- Exterior features: Composition roof; Outbuilding; Waterfront lot
Interior
- Kitchen: Microwave; Refrigerator
- Flooring: Carpet
- Heating & cooling: Space heater; Window units
- Interior features: Breakfast bar; Pantry
Neighborhood map
What this means for you Summary
Snapshot
- This is a 3-bed/2.0-bath manufactured listed at $50k.
Deal economics
- At list price, monthly cash flow is $318 ($4k/yr) — positive.
- The deal already cash-flows at list — no discount required.
- Meets the 1% rule at list price ($987 rent vs $50k).
- Recommended offer: $49k (3.0% below list) — sets the bar for market timing.
Location & tenants
- Location reads 66/100 on livability (#601 in TX) — a middle-class / working-renter tenant base. Strengths: employment A+, cost of living A+, housing A+; Watch: health & safety C-, crime D-, amenities F.
- Henrietta ISD (rural): math 47% / reading 48% proficiency, ranked #219 of 826 in TX (top 26%) — families likely to look elsewhere, expect single-tenant / working-renter base with shorter leases.
- Zoned schools: Henrietta El (math 47% / reading 47%, grade D-, #1,006 of 4,322 statewide, top 25%, 481 students, 53% FRL); Henrietta Middle (math 50% / reading 43%, grade D+, #443 of 1,662 statewide, top 28%, 226 students, 48% FRL); Henrietta H S (math 37% / reading 72%, grade C-, #379 of 1,632 statewide, top 26%, 287 students, 36% FRL).
- Market conditions: 76 active listings in the ZIP; 13 units permitted in Clay County in 2024 (0 in 5+ unit buildings).
Forward outlook
- Local home prices are declining (-3.0%/yr); year-one equity from $349 of loan paydown is wiped out by about $2k of value loss. Plan a longer hold.
- Clay County population projected at -24% by 2050 — secular population decline; favor cash flow + early exit over multi-decade hold.
- At projected returns (-3.0% appreciation + 3.0% rent growth), your $14k cash investment doubles in ~5 years — after that, you're playing with house money.
Negotiation context
- It's been on market 55 days — a 3% lower offer ($49k) is reasonable based on typical stale-listing flexibility.
Risks & watch-outs
- Watch-outs: property tax is 4.2% of price.
- Climate carrying-cost: moderate wildfire risk; extreme-heat days projected 7→20/yr by 2055 (HVAC capex compounding) — expect insurance premiums to compound above CPI over the hold.
Questions for the listing agent
- It's been on market 55 days. Have you received any prior offers? Is the seller open to a 3% concession, seller financing, or rate buy-down credit?
- Property tax is high relative to price — has the assessment been appealed recently, and will the sale trigger a re-assessment?
- Is there a deadline driving the sale (1031 exchange, divorce, estate, relocation)? That informs how much negotiation room exists.
- Schools are F-rated, which usually means shorter tenancies and higher turnover. Who's the typical renter profile here, and what's been the actual vacancy rate?
- Crime grade is D in this area — have there been break-ins, vandalism, or insurance claims at this property in the last 3 years? What carrier currently insures it and at what premium?
- What's the average days-on-market for RENTAL listings here right now (not sales)? A rising rental-DOM trend means longer vacancies and softer asking-rent achievability than the comps imply.
- What's the recent tenant-quality profile in this submarket — average credit score on applications, eviction rate, late-payment / NSF rate, and stable-employment percentage? A property-management company in the area should have these aggregated.
- How much new for-sale + rental construction is in the pipeline within 1–3 miles? Heavy new supply typically softens prices + rents 12–24 months out; constrained supply supports both.
Investment metrics
- 1% rule
- 1.95% ✓
- Cap rate
- 13.84%
- Cash-on-cash
- 26.97%
- DSCR
- 2.20
- GRM
- 4.3
CMA / ARV
No comps found within radius.
Projected returns pro-forma
-3.0% appreciation · 3.0% rent growth · sell at horizon
- IRR
- 21.0%
- Equity multiple
- 1.86×
- Total profit
- $12,142
- Equity at exit
- $7,530
- IRR
- 29.2%
- Equity multiple
- 3.62×
- Total profit
- $36,980
- Equity at exit
- $4,366
Cash invested: $14,140 (down + closing). Projections, not guarantees.
Landlord ↔ Tenant lean methodology
- Overall (STATE)
- 87 Strongly Landlord-Friendly
- State Texas
- 87 Strongly Landlord-Friendly · R+5
- County
- — inherits STATE
- City
- — inherits STATE
ZIP-level market 76365
- Home prices YoY
- -18.4%
- Active inventory
- 76
- Price-to-rent
- 4.3×
Monthly cashflow live
- Estimated rent
- $987 medium interval (Pro) →
- Mortgage (P&I)
- −$265
- Tax from tax record
- −$176 /mo · $2,113/yr
- Insurance
- −$21
- HOA
- −$0
- Lot rent leased land?
- −$0
- Vacancy / Maint / Mgmt
- −$207
- Net cashflow
- $318
Break-even live
Sensitivity live
| Price | -10% $346 | -5% $332 | +0% $318 | +5% $304 | +10% $289 |
|---|---|---|---|---|---|
| Rent | -10% $240 | -5% $279 | +0% $318 | +5% $357 | +10% $396 |
| Rate | -1.0pp $343 | -0.5pp $331 | base $318 | +0.5pp $305 | +1.0pp $291 |
UW: 25.0% down · 7.5% · 30yr · 1.5% tax · 5.0% vac · 8.0% maint · 8.0% mgmt
Financing live
Cash to close
- Down payment
- $12,625
- Closing costs
- $1,515
- Reserves months
- —
- Total cash needed
- —
Loan-product check · same deal, 3 products live
Conventional
25% down · 7.5% · 30yr
- Down + closing
- —
- Monthly P&I
- —
- Monthly cashflow
- —
- DSCR
- —
- Eligible?
- —
Personal DTI + credit; lowest rate.
DSCR
20% down · 8.5% · 30yr
- Down + closing
- —
- Monthly P&I
- —
- Monthly cashflow
- —
- DSCR
- —
- Eligible?
- —
No personal income docs; deal must DSCR.
Hard money
10% down · 12.0% · 12mo
- Down + closing
- —
- Monthly P&I
- —
- Monthly cashflow
- —
- DSCR
- —
- Eligible?
- —
Short-term bridge; refi at stabilization.
Listing history 20 events
-
2026-06-23days on market $50,500 Active 55 DOM
-
2026-06-21days on market $50,500 Active 54 DOM
-
2026-06-19days on market $50,500 Active 52 DOM
-
2026-06-18days on market $50,500 Active 51 DOM
-
2026-06-17days on market $50,500 Active 50 DOM
-
2026-06-16days on market $50,500 Active 49 DOM
-
2026-06-15days on market $50,500 Active 48 DOM
-
2026-06-14days on market $50,500 Active 46 DOM
-
2026-06-13days on market $50,500 Active 45 DOM
-
2026-06-10days on market $50,500 Active 43 DOM
-
2026-06-09days on market $50,500 Active 42 DOM
-
2026-06-08days on market $50,500 Active 41 DOM
-
2026-06-07days on market $50,500 Active 40 DOM
-
2026-06-05days on market $50,500 Active 37 DOM
-
2026-06-03days on market $50,500 Active 36 DOM
-
2026-06-02days on market $50,500 Active 35 DOM
-
2026-06-01days on market $50,500 Active 34 DOM
-
2026-05-31days on market $50,500 Active 33 DOM
-
2026-05-30days on market $50,500 Active 32 DOM
-
2026-04-27$50,500 Active 275-char remark
ⓘ Source: listings_history table (triggers on properties + properties_extension) + one-shot
backfill from property_details.listing_events for pre-trigger history.
Tax reassessment forecast TX · Resets to sale price
- Current annual tax
- $2,113 · $176/mo
- Projected year-2 tax
- $2,113 · $176/mo
- Expected delta
- $0/yr ($0/mo · 0.0%)
ⓘ Screening estimate from a state-policy table — verify with the county assessor before closing.
Climate risk First Street
- Flood 1/10 Low 0% chance over 30 yrs
- Wildfire 5/10 Major
- Heat 6/10 Major 7 d/yr ≥109°F today · 20 d/yr by 30 yrs out
- Wind 4/10 Moderate 19% chance of damaging wind over 30 yrs
- Air quality 1/10 Low 0 unhealthy d/yr today · 0 by 30 yrs out
Nearby sold comps map
Loading sold comps map…
Walkable amenities ~0.75 mi
Loading nearby amenities…
Taxation est. · year 1
- Rental income
- $11,844
- − Mortgage interest
- −$2,829
- − Property taxes
- −$2,113
- − Insurance
- −$252
- − Repairs & maintenance
- −$948
- − Management
- −$948
- − Depreciation
- −$1,469
- Taxable income
- $3,286
- Est. tax owed @ 24.0%
- −$789
- After-tax cash flow
- $3,025/yr
For passive investors: Depreciation is non-cash, so a rental often shows a tax loss while cash-flowing — sheltering income. Rental losses are passive: they offset passive income freely, and up to $25,000/yr can offset ordinary (W-2) income if you actively participate and your MAGI is under $100k (phasing out to $0 by $150k); unused losses carry forward. On sale, claimed depreciation is recaptured at up to 25%, and gains may owe capital-gains tax (a 1031 exchange can defer both). Figures are a year-1 estimate at your 24.0% rate — not tax advice; consult a CPA.
Schools (NCES district)
- District
- Henrietta ISD
- NCES district ID
- 4822980
- Math proficiency
- 47% ▼ -13.00%
- Reading proficiency
- 48% ▼ -3.00%
- Median HH income
- $49,029
- Composite
- 40.62/100
- National rank
- #3691
- State rank
- #219 of 826 in TX
Livability — Scotland
- Score
- 66/100
- State rank
- #601
- US rank
- #11443
Category grades
Schools grade is shown separately in the Schools card above.
Census & demographics
- Population (ZIP)
- 4,668
Population outlook (Clay County) Hauer SSP2
- Today (2025)
- 9,537 people
- By 2030
- 9,042 · -5.2%
- By 2040
- 8,090 · -15.2%
- By 2050
- 7,255 · -23.9%
- By 2075
- 5,834 · -38.8%
- By 2100
- 4,491 · -52.9%
Race, ethnicity, and origin ACS 2023
- Neighborhood character
- Predominantly White (86%)
- Race & ethnicity
- White 86% Hispanic / Latino 6% Two or more races 6% Black 2% Asian 1%
- Hispanic origin (detail)
- Mexican 6%
- Common ancestry
- Serbian 2% Slovak 2% Lithuanian 2%
- Foreign-born
- 2% · Canada
- Languages at home
- 96% English-only · Spanish 4%
Political lean MEDSL · Clay
- 2024 margin
- Solid R (+79.7) · D 9.9% · R 89.5%
- 2008→2024 swing
- -21.1pp toward R · 2008: -58.6pp · 2024: -79.7pp
- All cycles
- 2024: R+79.7 2020: R+77.6 2016: R+76.6 2012: R+69.7 2008: R+58.6
Not yet ingested
- Civics
- —
Market trends
- HPI YoY
- ▼ -35.62%
- Current HPI
- 158.1207
- Rent YoY
- —
- Metro
- —
- State GDP YoY
- ▲ 3.95%
- F500 in state
- 110
Industry mix (Fortune 500 HQ in TX)
| Industry | F500 HQs | Revenue |
|---|---|---|
| Energy | 16 | $1,198B |
|
||
| Technology | 5 | $198B |
|
||
| Engineering / Construction | 4 | $72B |
|
||
| Energy Services | 3 | $60B |
|
||
| Utilities | 3 | $41B |
|
||
| Healthcare | 2 | $330B |
|
||
Price history
1 event — show timeline
- 2026-04-27 Listed $50,500 WFAOR
Property tax history
+13.6%/yrLatest (2025): $2,113 · -0.7% YoY. Source: county tax records.
Cash-flow waterfall
monthlySold comps — $/sqft
last 12 mo · ≤1 miLoading sold comps…